List of U.S. cities with significant Chinese-American populations

Last updated

Flushing Queens May 2015 2.jpg
The busy intersection of Main Street, Kissena Boulevard, and 41st Avenue in the Flushing Chinatown (法拉盛華埠), Queens, New York City, the Chinese "Times Square". The segment of Main Street between Kissena Boulevard and Roosevelt Avenue, punctuated by the Long Island Rail Road trestle overpass, represents the cultural heart of Flushing Chinatown. Housing over 30,000 individuals born in China alone, the largest by this metric outside Asia, Flushing has become home to the largest and one of the fastest-growing Chinatowns in the world. [14] Approximately 250,000 Chinese live in the Queens borough of New York City.

As the city proper with the nation's largest Chinese-American population by a wide margin, with an estimated 562,205 in 2016 by the 2010-2016 American Community Survey, and as the primary destination for new Chinese immigrants, [3] New York City is subdivided into official municipal boroughs, which themselves are home to significant Chinese populations, with Brooklyn and Queens, adjacently located on Long Island, leading the fastest growth. [15] [16] After the City of New York itself, the boroughs of Queens and Brooklyn encompass the largest Chinese populations, respectively, of all municipalities in the United States.

U.S. cities with significant Chinese-American populations
Brooklyn Chinatown.png
New York City is home to the largest Chinese-American population of any city proper, with over half a million. [1] Multiple large Chinatowns in Manhattan, Brooklyn (above), and Queens are thriving as traditionally urban enclaves, as large-scale Chinese immigration continues into New York, [2] [3] [4] [5] with the largest metropolitan Chinese population outside Asia. [6]
RankBoroughCountyChinese-AmericansPercentage
1 Queens (Chinatowns) Queens 232,31710.1
2 Brooklyn (Chinatowns) Kings 204,2257.8
3 Manhattan (Chinatown) New York 104,1766.4
4 Staten Island Richmond 14,4163.0
5 The Bronx Bronx 7,0710.5

Medium-sized cities

List of medium-sized cities (population between 100,000 and 250,000) with a Chinese-American population of at least one percent of the total population, according to the American Community Survey.

2010-2016
RankCityStateChinese-AmericansPercentage
1 Daly City California 20,04819.0
2 Fremont California 40,75217.9
3 El Monte California 20,19017.5
4 Sunnyvale California 19,39513.0
5 Bellevue Washington 15,80411.6
6 West Covina California 12,19311.3
7 Berkeley California 10,0948.5
8 Elk Grove California 10,7586.6
9 Cambridge Massachusetts 7,4046.8
10 Pasadena California 8,8676.3
11 Ann Arbor Michigan 7,9986.8
12 Torrance California 7,6965.2
13 Spring Valley Nevada 10,9275.7
14 Richmond California 5,5235.1
15 Enterprise Nevada 5,8794.5
16 Hayward California 6,9304.5
17 Naperville Illinois 6,5844.5
18 Fullerton California 5,3283.8
19 Richardson Texas 4,6464.3
20 College Station Texas 4,0793.9
21 Thousand Oaks California 3,8893.0
22 Rancho Cucamonga California 5,7783.3
23 Cary North Carolina 5,2833.4
24 Pomona California 4,8673.2
25 Jersey City New Jersey 8,4203.2
26 Concord California 3,6072.8
27 Madison Wisconsin 6,8992.8
28 Tempe Arizona 4,3612.5
29 New Haven Connecticut 2,6352.0
30 Kent Washington 3,2732.6
31 Antioch California 2,3422.2
32 Chandler Arizona 5,2732.2
33 Orange California 2,7292.0
34 Columbia Missouri 2,7652.4
35 Arlington [n 8] Virginia 4,8272.1
36 Huntington Beach California 3,9252.0
37 Boulder Colorado 2,3762.3
38 Gainesville Florida 2,3581.8
39 Glendale California 3,8181.9
40 Durham North Carolina 3,9901.6
41 Garden Grove California 3,0321.7
42 Stamford Connecticut 1,8841.5
43 Salt Lake City Utah 3,0371.6
44 Eugene Oregon 2,4871.6
45 Syracuse New York 2,3511.6
46 Norwalk California 1,7191.6
47 Providence Rhode Island 2,6471.5
48 Frisco Texas 2,0771.5
49 Miramar Florida 1,9931.5
50 Norman Oklahoma 1,7511.5
51 Carlsbad California 1,7011.5
52 Overland Park Kansas 2,4501.4
53 Costa Mesa California 1,5841.4
54 Rochester Minnesota 1,5071.4
55 Burbank California 1,4731.4
56 Simi Valley California 1,6061.3
57 Fairfield California 1,4071.3
58 Carrollton Texas 1,6051.3
59 Worcester Massachusetts 2,3111.3
60 Roseville California 1,6331.3
61 Corona California 1,9521.2
62 Vallejo California 1,4221.2
63 Vancouver Washington 1,8811.1
64 Fort Collins Colorado 1,6661.1
65 Denton Texas 1,3841.1
66 Pearland Texas 1,1121.1
67 Garland Texas 2,2781.0
68 Baton Rouge Louisiana 2,2071.0
69 Athens Georgia 1,9821.0

Small-sized cities

The following is a list of places in the United States with a population fewer than 100,000 in which at least three percent (five percent in Los Angeles or San Francisco Bay areas) of the total population is Chinese, according to the 2010-2015 American Community Survey, and the 2010 U.S. Census for the U.S. territories.

American Samoa

RankCity [17] Percentage
1 Atu'u 6.7

California

2015 ACS Chinese in California major metro.svg
CityCountyChinese-AmericansPercentage
Davis Yolo 6,4489.7
Isla Vista Santa Barbara 2,2988.7
Florin Sacramento 2,8035.5
Greater Los Angeles Area

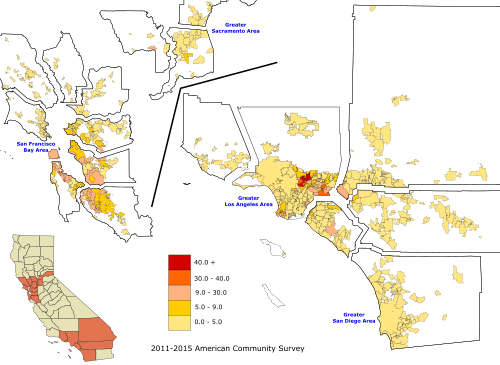
The majority of the Chinese-American population of more than 400,000 in Los Angeles County lives within the San Gabriel Valley, which is particularly noted for cities that have a large Chinese-American ethnic plurality. The following cities have the highest percentage of Chinese-Americans in Greater Los Angeles.

2010-2015
RankCityCountyChinese-AmericansPercentage
1 Arcadia Los Angeles 26,22945.6
2 Monterey Park Los Angeles 27,24444.6
3 Temple City Los Angeles 15,74143.6
4 San Marino Los Angeles 5,76643.3
5 San Gabriel Los Angeles 16,89342.0
6 East San Gabriel Los Angeles 6,10938.2
7 Alhambra Los Angeles 30,68336.2
8 Rowland Heights Los Angeles 18,27636.2
9 Rosemead Los Angeles 19,48035.7
10 Walnut Los Angeles 10,29634.4
11 Hacienda Heights Los Angeles 15,12727.4
12 Diamond Bar Los Angeles 15,20326.9
13 North El Monte Los Angeles 1,07226
14 South San Gabriel Los Angeles 1,94121.8
15 Mayflower Village Los Angeles 1,16221.4
16 East Pasadena Los Angeles 1,01916.8
17 Bradbury Los Angeles 13916.6
18 Cerritos Los Angeles 6,99914.1
19 South Pasadena Los Angeles 3,43213.2
20 Chino Hills San Bernardino 8,91711.6
21 La Habra Heights Los Angeles 56310.4
22 San Pasqual Los Angeles 1859.3
23 Rancho Palos Verdes Los Angeles 3,9059.2
24 Eastvale Riverside 5,0719.0
25 Palos Verdes Estates Los Angeles 1,2038.8
26 Artesia Los Angeles 1,3247.9
27 Baldwin Park Los Angeles 5,9517.8
28 Claremont Los Angeles 2,6497.4
29 Rolling Hills Los Angeles 1337.3
30 Monrovia Los Angeles 2,6237.1
31 Rolling Hills Estates Los Angeles 5676.9
32 Sierra Madre Los Angeles 7446.7
33 La Palma Orange 1,0236.5
34 Oak Park Ventura 9506.3
35 San Dimas Los Angeles 2,0155.9
36 Duarte Los Angeles 1,2115.6
37 Cypress Orange 2,6805.5
38 Avocado Heights Los Angeles 8615.4
39 Montebello Los Angeles 3,3775.3
40 South El Monte Los Angeles 1,0405.1
41 Yorba Linda Orange 3,3525.0
42 Fountain Valley Orange 2,8195.0
San Francisco Bay Area

Traditionally centered in San Francisco and Chinatown Oakland, the suburbanization of the Bay Area's Chinese-American population has resulted in significant concentrations in the southwestern East Bay, eastern Peninsula, and northern Santa Clara County. Chinese enclaves have also formed in many of these cities, in a similar manner to that of Southern California's San Gabriel Valley.

2010-2015
RankCityCountyChinese-AmericansPercentage
1 Millbrae San Mateo 7,19832.1
2 Cupertino Santa Clara 16,83628.0
3 Camino Tassajara Contra Costa 62027.6
4 Foster City San Mateo 7,36122.7
5 Saratoga Santa Clara 6,97722.6
6 Highlands-Baywood Park San Mateo 93422.1
7 Hillsborough San Mateo 2,20119.6
8 Broadmoor San Mateo 1,02619.0
9 Palo Alto Santa Clara 10,50015.8
10 Los Altos Hills Santa Clara 1,27015.3
11 San Leandro Alameda 12,84414.6
12 Albany Alameda 2,81014.6
13 Loyola Santa Clara 50614.3
14 Stanford Santa Clara 2,01814.2
15 Alameda Alameda 10,79014.1
16 Milpitas Santa Clara 9,84713.8
17 Los Altos Santa Clara 4,01413.3
18 Piedmont Alameda 1,42512.8
19 Castro Valley Alameda 7,38511.9
20 San Ramon Contra Costa 8,70811.7
21 Mountain View Santa Clara 8,79311.3
22 El Cerrito Contra Costa 2,75511.3
23 South San Francisco San Mateo 7,33211.1
24 Union City Alameda 7,79710.7
25 San Bruno San Mateo 4,50910.6
26 Burlingame San Mateo 2,9619.9
27 Emeryville Alameda 1,0609.8
28 Dublin Alameda 5,0389.7
29 Belmont San Mateo 2,5659.6
30 San Mateo San Mateo 9,4089.3
31 Brisbane San Mateo 4209.3
32 San Lorenzo Alameda 2,2799.2
33 Moraga Contra Costa 1,4828.8
34 Blackhawk Contra Costa 7988.6
35 Hercules Contra Costa 1,9828.0
36 Fruitdale Santa Clara 788.0
37 Orinda Contra Costa 1,4337.7
38 Atherton San Mateo 5377.6
39 Pleasanton Alameda 5,4027.2
40 Ashland Alameda 1,7107.1
41 Pacifica San Mateo 2,3106.0
42 Newark Alameda 2,5225.7
43 Campbell Santa Clara 2,2275.5
44 Colma San Mateo 825.2

Delaware

RankCityPercentage
1 Hockessin 5.0

Georgia

RankCityPercentage
1 Berkeley Lake, Georgia 6.0
2 Duluth, Georgia 5.4
3 Doraville, Georgia 4.0

Guam

RankCity [18] Percentage
1 Tamuning (including Tumon)5.0
2 Hagåtña 4.0

Hawaii

RankCityCountyChinese-AmericansPercentage
1 East Honolulu Honolulu 5,19010.8
2 Kalaheo Kauai 2976.8
3 Waimea Kauai 925.4
4 Volcano Hawaii 1285.3
5 Aiea Honolulu 4284.6
6 Halawa Honolulu 6564.4
7 Laie Honolulu 2254.0
8 Heʻeia Honolulu 1733.9
9 Ko Olina Honolulu 713.8
10 Pearl City Honolulu 1,7003.6
11 Kaneohe Honolulu 1,2223.6
12 Waikele Honolulu 2823.6
13 Punaluu Honolulu 383.6
14 Wailuā Homesteads Kauai 1973.5
15 Discovery Harbour Hawaii 383.4
16 Maunawili Honolulu 643.0
17 Wailuku Maui 4282.7
18 Kailua Honolulu 9662.5
19 Waimalu Honolulu 3862.9

Indiana

RankCityPercentage
1 West Lafayette 11.1
2 Carmel 3.5

Massachusetts

RankCityPercentage
1 Quincy 15.6
2 Lexington 15.4

New Jersey

RankCityPercentage
1 Kingston 16.0
2 Holmdel Township 12.1
3 West Windsor Township 11.6
4 Montgomery Township 11.4
5 Plainsboro Township 9.7
6 Englewood Cliffs 9.7
7 Fort Lee 8.7
8 Harrison 8.4
9 Bernards Township 8.0
10 East Brunswick 7.1
11 Warren Township 7.1
12 Livingston 6.9
13 Montville 6.9
14 Bridgewater Township 6.7
15 Alpine 6.5
16 Marlboro Township 6.4
17 New Providence 6.2
18 Edison 6.1
19 Parsippany-Troy Hills 6.1
20 Cranbury Township 6.0
21 Piscataway Township 5.8
22 Kendall Park 5.5
23 East Hanover 5.4
24 South Brunswick Township 4.9
25 Closter 4.6
26 Princeton Township 4.5
27 Highland Park 4.3
28 Berkeley Heights 4.1
29 Princeton Junction 4.1
30 Dayton 3.9
31 Millburn 3.9
32 Cresskill 3.9
33 Paramus 3.1
34 Edgewater 3.0

Northern Mariana Islands

RankCity [19] Percentage
1 Tinian 7.6
2 Saipan 7.1

Within Saipan, villages with significant Chinese populations include Garapan (19.7% Chinese), Chalan Piao (18.1% Chinese), Chalan Kanoa IV (15.1% Chinese), and San Antonio (19.8% Chinese). [19]

Ohio

[20]

RankCityPercentage
1 Glenwillow 7.0
2 Solon 5.3
3 Oxford 4.7
4 Athens 4.2
5 Dublin 3.9

Texas

RankCityPercentage
1 Sugar Land 12.8
2 New Territory 5.0
3 Bellaire 8.7
4 Richardson 4.0
5 Jollyville 3.2

Washington

The overwhelming majority of these cities are in King County, while three others (Edmonds, Lynnwood, and Mill Creek) are in Snohomish County. Pullman is in Whitman County.

RankCityPercentage
1 Newcastle 11.5
2 Redmond 8.6
3 Sammamish 7.9
4 Mercer Island 7.4
5 Clyde Hill 7.4
6 Pullman 5.5
7 West Lake 4.0
8 Bryn Mawr-Skyway 3.7
9 Shoreline 3.4

See also

Notes

  1. San Francisco is a consolidated city-county.
  2. Further subdivided into 5 boroughs which are also counties of its own rights.
  3. Honolulu is a consolidated city-county.
  4. Officially, a County under Urban County Executive Form of Government. (Essentially, a highly urbanized county-city.)
  5. Philadelphia is a consolidated city-county.
  6. Lexington is a consolidated city-county.
  7. Washington is a federal district.
  8. Officially, a County under County Manager Plan of government. (Essentially, a highly urbanized county with a population density of at least 500 people per square mile.)

References

  1. 1 2 "SELECTED POPULATION PROFILE IN THE UNITED STATES - 2014 American Community Survey 1-Year Estimates - New York City - Chinese alone". U.S. Census Bureau. Archived from the original on February 14, 2020. Retrieved September 22, 2015.
  2. "Yearbook of Immigration Statistics: 2013 Supplemental Table 2". U.S. Department of Homeland Security. Retrieved October 1, 2014.
  3. 1 2 "Yearbook of Immigration Statistics: 2012 Supplemental Table 2". U.S. Department of Homeland Security. Retrieved February 23, 2014.
  4. "Yearbook of Immigration Statistics: 2011 Supplemental Table 2". U.S. Department of Homeland Security. Retrieved February 23, 2014.
  5. John Marzulli (May 9, 2011). "Malaysian man smuggled illegal Chinese immigrants into Brooklyn using Queen Mary 2: authorities". New York: © Copyright 2012 NY Daily News.com. Archived from the original on June 23, 2012. Retrieved February 23, 2014.
  6. "Chinese New Year 2012 in Flushing". QueensBuzz.com. January 25, 2012. Retrieved February 23, 2014.
  7. "ACS DEMOGRAPHIC AND HOUSING ESTIMATES 2012 American Community Survey 1-Year Estimates New York-Newark-Bridgeport, NY-NJ-CT-PA CSA". U.S. Census Bureau. Archived from the original on February 12, 2020. Retrieved October 27, 2013.
  8. "Yearbook of Immigration Statistics: 2012 Supplemental Table 2". U.S. Department of Homeland Security. Retrieved February 22, 2014.
  9. "Yearbook of Immigration Statistics: 2011 Supplemental Table 2". U.S. Department of Homeland Security. Retrieved February 22, 2014.
  10. "Yearbook of Immigration Statistics: 2010 Supplemental Table 2". U.S. Department of Homeland Security. Retrieved February 22, 2014.
  11. John Marzulli (May 9, 2011). "Malaysian man smuggled illegal Chinese immigrants into Brooklyn using Queen Mary 2: authorities". New York: © Copyright 2012 NY Daily News.com. Archived from the original on June 23, 2012. Retrieved February 22, 2014.
  12. "Chinese New Year 2012 in Flushing". QueensBuzz.com. January 25, 2012. Retrieved February 22, 2014.
  13. "About the San Gabriel Valley" (PDF). Advancingjustu=ice-la.org. Retrieved May 27, 2018.
  14. Melia Robinson (May 27, 2015). "This is what it's like in one of the biggest and fastest growing Chinatowns in the world". Business Insider. Archived from the original on July 30, 2017. Retrieved March 3, 2019.
  15. "Kings County (Brooklyn Borough), New York QuickLinks". U.S. Census Bureau. Retrieved March 4, 2014.
  16. "Queens County (Queens Borough), New York QuickLinks". U.S. Census Bureau. Retrieved March 4, 2014.
  17. U.S. Census Bureau. American FactFinder - 2010 summary file [Geography set to "Atu'u village, American Samoa".] URL unavailable.
  18. U.S. Census Bureau. American FactFinder. 2010 summary file [Geography set to "Tamuning village, Guam" / "Hagatna village, Guam"]. URL unavailable.
  19. 1 2 U.S. Census Bureau. American FactFinder. 2010 summary file [Geography set to "Tinian municipality, Commonwealth of the Northern Mariana Islands" / "Saipan municipality, Commonwealth of the Northern Mariana Islands"]. URL unavailable.
  20. "American FactFinder - Results". Archived from the original on March 5, 2014. Retrieved November 25, 2012.

Further reading