Related Research Articles

The United States does not have an official language at the federal level, but the most commonly used language is American English, which is the de facto national language. In addition, 32 U.S. states out of 50 and all five U.S. territories have declared English as an official language. The great majority of the U.S. population speaks only English at home. The remainder of the population speaks many other languages at home, most notably Spanish, according to the American Community Survey (ACS) of the U.S. Census Bureau; others include indigenous languages originally spoken by Native Americans, Alaska Natives, Native Hawaiians, and native populations in the U.S. unincorporated territories. Other languages were brought in by people from Europe, Africa, Asia, other parts of the Americas, and Oceania, including multiple dialects, creole languages, pidgin languages, and sign languages originating in what is now the United States. Interlingua, an international auxiliary language, was also created in the U.S.

Loudoun County is in the northern part of the Commonwealth of Virginia in the United States. In 2020, the census returned a population of 420,959, making it Virginia's third-most populous county. The county seat is Leesburg. Loudoun County is part of the Washington–Arlington–Alexandria, DC–VA–MD–WV Metropolitan Statistical Area.

Annandale is a census-designated place (CDP) in Fairfax County, Virginia. The population of the CDP was 43,363 as of the 2020 United States Census. It is home to the oldest and largest branch of the Northern Virginia Community College system, and to one of the D.C. area's Koreatowns.

Great Falls is a census-designated place in Fairfax County, Virginia, United States. The population at the 2020 census was 15,953.
The demographics of Toronto, Ontario, Canada make Toronto one of the most multicultural and multiracial cities in the world. In 2021, 57.0 percent of the residents of the metropolitan area belonged to a visible minority group, compared with 51.4 percent in 2016, and 13.6 percent in 1981. Toronto also has established ethnic neighbourhoods such as the multiple Chinatowns, Corso Italia, Little Italy, Little India, Greektown, Koreatown, Little Tokyo, Little Jamaica, Little Portugal, Little Malta, Roncesvalles (Polish), and Bloor West Village (Ukrainian), all of which celebrate the city's multiculturalism. Data from the suburban municipalities are also included for some metrics as most of these municipalities are part of the Toronto CMA.
The demographics of the Bronx are characterized by a Hispanic majority and by the lowest percentage of Whites among all boroughs.
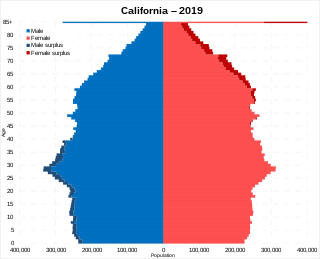
California is the most populus U.S. state, with an estimated population of 38.9 million as of 2023. It has people from a wide variety of ethnic, racial, national, and religious backgrounds.
According to the U.S. Census Bureau, as of 2023, Texas was the second largest state in population after California, with a population of 30,503,301, an increase of more than 1.3 million people, or 4.7%, since the 29,145,505 of the 2020 census. Its apportioned population in 2020 was 29,183,290. Since the beginning of the 21st century, the state of Texas has experienced strong population growth. Texas has many major cities and metropolitan areas, along with many towns and rural areas. Much of the population is concentrated in the major cities of Dallas–Fort Worth, Austin, San Antonio, Houston, McAllen, and El Paso and their corresponding metropolitan areas. The first four aforementioned main urban centers are also referred to as the Texas Triangle megaregion.
The District of Columbia is a federal district with an ethnically diverse population. In 2020, the District had a population of 689,545 people, with a resident density of 11,515 people per square mile.
Florida is the third-most populous state in the United States. Its residents include people from a wide variety of ethnic, racial, national and religious backgrounds. The state has attracted immigrants, particularly from Latin America. Florida's majority ethnic group are European Americans, with approximately 65% of the population identifying as White. National ethnic communities in the state include Cubans, who migrated en masse following the revolution in the mid 20th century. They have been joined by other immigrants from Latin America, and Spanish is spoken by more than 20% of the state's population, with high usage especially in the Miami-Dade County area.

As of the 2020 United States census, Arizona had a population of 7,151,502.

There have been a variety of ethnic groups in Baltimore, Maryland and its surrounding area for 12,000 years. Prior to European colonization, various Native American nations have lived in the Baltimore area for nearly 3 millennia, with the earliest known Native inhabitants dating to the 10th millennium BCE. Following Baltimore's foundation as a subdivision of the Province of Maryland by British colonial authorities in 1661, the city became home to numerous European settlers and immigrants and their African slaves. Since the first English settlers arrived, substantial immigration from all over Europe, the presence of a deeply rooted community of free black people that was the largest in the pre-Civil War United States, out-migration of African-Americans from the Deep South, out-migration of White Southerners from Appalachia, out-migration of Native Americans from the Southeast such as the Lumbee and the Cherokee, and new waves of more recent immigrants from Latin America, the Caribbean, Asia and Africa have added layers of complexity to the workforce and culture of Baltimore, as well as the religious and ethnic fabric of the city. Baltimore's culture has been described as "the blending of Southern culture and [African-American] migration, Northern industry, and the influx of European immigrants—first mixing at the port and its neighborhoods...Baltimore’s character, it’s uniqueness, the dialect, all of it, is a kind of amalgamation of these very different things coming together—with a little Appalachia thrown in...It’s all threaded through these neighborhoods", according to the American studies academic Mary Rizzo.
Asian Californians are residents of the state of California who are of Asian ancestry. California has the largest Asian American population in the U.S., and second highest proportion of Asian American residents, after Hawaii. As of the 2020 U.S. Census, there were over 6 million Asian-Americans in California; 15.5% of the state's population. If including those with partial Asian ancestry, this figure is around 17%. This is a jump from 13.8% recorded in 2010.
Asians in New York City are residents of New York City of Asian descent or origin. New York City has one of the largest Asian American communities in the United States and of the Asian diaspora of any city in the world.
Dallas–Fort Worth is the most populous metropolitan area of Texas, and the Southern United States. Having 7,637,387 residents at the 2020 U.S. census, the metropolitan statistical area has experienced positive growth trends since the former Dallas and Fort Worth metropolitan areas conurbated into the Metroplex. By the 2022 census estimates, its population grew to 7,943,685.

The 2020 United States Census reported that San Francisco had a population of 873,965—an increase from the 2010 Census count of 805,235. The 2022 Census Bureau American Community Survey put the population at 808,437: a decrease of 65,528 from 2020. With a population density of 18,633 per square mile (7,194/km2), San Francisco is the second-most densely populated major American city, behind only New York.
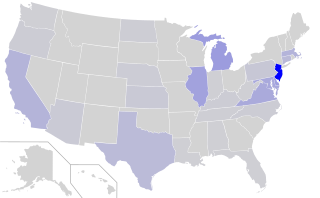
Telugu Americans are citizens of the United States of America who belong to the Telugu sub-ethnic group. The majority of Telugu Americans can trace their roots back to the Indian states of Andhra Pradesh and Telangana, but also from other neighboring states including Karnataka, Tamil Nadu, Odisha, Maharashtra, among others.

Houston has large populations of immigrants from Asia. In addition, the city has the largest Vietnamese American population in Texas and third-largest in the United States as of 2004. Houston also has one of the largest Chinese American, Pakistani American, and Filipino American populations in the United States.
Asian Americans are a fast growing ethnic group in the US state of Nevada. As of the 2020 U.S. Census, Asian Americans were 9.1% of the state's population, or 378,672 people.
References
- ↑ "QuickFacts Virginia". U.S. Census Bureau.
- ↑ "Interactive: Mapping the census". U.S. Census. Archived from the original on May 13, 2011. Retrieved September 30, 2012.
- ↑ "U.S. Census website". U.S. Census. Retrieved September 30, 2012.
- ↑ "The Demographic Statistical Atlas of the United States - Statistical Atlas". statisticalatlas.com. Retrieved 2021-06-01.
- ↑ "The Demographic Statistical Atlas of the United States - Statistical Atlas". statisticalatlas.com. Retrieved 2021-06-01.
- ↑ "Korean the third most spoken language in Georgia, Virginia – The Korea Times" . Retrieved 2021-06-01.
| Central Asian |  | |
|---|---|---|
| East Asian | ||
| South Asian | ||
| Southeast Asian | ||
| Other | ||
| History | ||
| Topics | ||
| Regions | ||