
Unemployment, according to the OECD, is people above a specified age not being in paid employment or self-employment but currently available for work during the reference period.

The United States had an official estimated resident population of 334,914,895 on July 1, 2023, according to the U.S. Census Bureau. This figure includes the 50 states and the District of Columbia but excludes the population of five unincorporated U.S. territories as well as several minor island possessions. The United States is the third most populous country in the world. The Census Bureau showed a population increase of 0.4% for the twelve-month period ending in July 2022, below the world average annual rate of 0.9%. The total fertility rate in the United States estimated for 2022 is 1.665 children per woman, which is below the replacement fertility rate of approximately 2.1.
An economic indicator is a statistic about an economic activity. Economic indicators allow analysis of economic performance and predictions of future performance. One application of economic indicators is the study of business cycles. Economic indicators include various indices, earnings reports, and economic summaries: for example, the unemployment rate, quits rate, housing starts, consumer price index, Inverted yield curve, consumer leverage ratio, industrial production, bankruptcies, gross domestic product, broadband internet penetration, retail sales, price index, and changes in credit conditions.
The following is a list of California unemployment statistics.

Territories of the United States are sub-national administrative divisions overseen by the federal government of the United States. The various American territories differ from the U.S. states and Indian reservations as they are not sovereign entities. In contrast, each state has a sovereignty separate from that of the federal government and each federally recognized Native American tribe possesses limited tribal sovereignty as a "dependent sovereign nation." Territories are classified by incorporation and whether they have an "organized" government through an organic act passed by the Congress. American territories are under American sovereignty and, consequently, may be treated as part of the United States proper in some ways and not others. Unincorporated territories in particular are not considered to be integral parts of the United States, and the Constitution of the United States applies only partially in those territories.
Operation Bootstrap is the name given to a series of projects which transformed the economy of Puerto Rico into an industrial and developed one. The federal government of the United States together with what is known today as the Puerto Rico Industrial Development Company set forth a series of ambitious economical projects that evolved Puerto Rico into an industrial high-income territory. Bootstrap is still considered the economic model of Puerto Rico as the island has still not been able to evolve into a knowledge economy.

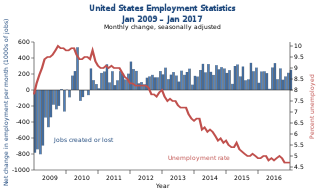
Politicians and pundits frequently refer to the ability of the president of the United States to "create jobs" in the U.S. during his term in office. The numbers are most often seen during the election season or in regard to a president's economic legacy. The numbers typically used and most frequently cited by economists are total nonfarm payroll employment numbers as collected by the Bureau of Labor Statistics on a monthly and annual basis. The BLS also provides numbers for private-sector non-farm employment and other subsets of the aggregate.
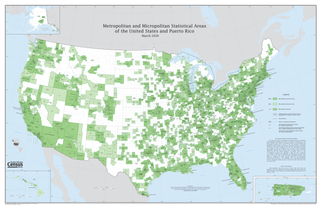
United States micropolitan statistical areas, as defined by the Office of Management and Budget (OMB), are labor market and statistical areas in the United States centered on an urban cluster with a population of at least 10,000 but fewer than 50,000 people. The micropolitan area designation was created in 2003. Like the better-known metropolitan statistical areas, a micropolitan area is a geographic entity used for statistical purposes based on counties and county equivalents. On July 21, 2023, the Office of Management and Budget released revised delineations of the various CBSAs in the United States, which recognized 542 micropolitan areas in the United States, four of which are in Puerto Rico.

This list of U.S. states includes data for population, murders and non-negligent manslaughter, murders, gun murders, and gun ownership percentage, and calculates rates per 100,000. The population data is from the U.S. Census Bureau. Murder rates were calculated based on the FBI Uniform Crime Reports and the estimated census population of each state.

The economy of Puerto Rico is classified as a high income economy by the World Bank and as the most competitive economy in Latin America by the World Economic Forum. The main drivers of Puerto Rico's economy are manufacturing, primarily pharmaceuticals, textiles, petrochemicals, and electronics; followed by the service industry, notably finance, insurance, real estate, and tourism. The geography of Puerto Rico and its political status are both determining factors on its economic prosperity, primarily due to its relatively small size as an island; its lack of natural resources used to produce raw materials, and, consequently, its dependence on imports; as well as its relationship with the United States federal government, which controls its foreign policies while exerting trading restrictions, particularly in its shipping industry.

In the United States, poverty has both social and political implications. In 2020, there were 37.2 million people in poverty. Some of the many causes include income inequality, inflation, unemployment, debt traps and poor education. The majority of adults living in poverty are employed and have at least a high school education. Although the US is a relatively wealthy country by international standards, it has a persistently high poverty rate compared to other developed countries due in part to a less generous welfare system.

The International Labor Comparisons Program (ILC) of the U.S. Bureau of Labor Statistics (BLS) adjusts economic statistics to a common conceptual framework in order to make data comparable across countries. Its data can be used to evaluate the economic performance of one country relative to that of other countries and to assess international competitiveness.
Unemployment in the United States discusses the causes and measures of U.S. unemployment and strategies for reducing it. Job creation and unemployment are affected by factors such as economic conditions, global competition, education, automation, and demographics. These factors can affect the number of workers, the duration of unemployment, and wage levels.
