
This is a list of U.S. states and the District of Columbia by research and development (R&D) spending in 2020 adjusted US dollar.
This is a list of U.S. states and the District of Columbia by research and development (R&D) spending in 2020 adjusted US dollar.
States by R&D spending, spending per capita and federal government spending as percentage of total R&D spending.
| National rank | State | Expenditures on R&D (millions of US$) [1] | Expenditures on R&D per capita in US$ [2] | Federal government share in % [3] |
|---|---|---|---|---|
| 1 | 217,976 | 4,220 | 1.6 | |
| 2 | 46,392 | 4,496 | 0.6 | |
| 3 | 44,907 | 5,188 | 1.3 | |
| 4 | 36,559 | 1,343 | 3.8 | |
| 5 | 34,589 | 950 | 2.3 | |
| 6 | 27,853 | 3,864 | 52.1 | |
| 7 | 24,898 | 2,579 | 0.5 | |
| 8 | 24,121 | 2,604 | 2.4 | |
| 9 | 21,687 | 1,383 | 1.9 | |
| 10 | 19,203 | 1,368 | 0.9 | |
| 11 | 18,064 | 1,488 | 1.9 | |
| 12 | 16,647 | 1,235 | 11.3 | |
| 13 | 13,317 | 1,311 | 15.2 | |
| 14 | 11,888 | 495 | 6.4 | |
| 15 | 11,537 | 2,326 | 0.8 | |
| 16 | 10,303 | 1,293 | 2.4 | |
| 17 | 10,301 | 1,569 | 0.6 | |
| 18 | 10,297 | 1,356 | 6.1 | |
| 19 | 9,486 | 2,513 | 0.2 | |
| 20 | 9,056 | 1,079 | 2.9 | |
| 21 | 8,455 | 745 | 2.3 | |
| 22 | 8,438 | 3,388 | 8.2 | |
| 23 | 8,346 | 1,320 | 0.7 | |
| 24 | 8,229 | 1,400 | 1.5 | |
| 25 | 6,187 | 714 | 12.7 | |
| 26 | 5,701 | 1,006 | 25.3 | |
| — | 5,701 | 8,050 | 58.3 | |
| 27 | 4,480 | 1,385 | 1.6 | |
| 28 | 4,452 | 1,272 | 4.0 | |
| 29 | 3,616 | 1,133 | 2.6 | |
| 30 | 3,332 | 2,298 | 1.9 | |
| 31 | 2,929 | 1,795 | 1.3 | |
| 32 | 2,749 | 2,689 | 0.1 | |
| 33 | 2,628 | 540 | 4.1 | |
| 34 | 1,911 | 463 | 0.4 | |
| 35 | 1,892 | 425 | 9.8 | |
| 36 | 1,638 | 1,351 | 21.4 | |
| 37 | 1,492 | 601 | 2.6 | |
| 38 | 1,453 | 269 | 3.6 | |
| 39 | 1,252 | 406 | 1.6 | |
| 40 | 1,169 | 2,031 | 2.2 | |
| 41 | 1,098 | 398 | 27.3 | |
| 42 | 892 | 286 | 4.6 | |
| 43 | 794 | 453 | 11.5 | |
| 44 | 769 | 396 | 1.0 | |
| 45 | 679 | 795 | 5.4 | |
| 46 | 608 | 437 | 10.7 | |
| 47 | 574 | 711 | 0.7 | |
| 48 | 556 | 341 | 10.1 | |
| 49 | 344 | 393 | 4.9 | |
| 50 | 339 | 410 | 25.7 |

The United States is a highly developed/advanced mixed economy. It is the world's largest economy by nominal GDP, and the second-largest by purchasing power parity (PPP) behind China. It has the world's seventh-highest per capita GDP (nominal) and the eighth-highest per capita GDP (PPP) as of 2022. The U.S. accounted for 25.4% of the global economy in 2022 in nominal terms, and around 15.6% in PPP terms. The U.S. dollar is the currency of record most used in international transactions and is the world's reserve currency, backed by a large U.S. treasuries market, its role as the reference standard for the petrodollar system, and its linked eurodollar. Several countries use it as their official currency and in others it is the de facto currency.

Research and development, is the set of innovative activities undertaken by corporations or governments in developing new services or products, and improving existing ones. Research and development constitutes the first stage of development of a potential new service or the production process.
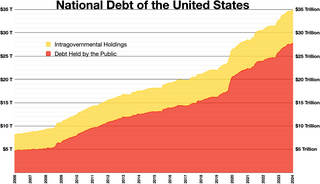
The national debt of the United States is the total national debt owed by the federal government of the United States to Treasury security holders. The national debt at any point in time is the face value of the then-outstanding Treasury securities that have been issued by the Treasury and other federal agencies. The terms "national deficit" and "national surplus" usually refer to the federal government budget balance from year to year, not the cumulative amount of debt. In a deficit year the national debt increases as the government needs to borrow funds to finance the deficit, while in a surplus year the debt decreases as more money is received than spent, enabling the government to reduce the debt by buying back some Treasury securities. In general, government debt increases as a result of government spending and decreases from tax or other receipts, both of which fluctuate during the course of a fiscal year. There are two components of gross national debt:
Prescription drug list prices in the United States continually are among the highest in the world. The high cost of prescription drugs became a major topic of discussion in the 21st century, leading up to the American health care reform debate of 2009, and received renewed attention in 2015. One major reason for high prescription drug prices in the United States relative to other countries is the inability of government-granted monopolies in the American health care sector to use their bargaining power to negotiate lower prices, and the American payer ends up subsidizing the world's R&D spending on drugs.

"Starve the beast" is a political strategy employed by American conservatives to limit government spending by cutting taxes, to deprive the federal government of revenue in a deliberate effort to force it to reduce spending. The term "the beast", in this context, refers to the United States federal government and the programs it funds, using mainly American tax money, particularly social programs such as education, welfare, Social Security, Medicare, and Medicaid.
As a federal agency, the National Aeronautics and Space Administration (NASA) receives its funding from the annual federal budget passed by the United States Congress. The following charts detail the amount of federal funding allotted to NASA each year over its history to pursue programs in aeronautics research, robotic spaceflight, technology development, and human space exploration programs.

The National Taxpayers Union (NTU) is a fiscally conservative taxpayer advocacy organization and taxpayers union in the United States, founded in 1977 by James Dale Davidson. NTU says that it is the oldest taxpayer advocacy organization in the nation. It is closely affiliated with a non-profit foundation, the National Taxpayers Union Foundation (NTUF). The organization has ranked politicians on their perceived fiscal responsibility, in the eyes of the National Taxpayers Union.

Government spending or expenditure includes all government consumption, investment, and transfer payments. In national income accounting, the acquisition by governments of goods and services for current use, to directly satisfy the individual or collective needs of the community, is classed as government final consumption expenditure. Government acquisition of goods and services intended to create future benefits, such as infrastructure investment or research spending, is classed as government investment. These two types of government spending, on final consumption and on gross capital formation, together constitute one of the major components of gross domestic product.

The military budget of the United States is the largest portion of the discretionary federal budget allocated to the Department of Defense (DoD), or more broadly, the portion of the budget that goes to any military-related expenditures. The military budget pays the salaries, training, and health care of uniformed and civilian personnel, maintains arms, equipment and facilities, funds operations, and develops and buys new items. The budget funds five branches of the US military: the Army, Navy, Marine Corps, Air Force, and Space Force.

The financing of electoral campaigns in the United States happens at the federal, state, and local levels by contributions from individuals, corporations, political action committees, and sometimes the government. Campaign spending has risen steadily at least since 1990.
Medicare Part D, also called the Medicare prescription drug benefit, is an optional United States federal-government program to help Medicare beneficiaries pay for self-administered prescription drugs. Part D was enacted as part of the Medicare Modernization Act of 2003 and went into effect on January 1, 2006. Under the program, drug benefits are provided by private insurance plans that receive premiums from both enrollees and the government. Part D plans typically pay most of the cost for prescriptions filled by their enrollees. However, plans are later reimbursed for much of this cost through rebates paid by manufacturers and pharmacies.
The military budget of China is the portion of the overall budget of China that is allocated for the funding of the military of China. This military budget finances employee salaries and training costs, the maintenance of equipment and facilities, support of new or ongoing operations, and development and procurement of new weapons, equipment, and vehicles. Every March, as part of its annual state budget, China releases a single overall figure for national military expenditures.

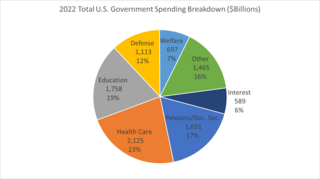
The United States budget comprises the spending and revenues of the U.S. federal government. The budget is the financial representation of the priorities of the government, reflecting historical debates and competing economic philosophies. The government primarily spends on healthcare, retirement, and defense programs. The non-partisan Congressional Budget Office provides extensive analysis of the budget and its economic effects. It has reported that large budget deficits over the next 30 years are projected to drive federal debt held by the public to unprecedented levels—from 98 percent of gross domestic product (GDP) in 2020 to 195 percent by 2050.
The ability of the United States government to tax and spend in specific regions has large implications to economic activity and performance. Taxes are indexed to wages and profits and therefore areas of high taxation are correlated with areas of higher per capita income and more economic activity.

Maryland's leading industries by employment are health care and social assistance, state and local government, retail trade, and professional and technical services. Maryland's Gross State Product (GSP) was $295.4 billion in 2010. The Government sector produced $52.1 billion and accounted for 18 percent of Maryland's GSP in 2009. Federal government, including military and civilian, accounted for slightly more than half at just over $27 billion, while state and local government combined for nearly $25 billion. The Fort George G. Meade military installation, which includes employees of the National Security Agency, is the state's biggest employer at 44,540. The largest private sector industry is real estate with $48.4 billion, or 17 percent of economic activity. Large private employers in Maryland include Black & Decker, Legg Mason, Lockheed Martin, Marriott International, ZeniMax Media, McCormick & Company, Perdue Farms, General Motors, IBM, Northrop Grumman, and Verizon.
Public schools in the United States of America provide basic education from kindergarten until the twelfth grade. This is provided free of charge for the students and parents, but is paid for by taxes on property owners as well as general taxes collected by the federal government. This education is mandated by the states. With the completion of this basic schooling, one obtains a high school diploma as certification of basic skills for employers.
The US carries out 46% of global research and development (R&D) in the life sciences, making it the world leader in medical research.
Government spending in the United States is the spending of the federal government of the United States and the spending of its state and local governments.

Public research and development refers to the R&D activities related to public sectors, including governments, colleges and non-profit organizations. Public R&D include academic fundamental research, applied research and R&D grants and contracts to private sectors, where later two are known as 'R&D subsidy'. Public R&D could be understood as a funder or a performer of an R&D activity. According to National Science Foundation in U.S., in 2015, R&D expenditures performed by federal governments, local governments, colleges and non-profit organizations are 54, 0.6, 64, and 20 billions of dollars, respectively. Meanwhile, industries perform R&D expenditures of 356 billion dollars. Moreover, R&D expenditures funded by federal governments, local governments, colleges and non-profit organizations are 121, 4.3, 17, and 19 billions of dollars, respectively. R&D expenditures funded by industries are 333 billion dollars. In terms of R&D funders, public R&D to private R&D ratio is about 0.5.