This article is missing information about median wages in the U.S. territories, and mean wages in American Samoa and the Northern Mariana Islands.(July 2019) |
This article contains lists of U.S. states, the District of Columbia, and U.S. territories by annual median wage and annual mean wage.
The first table contains a list of U.S. states and territories by annual median income. The second table contains a list of U.S. states and territories by annual mean wage.
Average wage in the United States was $69,392 in 2020. [1] Median income per person in the U.S. was $42,800 in 2019. [2] The average is higher than the median because there are a small number of individuals with very high earnings, and a large number of individuals with relatively low earnings. (See Income inequality in the United States.)
Map of U.S. states by annual average salary (as of 2020). [3]
Dark Blue | above $100,000 |
Light Blue | $70,000 to $99,999 |
Orange | $50,000 to $69,999 |
Red | below $49,999 |
National rank | State or territory | Median wage in US$ [4] | Average earnings in US$ [3] |
---|---|---|---|
1 | District of Columbia | $79,960 | $130,836 |
2 | Massachusetts | $58,540 | $93,765 |
3 | Washington | $50,450 | $90,128 |
4 | Alaska | $48,820 | $78,089 |
5 | New York | $48,800 | $95,470 |
6 | Connecticut | $48,720 | $86,235 |
7 | Maryland | $48,460 | $79,257 |
8 | New Jersey | $48,200 | $86,170 |
9 | Colorado | $47,940 | $76,485 |
10 | California | $47,920 | $93,517 |
11 | Rhode Island | $47,780 | $71,848 |
12 | Hawaii | $47,700 | $72,694 |
13 | Minnesota | $47,590 | $74,527 |
14 | Virginia | $47,200 | $74,924 |
15 | New Hampshire | $46,960 | $79,928 |
16 | North Dakota | $46,960 | $69,662 |
17 | Oregon | $46,910 | $72,616 |
17 | Vermont | $46,910 | $60,840 |
19 | Delaware | $46,700 | $72,044 |
20 | Illinois | $46,630 | $79,852 |
21 | Wyoming | $45,890 | $62,345 |
22 | Michigan | $45,190 | $68,667 |
23 | Wisconsin | $45,000 | $66,542 |
24 | Pennsylvania | $44,900 | $74,420 |
25 | Maine | $42,950 | $61,791 |
26 | Ohio | $39,680 | $67,110 |
27 | Arizona | $39,500 | $67,937 |
28 | Iowa | $39,070 | $62,273 |
29 | Texas | $39,030 | $73,069 |
30 | Utah | $38,860 | $64,689 |
31 | Nebraska | $38,780 | $67,902 |
32 | North Carolina | $38,370 | $66,991 |
33 | Georgia | $38,340 | $68,677 |
34 | Indiana | $38,330 | $68,221 |
35 | Missouri | $38,130 | $64,278 |
36 | Kansas | $38,050 | $65,062 |
37 | Montana | $38,050 | $57,994 |
38 | Florida | $37,920 | $63,238 |
39 | Nevada | $37,900 | $67,922 |
40 | New Mexico | $37,810 | $59,412 |
41 | South Dakota | $37,710 | $67,001 |
42 | Tennessee | $37,700 | $68,327 |
43 | Kentucky | $37,660 | $60,619 |
44 | Idaho | $37,550 | $60,515 |
45 | Oklahoma | $37,500 | $61,686 |
46 | Louisiana | $37,320 | $62,679 |
47 | Alabama | $37,250 | $59,152 |
47 | South Carolina | $37,250 | $60,698 |
49 | West Virginia | $36,860 | $58,638 |
50 | Arkansas | $36,680 | $56,800 |
51 | Mississippi | $35,070 | $51,608 |
52 | Puerto Rico | $20,100 [5] | No data |
— | American Samoa | No data | No data |
— | Guam | No data | No data |
— | Northern Mariana Islands | No data | No data |
— | U.S. Virgin Islands | No data | No data |
National rank | State or territory | Mean wage in US$ [6] |
---|---|---|
1 | District of Columbia | $87,920 |
2 | Massachusetts | $63,910 |
3 | New York | $61,870 |
4 | Connecticut | $60,780 |
5 | Washington | $59,410 |
6 | California | $59,150 |
7 | Maryland | $58,770 |
8 | Alaska | $58,710 |
9 | New Jersey | $58,210 |
10 | Colorado | $55,820 |
11 | Virginia | $55,310 |
12 | Rhode Island | $54,810 |
13 | Minnesota | $54,200 |
14 | Illinois | $53,790 |
15 | Delaware | $53,320 |
16 | Hawaii | $52,900 |
17 | New Hampshire | $52,350 |
18 | Oregon | $52,000 |
19 | Vermont | $50,150 |
20 | Pennsylvania | $50,030 |
21 | Texas | $49,720 |
22 | North Dakota | $49,620 |
23 | Michigan | $49,510 |
24 | Arizona | $49,290 |
25 | Wyoming | $48,630 |
26 | Georgia | $48,280 |
27 | Ohio | $48,220 |
28 | Utah | $47,920 |
29 | Wisconsin | $47,350 |
30 | North Carolina | $47,200 |
31 | Maine | $46,810 |
32 | Nebraska | $46,710 |
33 | Missouri | $46,460 |
34 | Nevada | $46,170 |
35 | Iowa | $46,150 |
36 | Florida | $46,010 |
37 | New Mexico | $45,400 |
38 | Indiana | $45,290 |
39 | Kansas | $45,280 |
40 | Tennessee | $44,660 |
41 | Oklahoma | $44,220 |
42 | Montana | $43,860 |
43 | Alabama | $43,790 |
44 | Idaho | $43,480 |
45 | Kentucky | $43,210 |
46 | South Carolina | $43,210 |
47 | U.S. Virgin Islands | $42,870 |
48 | Louisiana | $42,660 |
49 | West Virginia | $42,370 |
50 | South Dakota | $41,800 |
51 | Arkansas | $41,540 |
52 | Mississippi | $39,420 |
53 | Guam | $36,550 |
54 | Puerto Rico | $29,460 |
— | American Samoa | No data |
— | Northern Mariana Islands | No data |
In economics, income distribution covers how a country's total GDP is distributed amongst its population. Economic theory and economic policy have long seen income and its distribution as a central concern. Unequal distribution of income causes economic inequality which is a concern in almost all countries around the world.
The economies of Canada and the United States are similar because both are developed countries. While both countries feature in the top ten economies in the world in 2022, the U.S. is the largest economy in the world, with US$24.8 trillion, with Canada ranking ninth at US$2.2 trillion.
The median income is the income amount that divides a population into two equally-sized groups, half having an income above that amount, and half having an income below that amount. It may differ from the mean income. Both of these are ways of understanding income distribution.
Poverty in Australia deals with the incidence of relative poverty in Australia and its measurement. Relative income poverty is measured as a percentage of the population that earns less in comparison to the median wage of the working population.
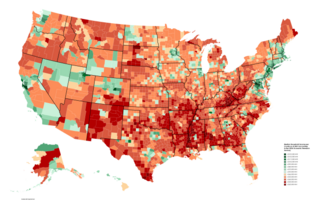
Household income is an economic standard that can be applied to one household, or aggregated across a large group such as a county, city, or the whole country. It is commonly used by the United States government and private institutions to describe a household's economic status or to track economic trends in the US.
Household income is a measure of the combined incomes of all people sharing a particular household or place of residence. It includes every form of income, e.g., salaries and wages, retirement income, near cash government transfers like food stamps, and investment gains.
Personal income is an individual's total earnings from wages, investment interest, and other sources. The Bureau of Labor Statistics reported a median weekly personal income of $1,037 for full-time workers in the United States in Q1 2022. For the year 2020, the U.S. Census Bureau estimates that the median annual earnings for all workers was $41,535; and more specifically estimates that median annual earnings for those who worked full-time, year round, was $56,287.
Affluence refers to an individual's or household's economical and financial advantage in comparison to others. It may be assessed through either income or wealth.
Median household disposable income in the UK was £29,400 in the financial year ending (FYE) 2019, up 1.4% (£400) compared with growth over recent years; median income grew by an average of 0.7% per year between FYE 2017 and FYE 2019, compared with 2.8% between FYE 2013 and FYE 2017.
A maximum wage, also often called a wage ceiling, is a legal limit on how much income an individual can earn. It is a prescribed limitation which can be used to effect change in an economic structure, but its effects are unrelated to those of minimum wage laws used currently by some states to enforce minimum earnings.
Physicians are an important part of health care in the United States. The vast majority of physicians in the US have a Doctor of Medicine (MD) degree, though some have a Doctor of Osteopathic Medicine (DO), or Bachelor of Medicine, Bachelor of Surgery (MBBS).
In the United States, despite the efforts of equality proponents, income inequality persists among races and ethnicities. Asian Americans have the highest median income, followed by White Americans, Hispanic Americans, African Americans, and Native Americans. A variety of explanations for these differences have been proposed—such as differing access to education, two parent home family structure, high school dropout rates and experience of discrimination and deep-seated and systemic anti-Black racism—and the topic is highly controversial.
The gender pay gap or gender wage gap is the average difference between the remuneration for men and women who are working. Women are generally found to be paid less than men. There are two distinct numbers regarding the pay gap: non-adjusted versus adjusted pay gap. The latter typically takes into account differences in hours worked, occupations chosen, education and job experience. In the United States, for example, the non-adjusted average woman's annual salary is 79–83% of the average man's salary, compared to 95–99% for the adjusted average salary.
Wealth is the total sum value of monetary assets and valuable material possessions owned by an individual, minus private debt, at a set point in time.