India is the most populous country in the world with one-sixth of the world's population. According to official estimates in 2022, India's population stood at over 1.42 billion.

The United States had an official estimated resident population of 333,287,557 on July 1, 2022, according to the U.S. Census Bureau. This figure includes the 50 states and the District of Columbia but excludes the population of five unincorporated U.S. territories as well as several minor island possessions. The United States is the third most populous country in the world. The Census Bureau showed a population increase of 0.4% for the twelve-month period ending in July 2022, below the world average annual rate of 0.9%. The total fertility rate in the United States estimated for 2022 is 1.665 children per woman, which is below the replacement fertility rate of approximately 2.1.

Mortality rate, or death rate, is a measure of the number of deaths in a particular population, scaled to the size of that population, per unit of time. Mortality rate is typically expressed in units of deaths per 1,000 individuals per year; thus, a mortality rate of 9.5 in a population of 1,000 would mean 9.5 deaths per year in that entire population, or 0.95% out of the total. It is distinct from "morbidity", which is either the prevalence or incidence of a disease, and also from the incidence rate.

A drug overdose is the ingestion or application of a drug or other substance in quantities much greater than are recommended. Typically it is used for cases when a risk to health will potentially result. An overdose may result in a toxic state or death.
The maternal mortality ratio is a key performance indicator (KPI) for efforts to improve the health and safety of mothers before, during, and after childbirth per country worldwide. Often referred to as MMR, it is the annual number of female deaths per 100,000 live births from any cause related to or aggravated by pregnancy or its management. It is not to be confused with the maternal mortality rate, which is the number of maternal deaths in a given period per 100,000 women of reproductive age during the same time period. The statistics are gathered by WHO, UNICEF, UNFPA, World Bank Group, and the United Nations Population Division. The yearly report started in 1990 and is called Trends in Maternal Mortality. As of the 2015 data published in 2016, the countries that have seen an increase in the maternal mortality ratio since 1990 are the Bahamas, Georgia, Guyana, Jamaica, Dem. People’s Rep. Korea, Serbia, South Africa, St. Lucia, Suriname, Tonga, United States, Venezuela, RB Zimbabwe. But according to Sustainable Development Goals report 2018, the overall maternal mortality ratio has declined by 37 percent since 2002. Nearly 303,000 women died due to complications during pregnancy.
The National Center for Health Statistics (NCHS) is a U.S. government agency that provides statistical information to guide actions and policies to improve the public health of the American people. It is a unit of the Centers for Disease Control and Prevention (CDC) and a principal agency of the U.S. Federal Statistical System. It is headquartered at University Town Center in Hyattsville, Maryland, just outside Washington, D.C.

Aid to Families with Dependent Children (AFDC) was a federal assistance program in the United States in effect from 1935 to 1997, created by the Social Security Act (SSA) and administered by the United States Department of Health and Human Services that provided financial assistance to children whose families had low or no income.
The National Center for Education Statistics (NCES) is the part of the United States Department of Education's Institute of Education Sciences (IES) that collects, analyzes, and publishes statistics on education and public school district finance information in the United States. It also conducts international comparisons of education statistics and provides leadership in developing and promoting the use of standardized terminology and definitions for the collection of those statistics. NCES is a principal agency of the U.S. Federal Statistical System.

Gun violence results in tens of thousands of deaths and injuries annually in the United States. By 2022, gun violence was responsible for about 100 daily fatalities and hundreds of daily injuries. In 2018, the most recent year for which data are available as of 2021, the Centers for Disease Control and Prevention's (CDC) National Center for Health Statistics reports 38,390 deaths by firearm, of which 24,432 were by suicide. The rate of firearm deaths per 100,000 people rose from 10.3 per 100,000 in 1999 to 12 per 100,000 in 2017, with 109 people dying per day or about 14,542 homicides in total, being 11.9 per 100,000 in 2018. In 2010, there were 19,392 firearm-related suicides, and 11,078 firearm-related homicides in the U.S. In 2010, 358 murders were reported involving a rifle while 6,009 were reported involving a handgun; another 1,939 were reported with an unspecified type of firearm. In 2011, a total of 478,400 fatal and nonfatal violent crimes were committed with a firearm. Gun crimes are covered by 18 USC 922 and 18 USC 924, which are the principal federal firearm statutes.
This article is a list of the U.S. states, with population, murders and non-negligent manslaughter, murders, gun murders, and gun ownership percentage, then calculated rates per 100,000. The population data is from the U.S. Census Bureau. Murder rates were calculated based on the FBI Uniform Crime Reports and the estimated census population of each state.
Tennessee is the sixteenth most populous state in the United States, and has the twentieth-highest population density. The 2020 United States census reported its population to be 6,916,897.
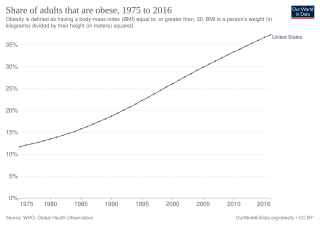
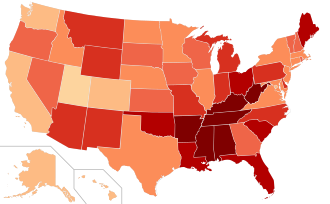
Obesity is common in the United States and is a major health issue associated with numerous diseases, specifically an increased risk of certain types of cancer, coronary artery disease, type 2 diabetes, stroke, and cardiovascular disease, as well as significant increases in early mortality and economic costs.

The traditional family structure in the United States is considered a family support system involving two married individuals providing care and stability for their biological offspring. However, this two-parent, heterosexual, nuclear family has become less prevalent, and nontraditional family forms have become more common. The family is created at birth and establishes ties across generations. Those generations, the extended family of aunts and uncles, grandparents, and cousins, can hold significant emotional and economic roles for the nuclear family.
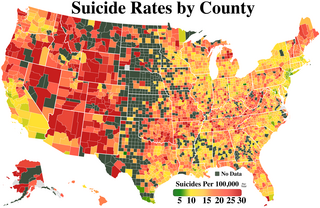
Suicide is a major national public health issue in the United States. The country has one of the highest suicide rates among wealthy nations. Since the beginning of 2023, there have been an average of about 67 suicide deaths per day in the United States. In 2020, there were 45,799 recorded suicides, up from 42,773 in 2014, according to the CDC's National Center for Health Statistics (NCHS). On average, adjusted for age, the annual U.S. suicide rate increased 30% between 2000 and 2020, from 10.4 to 13.5 suicides per 100,000 people. In 2018, 14.2 people per 100,000 died by suicide, the highest rate recorded in more than 30 years. Due to the stigma surrounding suicide, it is suspected that suicide is generally underreported. In April 2016, the CDC released data showing that the suicide rate in the United States had hit a 30-year high, and later in June 2018, released further data showing that the rate has continued to increase and has increased in every U.S. state except Nevada since 1999. From 2000 to 2020, more than 800,000 people died by suicide in the United States, with males representing 78.7% of all suicides that happened between 2000 and 2020. Surging death rates from suicide, drug overdoses and alcoholism, what researchers refer to as "deaths of despair", are largely responsible for a consecutive three year decline of life expectancy in the U.S. This constitutes the first three-year drop in life expectancy in the U.S. since the years 1915–1918.
In African-American history, the post–civil rights era is defined as the time period in the United States since Congressional passage of the Civil Rights Act of 1964, the Voting Rights Act of 1965, and the Fair Housing Act of 1968, major federal legislation that ended legal segregation, gained federal oversight and enforcement of voter registration and electoral practices in states or areas with a history of discriminatory practices, and ended discrimination in the renting and buying of housing.

The family structure of African Americans has long been a matter of national public policy interest. A 1965 report by Daniel Patrick Moynihan, known as The Moynihan Report, examined the link between black poverty and family structure. It hypothesized that the destruction of the black nuclear family structure would hinder further progress toward economic and political equality.
This article is a list of U.S. states with firearm death rates per 100,000 population.

The United States Centers for Disease Control and Prevention has data on drug overdose death rates and totals. Over 1,106,000 US residents died from drug overdoses from 1968 to 2020. Over 932,000 from 1999 through 2020. Over 91,000 in 2020. 28 people out of every 100,000 died from drug overdoses in 2020 in the US. Around 108,900 people died in 2021. Opioids were involved in 70.6% of the nearly 71,000 deaths in 2019.