

This is a list of U.S. states with firearm death rates per 100,000 population.
This is a list of U.S. states with firearm death rates per 100,000 population.
An estimated 20,966 firearm homicides and 26,320 firearm suicides occurred in the United States during 2021. [3] In 2020, over 45,000 people in the United States (13.6 per 100,000 people) died by firearms. More than half of these people died by suicide. According to the FBI's 2020 Uniform Crime Report, the total number of murders increased by nearly one-third from 2019 to 2020. In both years, three-quarters of these murders were committed with firearms; that percentage slightly increased from 2019 (74%) to 2020 (77%). [4]
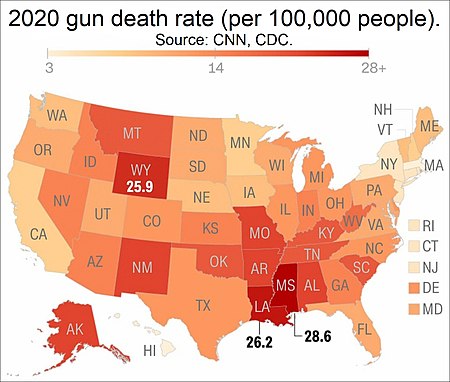
In 2017 and 2018, of all trauma-based deaths in the United States (including car crashes), firearm deaths caused the greatest loss of "years of potential life," a unit of measurement that considers each person's age at death. [5]
Includes suicides. State abbreviations on the map are explained in the table in the next section.
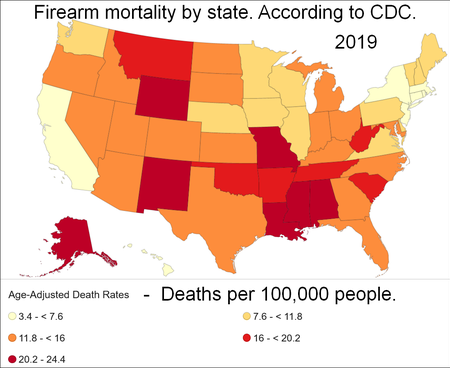
Includes suicides and non-homicides, too.
* below indicates "Crime in STATE" links.
| State | Abbreviation | Rate per 100,000 people | Gun Deaths | Murders | |
|---|---|---|---|---|---|
| AK | 24.4 | 179 | 69 | ||
| MS | 24.2 | 710 | 194 | ||
| NM | 22.3 | 471 | 198 | ||
| WY | 22.3 | 133 | 13 | ||
| AL | 22.2 | 1076 | 358 | ||
| LA | 22.1 | 1013 | 544 | ||
| MO | 20.6 | 1252 | 568 | ||
| SC | 19.9 | 1012 | 464 | ||
| AR | 19.3 | 580 | 568 | ||
| MT | 19 | 209 | 27 | ||
| OK | 18.6 | 737 | 266 | ||
| TN | 18.4 | 1270 | 498 | ||
| WV | 16.6 | 300 | 78 | ||
| GA | 15.8 | 1695 | 654 | ||
| NV | 15.3 | 490 | 143 | ||
| AZ | 15.1 | 1136 | 365 | ||
| KY | 14.9 | 682 | 221 | ||
| CO | 14.2 | 846 | 218 | ||
| ID | 14.2 | 255 | 35 | ||
| IN | 14.1 | 958 | 377 | ||
| KS | 13.7 | 403 | 105 | ||
| OH | 13.3 | 1578 | 538 | ||
| NC | 13.1 | 1397 | 632 | ||
| SD | 13.1 | 113 | 17 | ||
| UT | 12.8 | 394 | 72 | ||
| FL | 12.7 | 2872 | 1122 | ||
| TX | 12.7 | 3683 | 1409 | ||
| MD | 12.6 | 757 | 542 | ||
| OR | 12.6 | 566 | 116 | ||
| ND | 12.4 | 93 | 24 | ||
| MI | 12.1 | 1220 | 556 | ||
| PA | 11.7 | 1541 | 669 | ||
| VA | 11.7 | 1025 | 426 | ||
| ME | 11.5 | 163 | 20 | ||
| IL | 10.8 | 1367 | 832 | ||
| NH | 10.7 | 156 | 33 | ||
| WA | 10.7 | 842 | 198 | ||
| NE | 10.4 | 205 | 45 | ||
| WI | 10 | 604 | 175 | ||
| DE | 9.9 | 93 | 48 | ||
| VT | 9.3 | 67 | 11 | ||
| IA | 9.1 | 294 | 60 | ||
| MN | 8.1 | 465 | 117 | ||
| CA | 7.2 | 2945 | 1690 | ||
| CT | 5.3 | 190 | 104 | ||
| RI | 4.6 | 48 | 25 | ||
| HI | 4.4 | 62 | 48 | ||
| NJ | 4.1 | 368 | 262 | ||
| NY | 3.9 | 804 | 558 | ||
| MA | 3.4 | 247 | 152 |
This is a list of the U.S. states and the District of Columbia. The population data is the official data from the U.S. Census Bureau. [7] The murder rates and gun murder rates were calculated based on the FBI reports. [8] The official population of each state for 2010 and gun ownership rates were added for context. [9]
The gun murders in 2010 from FBI Uniform Crime Reporting (UCR) program was 8,775. [10] The total number of murders from all weapons was 12,996. [10] These figures includes murders and willful manslaughters, but excludes "deaths caused by negligence, suicide, or accident" and justifiable homicides. [11] The U.S. reports a 70% conviction rate for murder prosecutions. [12]
| State | Population (total inhabitants)(2010) | Population density (inhabitantsper square mile)(2010) | Murders (total deaths)(2010) | Gun murders (total deaths)(2010) | Estimated Gun ownership (%)(2013) | Murders (rate per 100,000inhabitants)(2010) | Gun murders (rate per 100,000inhabitants)(2010) |
|---|---|---|---|---|---|---|---|
| Alabama | 4,779,736 | 94.65 | 199 | 135 | 48.9% | 4.2 | 2.8 |
| Alaska | 710,231 | 1.264 | 31 | 19 | 61.7% | 4.4 | 2.7 |
| Arizona | 6,392,017 | 57.05 | 326 | 232 | 32.3% | 4.5 | 3.6 |
| Arkansas | 2,915,918 | 56.43 | 130 | 93 | 57.9% | 4.5 | 3.2 |
| California | 37,253,956 | 244.2 | 1,811 | 1,257 | 20.1% | 4.9 | 3.4 |
| Colorado | 5,029,196 | 49.33 | 117 | 65 | 34.3% | 2.3 | 1.3 |
| Connecticut | 3,574,097 | 741.4 | 131 | 97 | 16.6% | 3.7 | 2.7 |
| Delaware | 897,934 | 470.7 | 48 | 38 | 5.2% | 5.3 | 4.2 |
| District of Columbia | 601,723 | 10298 | 131 | 99 | 25.9% | 21.8 | 16.5 |
| Florida | 19,687,653 | 360.2 | 987 | 669 | 32.5% | 5.0 | 3.4 |
| Georgia | 9,920,000 | 165 | 527 | 376 | 31.6% | 5.3 | 3.8 |
| Hawaii | 1,360,301 | 216.8 | 24 | 7 | 45.1% | 1.8 | 0.5 |
| Idaho | 1,567,582 | 19.5 | 21 | 12 | 56.9% | 1.3 | 0.8 |
| Illinois | 12,830,632 | 231.9 | 706 | 364 | 26.2% | 5.5 | 2.8 |
| Indiana | 6,483,802 | 182.5 | 198 | 142 | 33.8% | 3.1 | 2.2 |
| Iowa | 3,046,355 | 54.81 | 38 | 21 | 33.8% | 1.2 | 0.7 |
| Kansas | 2,853,118 | 35.09 | 100 | 63 | 32.2% | 3.5 | 2.2 |
| Kentucky | 4,339,367 | 110.0 | 180 | 116 | 42.4% | 4.5 | 2.7 |
| Louisiana | 4,533,372 | 105.0 | 437 | 351 | 44.5% | 9.6 | 7.7 |
| Maine | 1,328,361 | 43.04 | 24 | 11 | 22.6% | 1.8 | 0.8 |
| Maryland | 5,773,552 | 606.2 | 424 | 293 | 20.7% | 7.3 | 5.1 |
| Massachusetts | 6,547,629 | 852.1 | 209 | 118 | 22.6% | 3.2 | 1.8 |
| Michigan | 9,883,640 | 174.8 | 558 | 413 | 28.8% | 5.6 | 4.2 |
| Minnesota | 5,303,925 | 67.14 | 91 | 53 | 36.7% | 1.7 | 1.0 |
| Mississippi | 2,967,297 | 63.50 | 165 | 120 | 42.8% | 5.6 | 4.0 |
| Missouri | 5,988,927 | 87.26 | 419 | 321 | 27.1% | 7.0 | 5.4 |
| Montana | 989,415 | 6.858 | 21 | 12 | 52.3% | 2.1 | 1.2 |
| Nebraska | 1,826,341 | 23.97 | 51 | 32 | 19.8% | 2.8 | 1.8 |
| Nevada | 2,700,551 | 24.80 | 158 | 84 | 37.5% | 5.9 | 3.1 |
| New Hampshire | 1,316,470 | 147.0 | 13 | 5 | 14.4% | 1.0 | 0.4 |
| New Jersey | 8,791,894 | 1189 | 363 | 246 | 11.3% | 4.1 | 2.8 |
| New Mexico | 2,059,179 | 17.16 | 118 | 67 | 49.9% | 5.7 | 3.3 |
| New York | 19,378,102 | 415.3 | 860 | 517 | 10.3% | 4.4 | 2.7 |
| North Carolina | 9,535,483 | 200.6 | 445 | 286 | 28.7% | 4.7 | 3.0 |
| North Dakota | 672,591 | 9.916 | 9 | 4 | 47.9% | 1.3 | 0.6 |
| Ohio | 11,536,504 | 282.5 | 460 | 310 | 19.6% | 4.0 | 2.7 |
| Oklahoma | 3,751,351 | 55.22 | 188 | 111 | 31.2% | 5.0 | 3.0 |
| Oregon | 3,831,074 | 40.33 | 78 | 36 | 26.6% | 2.0 | 0.9 |
| Pennsylvania | 12,702,379 | 285.3 | 646 | 457 | 27.1% | 5.1 | 3.6 |
| Rhode Island | 1,052,567 | 1006 | 29 | 16 | 5.8% | 2.8 | 1.5 |
| South Carolina | 4,625,364 | 157.1 | 280 | 207 | 44.4% | 6.1 | 4.5 |
| South Dakota | 814,180 | 10.86 | 14 | 8 | 35.0% | 1.7 | 1.0 |
| Tennessee | 6,346,105 | 156.6 | 356 | 219 | 39.4% | 5.6 | 3.5 |
| Texas | 25,145,561 | 98.07 | 1,246 | 805 | 35.7% | 5.0 | 3.2 |
| Utah | 2,763,885 | 34.30 | 52 | 22 | 31.9% | 1.9 | 0.8 |
| Vermont | 625,741 | 67.73 | 7 | 2 | 28.8% | 1.1 | 0.3 |
| Virginia | 8,001,024 | 207.3 | 369 | 250 | 29.3% | 4.6 | 3.1 |
| Washington | 6,724,540 | 102.6 | 151 | 93 | 27.7% | 2.2 | 1.4 |
| West Virginia | 1,852,994 | 77.06 | 55 | 27 | 54.2% | 3.0 | 1.5 |
| Wisconsin | 5,686,986 | 105.2 | 151 | 97 | 34.7% | 2.7 | 1.7 |
| Wyoming | 563,626 | 5.851 | 8 | 5 | 53.8% | 1.4 | 0.9 |

Gun control, or firearms regulation, is the set of laws or policies that regulate the manufacture, sale, transfer, possession, modification, or use of firearms by civilians.

Homicide is an act in which a person causes the death of another person. A homicide requires only a volitional act or an omission that causes the death of another, and thus a homicide may result from accidental, reckless, or negligent acts even if there is no intent to cause harm. Homicides can be divided into many overlapping legal categories, such as murder, manslaughter, justifiable homicide, assassination, killing in war, euthanasia, and capital punishment, depending on the circumstances of the death. These different types of homicides are often treated very differently in human societies; some are considered crimes, while others are permitted or even ordered by the legal system.
A violent crime, violent felony, crime of violence or crime of a violent nature is a crime in which an offender or perpetrator uses or threatens to use harmful force upon a victim. This entails both crimes in which the violent act is the objective, such as murder, assault, rape and assassination, as well as crimes in which violence is used as a method of coercion or show of force, such as robbery, extortion and terrorism. Violent crimes may, or may not, be committed with weapons. Depending on the jurisdiction, violent crimes may be regarded with varying severities from homicide to harassment. There have been many theories regarding heat being the cause of an increase in violent crime. Theorists claim that violent crime is persistent during the summer due to the heat, further causing people to become aggressive and commit more violent crime.

Crime in Canada is generally considered low overall. Under the Canadian constitution, the power to establish criminal law and rules of investigation is vested in the federal Parliament. The provinces share responsibility for law enforcement, and while the power to prosecute criminal offences is assigned to the federal government, responsibility for prosecutions is delegated to the provinces for most types of criminal offences. Laws and sentencing guidelines are uniform throughout the country, but provinces vary in their level of enforcement.
Crime has been recorded in the United States since its founding and has fluctuated significantly over time, with a sharp rise after 1900 and reaching a broad bulging peak between the 1970s and early 1990s. After 1992, crime rates have generally trended downwards each year, with the exceptions of a slight increase in property crimes in 2001 and increases in violent crimes in 2005-2006, 2014-2016 and 2020-2021. While official federal crime data beginning in 2021 has a wide margin of error due to the incomplete adoption of the National Incident-Based Reporting System by government agencies, federal data for 2020-2021 and limited data from select U.S. cities collected by the nonpartisan Council on Criminal Justice showed significantly elevated rates of homicide and motor vehicle theft in 2020-2022. Although overall crime rates have fallen far below the peak of crime seen in the United States during the late 1980s and early 1990s, the homicide rate in the U.S. has remained high, relative to other "high income"/developed nations, with eight major U.S. cities ranked among the 50 cities with the highest homicide rate in the world in 2022. The aggregate cost of crime in the United States is significant, with an estimated value of $4.9 trillion reported in 2021. Data from the first half of 2023, from government and private sector sources show that the murder rate has dropped, as much as 12% in as many as 90 cities across the United States. The drop in homicide rates is not uniform across the country however, with some cities such as Memphis, TN, showing an uptick in murder rates.

Gun violence is a term of political, economic and sociological interest referring to the tens of thousands of annual firearms-related deaths and injuries occurring in the United States. In 2022, up to 100 daily fatalities and hundreds of daily injuries were attributable to American gun violence. In 2018, the most recent year for which data are available, the Centers for Disease Control and Prevention's (CDC) National Center for Health Statistics reported 38,390 deaths by firearm, of which 24,432 were suicides. The national rate of firearm deaths rose from 10.3 people for every 100,000 in 1999 to 11.9 people per 100,000 in 2018, equating to over 109 daily deaths. In 2010, there were 19,392 firearm-related suicides, and 11,078 firearm-related homicides in the U.S. In 2010, 358 murders were reported involving a rifle while 6,009 were reported involving a handgun; another 1,939 were reported with an unspecified type of firearm. In 2011, a total of 478,400 fatal and nonfatal violent crimes were committed with a firearm.

Gun-related violence is violence committed with the use of a firearm. Gun-related violence may or may not be considered criminal. Criminal violence includes homicide, assault with a deadly weapon, and suicide, or attempted suicide, depending on jurisdiction. Non-criminal violence includes accidental or unintentional injury and death. Also generally included in gun violence statistics are military or para-military activities.
This list of U.S. states includes data for population, murders and non-negligent manslaughter, murders, gun murders, and gun ownership percentage, and calculates rates per 100,000. The population data is from the U.S. Census Bureau. Murder rates were calculated based on the FBI Uniform Crime Reports and the estimated census population of each state.
Crime in Chicago has been tracked by the Chicago Police Department's Bureau of Records since the beginning of the 20th century. The city's overall crime rate, especially the violent crime rate, is higher than the US average. Gangs in Chicago have a role in the city's crime rate. The number of homicides in Chicago hit a 25-year high in 2021.
In 2018, the Small Arms Survey reported that there are over one billion small arms distributed globally, of which 857 million are in civilian hands. The survey stated that American civilians account for an estimated 393 million of the worldwide total of civilian held firearms, or about 120.5 firearms for every 100 American residents.

A line of duty death is a death in the fire service or the police service while on duty.
According to the Louisiana Uniform Crime reporting program, there were 177,710 crimes reported in the U.S. state of Louisiana in 2018. 2018 had the least amount of non-violent criminal offenses since at least 2008. Violent crime decreased from 2017 to 2018, but 2012 still remains the lowest with its record of 22,868. Rape went up 12.7% from 2017 while murder/non-negligent manslaughter declined 7.8%. Additionally, robbery dropped 15% and aggravated assault dropped 1.5%. Handguns remain the leading murder weapon with a rate of 44.7% with firearm following close behind at 35.7%. Together, these two contribute for 80.4% of the murders. Similarly, robberies were committed mostly with firearms in 2018. Firearms were leading with 52% and strongarm listed with a percentage of 35%.
In 2019, 43,686 crimes were reported in the U.S. state of Michigan. Crime statistics vary widely by location. For example, Dearborn has a murder rate of only 2.1 per 100,000 while sharing borders with Detroit and Inkster, some of the highest rates in the state.

Proposals for universal background checks would require almost all firearms transactions in the United States to be recorded and go through the National Instant Criminal Background Check System (NICS), closing what is sometimes called the private sale exemption. Universal background checks are not required by U.S. federal law, but at least 21 states and the District of Columbia currently require background checks for at least some private sales of firearms.

Mass shootings are incidents involving multiple victims of firearm related violence. Definitions vary, with no single, broadly accepted definition. One definition is an act of public firearm violence—excluding gang killings, domestic violence, or terrorist acts sponsored by an organization—in which a shooter kills at least four victims. Using this definition, a 2016 study found that nearly one-third of the world's public mass shootings between 1966 and 2012 occurred in the United States, In 2017 The New York Times recorded the same total of mass shootings for that span of years. A 2023 report published in JAMA covering 2014 to 2022, found there had been 4011 mass shootings in the US, most frequent around the southeastern U.S. and Illinois. This was true for mass shootings that were crime-violence, social-violence, and domestic violence-related. The highest rate was found in the District of Columbia, followed by Louisiana and Illinois.

The Bipartisan Background Checks Act is a proposed United States law that would establish new background check requirements for firearm transfers between private parties. It would prohibit a firearm transfer between private parties until a licensed gun dealer, manufacturer, or importer conducts a successful background check.