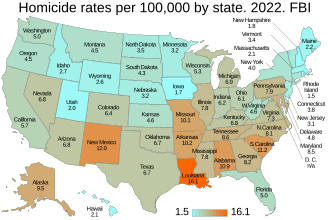
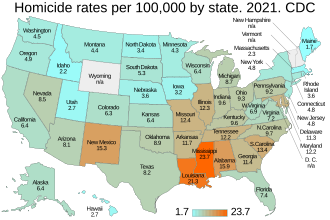
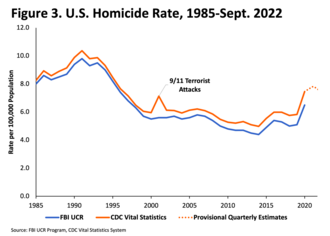
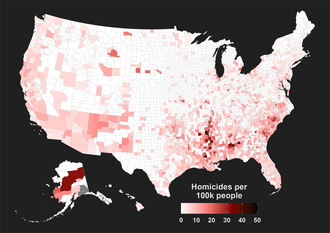
This is a list of U.S. states and territories by intentional homicide rate. It is typically expressed in units of deaths per 100,000 individuals per year; a homicide rate of 4 in a population of 100,000 would mean 4 murders a year, or 0.004% out of the total. The data is from the Centers for Disease Control (CDC), [5] and the Federal Bureau of Investigation (FBI). [1] The reasons for the different results can be confusing. From the Reason Foundation: "While the FBI data relies on reports by law enforcement agencies, the CDC data is derived from coroners’ reports, encompassing non-criminal homicides such as cases of self-defense. Consequently, the CDC mortality data shows a slightly higher number of homicides annually compared to the FBI data." [2] [3] The agency quotes below make more sense in light of this. The CDC reports all homicides, and does not indicate whether it was justified or self-defense. To a coroner a homicide is a homicide, regardless of the reason.
FBI: "The FBI’s Uniform Crime Reporting (UCR) Program defines murder and nonnegligent manslaughter as the willful (nonnegligent) killing of one human being by another. The classification of this offense is based solely on police investigation as opposed to the determination of a court, medical examiner, coroner, jury, or other judicial body. The UCR Program does not include the following situations in this offense classification: deaths caused by negligence, suicide, or accident; justifiable homicides; and attempts to murder or assaults to murder, which are classified as aggravated assaults." [6]
CDC: "Homicide – injuries inflicted by another person with intent to injure or kill, by any means. Excludes injuries due to legal intervention and operations of war. Justifiable homicide is not identified in WISQARS." [7] WISQARS is short for Web-based Injury Statistics Query and Reporting System. [8]
In the United States, the law for murder varies by jurisdiction. In many US jurisdictions there is a hierarchy of acts, known collectively as homicide, of which first-degree murder and felony murder [9] are the most serious, followed by second-degree murder and, in a few states, third-degree murder, which in other states is divided into voluntary manslaughter, and involuntary manslaughter such as reckless homicide and negligent homicide, which are the least serious, and ending finally in justifiable homicide, which is not a crime. However, because there are at least 52 relevant jurisdictions, each with its own criminal code, this is a considerable simplification. [10]
Sentencing also varies widely depending upon the specific murder charge. "Life imprisonment" is a common penalty for first-degree murder, but its meaning varies widely. [11]
Capital punishment is a legal sentence in 27 states, [12] [13] and in the federal civilian and military legal systems, though 8 of these states and the federal government have indefinitely suspended the practice. The United States is unusual in actually performing executions, [14] with 34 states having performed executions since capital punishment was reinstated in 1976. The methods of execution have varied, but the most common method since 1976 has been lethal injection. [15] In 2019 a total of 22 people were executed, [16] and 2,652 people were on death row. [17]
The federal Unborn Victims of Violence Act, enacted in 2004 and codified at 18 U.S. Code § 1841, [18] allows for a fetus to be treated as victims in crimes. Subsection (c) of that statute specifically prohibits prosecutions related to consented abortions and medical treatments. [18]Note: The location links in this table, as in all the tables below, are "Crime in LOCATION" links, except for Maine.
The following list shows homicide rates for the most recent five years. Data are from the FBI. [1]
Location | 2018 | 2019 | 2020 | 2021 | 2022 |
---|---|---|---|---|---|
United States | 5.0 | 5.1 | 6.5 | 6.8 | 6.3 |
District of Columbia | 22.8 | 23.4 | 28.2 | 41.0 | 29.3 |
Louisiana | 11.4 | 11.7 | 15.8 | 19.6 | 16.1 |
New Mexico | 7.3 | 8.8 | 7.8 | 12.9 | 12.0 |
South Carolina | 8.1 | 8.8 | 10.5 | 11.4 | 11.2 |
Alabama | 7.8 | 7.9 | 9.6 | 9.4 | 10.9 |
Arkansas | 7.4 | 7.8 | 10.6 | 11.0 | 10.2 |
Missouri | 9.8 | 9.4 | 11.8 | 10.2 | 10.1 |
Alaska | 6.4 | 9.4 | 6.7 | 6.1 | 9.5 |
Tennessee | 7.5 | 7.5 | 9.6 | 10.2 | 8.6 |
Maryland | 8.1 | 9.0 | 9.1 | 11.0 | 8.5 |
Georgia | 6.2 | 5.7 | 8.8 | 7.9 | 8.2 |
North Carolina | 5.5 | 6.2 | 8.0 | 9.4 | 8.1 |
Pennsylvania | 6.1 | 5.3 | 7.9 | 8.4 | 7.9 |
Illinois | 7.1 | 6.7 | 9.1 | 9.1 | 7.8 |
Mississippi | 7.2 | 10.0 | 10.6 | 9.3 | 7.8 |
Virginia | 4.9 | 5.2 | 6.1 | 6.6 | 7.3 |
Michigan | 5.6 | 5.8 | 7.6 | 7.6 | 6.9 |
Nevada | 6.7 | 4.7 | 5.7 | 7.6 | 6.8 |
Arizona | 5.4 | 5.4 | 6.9 | 6.7 | 6.8 |
Kentucky | 5.6 | 5.1 | 7.2 | 8.3 | 6.8 |
Texas | 4.6 | 4.9 | 6.6 | 7.1 | 6.7 |
Oklahoma | 5.5 | 6.9 | 7.4 | 7.6 | 6.7 |
Colorado | 3.8 | 4.0 | 5.1 | 6.2 | 6.4 |
Indiana | 6.2 | 5.5 | 7.5 | 7.2 | 6.2 |
Ohio | 5.1 | 5.0 | 7.0 | 7.5 | 6.1 |
California | 4.4 | 4.3 | 5.6 | 6.0 | 5.7 |
Wisconsin | 3.0 | 3.2 | 5.3 | 5.6 | 5.3 |
Florida | 5.2 | 5.2 | 5.9 | 4.3 | 5.0 |
Washington | 3.1 | 2.7 | 3.9 | 4.3 | 5.0 |
Delaware | 4.8 | 4.8 | 7.4 | 9.7 | 4.8 |
West Virginia | 4.2 | 5.6 | 6.6 | 6.0 | 4.6 |
Kansas | 4.2 | 3.3 | 3.4 | 4.8 | 4.6 |
Oregon | 2.1 | 2.8 | 2.9 | 4.8 | 4.5 |
Montana | 3.5 | 3.0 | 5.0 | 3.3 | 4.5 |
South Dakota | 1.4 | 1.8 | 4.5 | 3.0 | 4.3 |
New York | 2.9 | 2.9 | 4.2 | 4.4 | 4.0 |
Connecticut | 2.4 | 3.0 | 3.9 | 4.3 | 3.8 |
North Dakota | 2.4 | 3.3 | 4.2 | 1.8 | 3.5 |
Vermont | 1.8 | 1.8 | 2.2 | 1.4 | 3.4 |
Minnesota | 1.9 | 2.3 | 3.4 | 3.6 | 3.2 |
Nebraska | 2.3 | 2.3 | 3.6 | 2.9 | 3.2 |
New Jersey | 3.2 | 3.0 | 3.7 | 4.1 | 3.1 |
Idaho | 1.9 | 1.6 | 2.2 | 2.3 | 2.7 |
Wyoming | 2.4 | 2.2 | 3.1 | 3.1 | 2.6 |
Maine | 1.7 | 1.6 | 1.6 | 1.5 | 2.2 |
Massachusetts | 2.0 | 2.2 | 2.3 | 1.9 | 2.1 |
Hawaii | 2.8 | 2.6 | 2.9 | 1.6 | 2.1 |
Utah | 2.0 | 2.4 | 3.1 | 2.8 | 2.0 |
New Hampshire | 1.6 | 2.4 | 0.9 | 0.9 | 1.8 |
Iowa | 2.2 | 2.2 | 3.5 | 2.3 | 1.7 |
Rhode Island | 1.5 | 2.5 | 3.0 | 3.4 | 1.5 |
This article needs attention from an expert in United States. The specific problem is: See talk page (section: Contradiction between zero rates and counts).(October 2023) |
State | 2017 | 2018 | 2019 | 2020 | 2021 |
---|---|---|---|---|---|
Alabama | 12.9 | 12.2 | 12.8 | 14.2 | 15.9 |
Alaska | 10.6 | 7.5 | 10.8 | 7.3 | 6.4 |
Arizona | 6.6 | 6.1 | 5.9 | 7.5 | 8.1 |
Arkansas | 9.8 | 9.1 | 9.4 | 13 | 11.7 |
California | 5.1 | 4.8 | 4.5 | 6.1 | 6.4 |
Colorado | 4.6 | 4.7 | 4.3 | 5.8 | 6.3 |
Connecticut | 3.2 | 2.8 | 3.1 | 4.6 | 4.8 |
Delaware | 6.9 | 6.8 | 6.1 | 9.9 | 11.3 |
Florida | 6.4 | 6.6 | 6.7 | 7.8 | 7.4 |
Georgia | 7.9 | 7.7 | 8.1 | 10.5 | 11.4 |
Hawaii | 2.5 | 3.1 | 2.5 | 3.3 | 2.7 |
Idaho | 3 | 2.3 | 1.7 | 2.5 | 2.2 |
Illinois | 9 | 8 | 8.1 | 11.2 | 12.3 |
Indiana | 7.2 | 7.4 | 7.2 | 9.7 | 9.6 |
Iowa | 3.4 | 2.7 | 2.7 | 3.6 | 3.2 |
Kansas | 6.5 | 5.9 | 4.9 | 7 | 6.4 |
Kentucky | 7.3 | 6.1 | 5.9 | 9.5 | 9.6 |
Louisiana | 14.4 | 13.3 | 14.7 | 19.9 | 21.3 |
Maine | N/A | N/A | 1.8 | 1.6 | 1.7 |
Maryland | 10.2 | 9.3 | 10 | 11.4 | 12.2 |
Massachusetts | 2.6 | 2.3 | 2.3 | 2.7 | 2.3 |
Michigan | 6.3 | 6.5 | 6.5 | 8.7 | 8.7 |
Minnesota | 2.2 | 2.3 | 2.8 | 3.6 | 4.3 |
Mississippi | 12.7 | 13.4 | 15.4 | 20.5 | 23.7 |
Missouri | 11.3 | 11.4 | 10.8 | 14 | 12.4 |
Montana | 4.3 | 4.2 | 3.7 | 6.6 | 4.4 |
Nebraska | 2.7 | 1.9 | 3.1 | 4.1 | 3.6 |
Nevada | 7.6 | 7.7 | 5.5 | 7.3 | 8.5 |
New Hampshire | N/A | 1.8 | 2.8 | N/A | N/A [19] |
New Jersey | 4.1 | 3.7 | 3.4 | 4.3 | 4.8 |
New Mexico | 8.5 | 10.8 | 11.8 | 10.8 | 15.3 |
New York | 3 | 3.2 | 3.2 | 4.7 | 4.8 |
North Carolina | 6.9 | 6.4 | 7 | 8.6 | 9.7 |
North Dakota | N/A | 2.5 | 3.1 | 4.4 | 3.4 |
Ohio | 7.5 | 6.8 | 6.6 | 9.1 | 9.3 |
Oklahoma | 8.5 | 7 | 8.8 | 9 | 8.9 |
Oregon | 3.1 | 2.5 | 3 | 3.8 | 4.9 |
Pennsylvania | 6.6 | 6.4 | 6.1 | 8.5 | 9.2 |
Rhode Island | N/A | N/A | 2.5 | 3 | 3.6 |
South Carolina | 9.3 | 10.2 | 11 | 12.7 | 13.4 |
South Dakota | 4.2 | 3.9 | 3.6 | 6.5 | 5.3 |
Tennessee | 8.8 | 9.2 | 9.2 | 11.5 | 12.2 |
Texas | 5.8 | 5.4 | 5.9 | 7.6 | 8.2 |
Utah | 2.6 | 2.2 | 2.6 | 2.9 | 2.7 |
Vermont | N/A | N/A | N/A | N/A | N/A [20] |
Virginia | 5.4 | 5.1 | 5.3 | 6.4 | 7.2 |
Washington | 3.6 | 3.7 | 3.2 | 4.2 | 4.5 |
Washington, D.C. | 30.0 [22] | ||||
West Virginia | 6.5 | 5.8 | 5.7 | 7 | 6.9 |
Wisconsin | 3.7 | 3.9 | 4.2 | 6.1 | 6.4 |
Wyoming | N/A | 4.1 | 4.4 | 4.9 | N/A [21] |
The following list shows homicide rates by mechanism, for types where total deaths exceeded 100. Data are from the CDC and average the years 2018 to 2021. [23] Blank values indicate that the underlying homicide count was between 1 and 9, and was suppresed. [24] Excludes unspecified or unclassified data types, but the "Total" includes all deaths including suppressed, unspecified and/or unclassified data.
Location | Total | Gun | Stab | Choke | Struck | Poison | Fire |
---|---|---|---|---|---|---|---|
United States | 6.7 | 5.2 | 0.6 | 0.1 | 0.1 | 0.1 | 0.0 |
District of Columbia | 25.7 | 20.4 | 2.5 | 0.0 | |||
Mississippi | 17.2 | 14.9 | 1.0 | 0.2 | 0.1 | 0.1 | |
Louisiana | 16.5 | 13.9 | 0.9 | 0.2 | 0.2 | 0.1 | 0.1 |
Alabama | 12.9 | 11.0 | 0.7 | 0.2 | 0.1 | ||
New Mexico | 11.5 | 8.0 | 1.4 | 0.2 | |||
Missouri | 11.4 | 9.7 | 0.6 | 0.1 | 0.1 | 0.2 | |
South Carolina | 11.1 | 9.3 | 0.6 | 0.2 | 0.1 | 0.1 | |
Arkansas | 10.3 | 8.0 | 0.9 | 0.2 | 0.2 | ||
Maryland | 10.2 | 8.3 | 0.6 | 0.1 | 0.1 | ||
Tennessee | 10.1 | 8.5 | 0.6 | 0.2 | 0.0 | ||
Illinois | 9.5 | 8.0 | 0.5 | 0.2 | 0.0 | 0.1 | 0.0 |
Georgia | 9.2 | 7.6 | 0.5 | 0.2 | 0.1 | 0.0 | |
Alaska | 8.1 | 5.0 | 1.1 | 0.5 | 0.5 | 0.0 | |
Indiana | 8.1 | 6.4 | 0.6 | 0.2 | 0.1 | 0.0 | 0.1 |
Oklahoma | 8.1 | 6.0 | 0.7 | 0.2 | |||
North Carolina | 7.7 | 6.2 | 0.5 | 0.1 | 0.1 | ||
Delaware | 7.6 | 6.3 | 0.5 | ||||
Ohio | 7.5 | 6.0 | 0.5 | 0.1 | 0.1 | 0.1 | 0.0 |
Kentucky | 7.4 | 6.2 | 0.5 | 0.2 | 0.1 | 0.1 | |
Michigan | 7.1 | 5.8 | 0.5 | 0.1 | 0.0 | 0.1 | |
Nevada | 7.0 | 5.0 | 0.6 | 0.2 | 0.1 | ||
Pennsylvania | 7.0 | 5.4 | 0.5 | 0.1 | 0.1 | 0.4 | 0.0 |
Texas | 6.7 | 5.2 | 0.5 | 0.1 | 0.1 | 0.0 | 0.0 |
Arizona | 6.6 | 4.8 | 0.7 | 0.2 | 0.1 | ||
Florida | 6.5 | 5.1 | 0.5 | 0.2 | 0.1 | 0.0 | 0.0 |
Virginia | 5.8 | 4.7 | 0.5 | 0.1 | 0.1 | 0.0 | |
West Virginia | 5.8 | 4.4 | 0.4 | ||||
Kansas | 5.8 | 4.5 | 0.4 | 0.0 | |||
California | 5.4 | 3.9 | 0.7 | 0.1 | 0.1 | 0.0 | 0.0 |
Colorado | 5.3 | 3.7 | 0.6 | 0.2 | 0.1 | 0.0 | |
Wisconsin | 4.8 | 3.6 | 0.4 | 0.1 | 0.1 | 0.0 | |
Montana | 4.4 | 2.5 | 0.5 | 0.3 | |||
South Dakota | 4.4 | 2.2 | 0.9 | 0.3 | |||
Washington | 3.9 | 2.6 | 0.5 | 0.1 | 0.1 | ||
New York | 3.8 | 2.4 | 0.7 | 0.1 | 0.1 | 0.0 | 0.0 |
New Jersey | 3.8 | 2.6 | 0.5 | 0.1 | 0.0 | 0.0 | 0.1 |
Wyoming | 3.8 | 2.5 | 0.0 | 0.0 | |||
Connecticut | 3.6 | 2.3 | 0.5 | 0.1 | 0.1 | ||
Oregon | 3.5 | 2.4 | 0.4 | 0.1 | 0.1 | 0.0 | |
Minnesota | 3.1 | 2.1 | 0.3 | 0.1 | 0.0 | ||
North Dakota | 3.1 | 2.0 | 0.4 | 0.0 | |||
Nebraska | 3.1 | 2.1 | 0.3 | 0.1 | 0.0 | ||
Iowa | 2.8 | 1.8 | 0.2 | 0.1 | |||
Hawaii | 2.8 | 1.3 | 0.5 | ||||
Utah | 2.6 | 1.8 | 0.2 | 0.1 | |||
Rhode Island | 2.5 | 1.7 | 0.4 | 0.0 | |||
Massachusetts | 2.4 | 1.5 | 0.4 | 0.1 | |||
Idaho | 2.1 | 1.4 | 0.2 | 0.1 | |||
Vermont | 1.9 | 1.2 | 0.0 | ||||
New Hampshire | 1.6 | 0.9 | 0.0 | ||||
Maine | 1.5 | 0.9 |
The following list shows homicide rates by decade, averaging the rates for each year. Data are from the FBI. [1] Data for the 2020s are for 2020 to 2022.
Location | 1980s | 1990s | 2000s | 2010s | 2020s |
---|---|---|---|---|---|
United States | 8.7 | 8.1 | 5.6 | 4.9 | 6.6 |
District of Columbia | 37.7 | 67.3 | 35.8 | 19.2 | 32.8 |
Louisiana | 13.6 | 16.5 | 12.4 | 11.1 | 17.2 |
South Carolina | 9.7 | 9.3 | 7.4 | 7.3 | 11.0 |
New Mexico | 10.7 | 9.6 | 7.8 | 6.6 | 10.9 |
Missouri | 8.8 | 9.0 | 6.4 | 7.8 | 10.7 |
Arkansas | 8.2 | 9.7 | 6.3 | 6.4 | 10.6 |
Alabama | 10.4 | 10.5 | 7.5 | 7.2 | 10.0 |
Maryland | 9.4 | 11.2 | 9.1 | 7.7 | 9.6 |
Tennessee | 9.4 | 9.7 | 6.9 | 6.5 | 9.5 |
Mississippi | 11.2 | 12.2 | 8.2 | 7.8 | 9.2 |
Illinois | 9.1 | 10.2 | 6.6 | 6.4 | 8.7 |
North Carolina | 8.7 | 9.6 | 6.3 | 5.4 | 8.5 |
Georgia | 11.9 | 9.8 | 6.9 | 6.0 | 8.3 |
Pennsylvania | 5.5 | 6.0 | 5.5 | 5.3 | 8.0 |
Alaska | 10.9 | 7.8 | 5.1 | 6.2 | 7.5 |
Kentucky | 7.8 | 6.3 | 4.6 | 4.8 | 7.4 |
Michigan | 10.5 | 8.9 | 6.4 | 6.0 | 7.4 |
Delaware | 5.2 | 4.1 | 4.0 | 5.4 | 7.3 |
Oklahoma | 8.2 | 7.6 | 5.6 | 5.7 | 7.3 |
Indiana | 6.3 | 7.4 | 5.6 | 5.4 | 7.0 |
Ohio | 6.0 | 5.4 | 4.5 | 4.8 | 6.9 |
Texas | 13.9 | 10.1 | 6.0 | 4.7 | 6.8 |
Arizona | 8.1 | 8.6 | 7.4 | 5.5 | 6.8 |
Nevada | 12.5 | 10.9 | 7.7 | 6.1 | 6.7 |
Virginia | 7.7 | 7.8 | 5.3 | 4.7 | 6.7 |
Colorado | 6.2 | 5.1 | 3.6 | 3.3 | 5.9 |
California | 11.3 | 10.3 | 6.4 | 4.7 | 5.8 |
West Virginia | 5.4 | 5.2 | 3.7 | 4.4 | 5.7 |
Wisconsin | 3.1 | 4.2 | 3.1 | 3.1 | 5.4 |
Florida | 12.3 | 8.0 | 5.7 | 5.2 | 5.1 |
Washington | 5.0 | 4.6 | 3.0 | 2.7 | 4.4 |
Kansas | 5.1 | 6.0 | 4.2 | 3.8 | 4.3 |
Montana | 3.8 | 3.4 | 3.0 | 3.2 | 4.2 |
New York | 11.4 | 9.8 | 4.6 | 3.3 | 4.2 |
Oregon | 5.0 | 4.0 | 2.2 | 2.4 | 4.1 |
Connecticut | 4.8 | 4.9 | 3.1 | 2.9 | 4.0 |
South Dakota | 2.1 | 1.7 | 2.5 | 2.6 | 3.9 |
New Jersey | 5.7 | 4.7 | 4.3 | 3.9 | 3.6 |
Minnesota | 2.3 | 3.1 | 2.3 | 1.9 | 3.4 |
Nebraska | 3.1 | 3.3 | 3.0 | 2.8 | 3.2 |
North Dakota | 1.3 | 1.2 | 1.6 | 2.6 | 3.1 |
Wyoming | 4.9 | 3.5 | 2.6 | 2.6 | 2.9 |
Utah | 3.2 | 3.0 | 2.1 | 2.1 | 2.6 |
Rhode Island | 3.8 | 3.5 | 3.0 | 2.4 | 2.6 |
Iowa | 2.1 | 1.8 | 1.6 | 2.0 | 2.5 |
Idaho | 3.2 | 3.0 | 2.1 | 2.0 | 2.4 |
Vermont | 2.7 | 2.2 | 1.9 | 1.7 | 2.3 |
Hawaii | 4.8 | 3.7 | 2.1 | 2.0 | 2.2 |
Massachusetts | 3.6 | 3.1 | 2.6 | 2.3 | 2.1 |
Maine | 2.5 | 1.9 | 1.5 | 1.7 | 1.7 |
New Hampshire | 2.4 | 1.9 | 1.2 | 1.4 | 1.2 |
The following list shows homicide totals for the most recent five years. Data are from the FBI. [1]
Location | 2018 | 2019 | 2020 | 2021 | 2022 |
---|---|---|---|---|---|
United States | 16,374 | 16,669 | 21,570 | 22,536 | 21,156 |
California | 1,739 | 1,690 | 2,203 | 2,346 | 2,231 |
Texas | 1,327 | 1,432 | 1,931 | 2,087 | 2,026 |
Florida | 1,107 | 1,122 | 1,290 | 937 | 1,113 |
Pennsylvania | 784 | 676 | 1,009 | 1,087 | 1,020 |
Illinois | 902 | 851 | 1,151 | 1,150 | 982 |
Georgia | 647 | 605 | 943 | 851 | 893 |
North Carolina | 574 | 653 | 852 | 995 | 862 |
New York | 562 | 565 | 808 | 871 | 783 |
Louisiana | 533 | 547 | 734 | 907 | 740 |
Ohio | 596 | 584 | 820 | 883 | 718 |
Michigan | 555 | 576 | 754 | 761 | 695 |
Virginia | 417 | 447 | 524 | 573 | 638 |
Missouri | 599 | 576 | 723 | 630 | 624 |
Tennessee | 508 | 515 | 663 | 709 | 609 |
South Carolina | 411 | 455 | 549 | 590 | 592 |
Alabama | 383 | 390 | 471 | 476 | 552 |
Maryland | 491 | 545 | 553 | 680 | 526 |
Arizona | 383 | 397 | 513 | 485 | 500 |
Indiana | 418 | 373 | 505 | 490 | 427 |
Washington | 236 | 205 | 301 | 331 | 387 |
Colorado | 215 | 229 | 294 | 360 | 375 |
Wisconsin | 175 | 189 | 308 | 332 | 314 |
Arkansas | 222 | 237 | 321 | 334 | 312 |
Kentucky | 250 | 229 | 323 | 374 | 306 |
New Jersey | 285 | 263 | 329 | 381 | 286 |
Oklahoma | 215 | 275 | 296 | 304 | 270 |
New Mexico | 153 | 185 | 164 | 273 | 253 |
Mississippi | 214 | 298 | 315 | 274 | 228 |
Nevada | 202 | 144 | 180 | 239 | 216 |
District of Columbia | 160 | 166 | 201 | 274 | 197 |
Oregon | 86 | 117 | 125 | 204 | 192 |
Minnesota | 107 | 127 | 190 | 203 | 182 |
Massachusetts | 138 | 153 | 160 | 134 | 148 |
Connecticut | 86 | 107 | 140 | 155 | 136 |
Kansas | 122 | 95 | 100 | 142 | 134 |
West Virginia | 76 | 100 | 117 | 108 | 81 |
Alaska | 47 | 69 | 49 | 45 | 70 |
Utah | 63 | 77 | 102 | 94 | 67 |
Nebraska | 44 | 45 | 69 | 57 | 62 |
Iowa | 70 | 70 | 111 | 73 | 53 |
Idaho | 34 | 28 | 41 | 43 | 53 |
Montana | 37 | 32 | 54 | 36 | 50 |
Delaware | 46 | 47 | 73 | 97 | 49 |
South Dakota | 12 | 16 | 40 | 27 | 39 |
Hawaii | 40 | 37 | 41 | 23 | 30 |
Maine | 23 | 22 | 22 | 20 | 30 |
North Dakota | 18 | 25 | 32 | 14 | 27 |
New Hampshire | 21 | 33 | 12 | 13 | 25 |
Vermont | 11 | 11 | 14 | 9 | 22 |
Rhode Island | 16 | 26 | 32 | 37 | 16 |
Wyoming | 14 | 13 | 18 | 18 | 15 |
Homicide is an act in which a person causes the death of another person. A homicide requires only a volitional act, or an omission, that causes the death of another, and thus a homicide may result from accidental, reckless, or negligent acts even if there is no intent to cause harm. It is separate from suicide.
The Uniform Crime Reporting (UCR) program compiles official data on crime in the United States, published by the Federal Bureau of Investigation (FBI). UCR is "a nationwide, cooperative statistical effort of nearly 18,000 city, university and college, county, state, tribal, and federal law enforcement agencies voluntarily reporting data on crimes brought to their attention".
A violent crime, violent felony, crime of violence or crime of a violent nature is a crime in which an offender or perpetrator uses or threatens to use harmful force upon a victim. This entails both crimes in which the violent act is the objective, such as murder, assault, rape and assassination, as well as crimes in which violence is used as a method of coercion or show of force, such as robbery, extortion and terrorism. Violent crimes may, or may not, be committed with weapons. Depending on the jurisdiction, violent crimes may be regarded with varying severities from homicide to harassment.
Crime in St. Louis includes an overview of crime both in the city of St. Louis and in the Greater St. Louis metropolitan area. Crime in the city increased from the 1960s through the early 1990s as measured by the index crime rate. Despite decreasing crime, rates of violent crime and property crime in both the city and the metropolitan area remain higher than the national metropolitan area average. In addition, the city of St. Louis consistently has been ranked among the most dangerous cities in the United States. As of April 2017, St. Louis has the highest murder rate in America. At the end of 2017, St. Louis metropolitan had 205 murders, 159 of which were within the city limits. In 2018, the new Chief of Police, John Hayden said two-thirds (67%) of all the murders and one-half of all the assaults are concentrated in a triangular area in the north part of the city.
Crime has been recorded in the United States since its founding and has fluctuated significantly over time. Most available data underestimate crime before the 1930s, giving the false impression that crime was low in the early 1900s and had a sharp rise after. Instead, violent crime during the colonial period was likely three times higher than the highest modern rates in the data we have, and crime had been on the decline since colonial times. Within the better data for crime reporting and recording available starting in the 1930s, crime reached its broad, bulging modern peak between the 1970s and early 1990s. After 1992, crime rates have generally trended downwards each year, with the exceptions of a slight increase in property crimes in 2001 and increases in violent crimes in 2005–2006, 2014–2016 and 2020–2021. As of July 1, 2024 violent crime was down and homicides were on pace to drop to 2015 levels by the end of the year.
The following table is based on Federal Bureau of Investigation Uniform Crime Reports statistics.
Gun violence is a term of political, economic and sociological interest referring to the tens of thousands of annual firearms-related deaths and injuries occurring in the United States.
Gun-related violence is violence against a person committed with the use of a firearm to inflict a gunshot wound. Gun violence may or may not be considered criminal. Criminal violence includes homicide and assault with a deadly weapon. Depending on the jurisdiction, suicide or attempted suicide may also be considered a crime. Non-criminal violence includes accidental or unintentional injury and death. Also generally included in gun violence statistics are military or para-military activities.
This is a list of US states by gun deaths and rates of violence. In 2021, there were 26,000 gun suicides and 21,000 gun homicides, together making up a sixth of deaths from external causes. Gun deaths make up about half of all suicides, but over 80% of homicides.
In 2018, the Small Arms Survey reported that there are over one billion small arms distributed globally, of which 857 million are in civilian hands. The survey stated that American civilians account for an estimated 393 million of the worldwide total of civilian held firearms, or about 120.5 firearms for every 100 American residents.
An occupational fatality is a death that occurs while a person is at work or performing work related tasks. Occupational fatalities are also commonly called "occupational deaths" or "work-related deaths/fatalities" and can occur in any industry or occupation.
According to the Louisiana Uniform Crime reporting program, there were 177,710 crimes reported in the U.S. state of Louisiana in 2018. 2018 had the least amount of non-violent criminal offenses since at least 2008. Violent crime decreased from 2017 to 2018, but 2012 still remains the lowest with its record of 22,868. Rape went up 12.7% from 2017 while murder/non-negligent manslaughter declined 7.8%. Additionally, robbery dropped 15% and aggravated assault dropped 1.5%. Handguns remain the leading murder weapon with a rate of 44.7% with firearm following close behind at 35.7%. Together, these two contribute for 80.4% of the murders. Similarly, robberies were committed mostly with firearms in 2018. Firearms were leading with 52% and strongarm listed with a percentage of 35%.
In 2019, 43,686 crimes were reported in the U.S. state of Michigan. Crime statistics vary widely by location. For example, Dearborn has a murder rate of only 2.1 per 100,000 while sharing borders with Detroit and Inkster, some of the highest rates in the state.
In the United States, use of deadly force by police has been a high-profile and contentious issue. In 2022, 1,096 people were killed by police shootings according to The Washington Post, while according to the "Mapping Police Violence" (MPV) project, 1,176 people were killed by police in total. MPV documented 1,213 killings by police for 2023.
The United States Centers for Disease Control and Prevention (CDC) has data on drug overdose death rates and totals. Around 1,106,900 US residents died from drug overdoses from 1968 to 2020. Around 932,400 died from 1999 through 2020. Around 93,700 died in 2020. Opioids were involved in around 80,400 of the around 109,200 deaths in 2021. Synthetic opioids other than methadone were involved with 70,601 deaths in 2021. Around 111,000 people died in 2022. Around 108,300 in 2023.
Murder in Alabama law constitutes the intentional killing, under circumstances defined by law, of people within or under the jurisdiction of the U.S. state of Alabama.
The Bipartisan Background Checks Act is a proposed United States law that would establish new background check requirements for firearm transfers between private parties. It would prohibit a firearm transfer between private parties until a licensed gun dealer, manufacturer, or importer conducts a successful background check.