Homicide in world cities

Last updated

This article contains A-Z tables of the incidence of intentional homicide in multi-municipal metropolitan areas and standalone municipalities with a predominantly urbanized population. It does not take into consideration capricious political divisions widely used in the media to represent a city, such as city proper or suburban municipalities. The urban population for each entry is required to be at least 100,000.

Contents

Some cities are considered to be larger than the official metropolitan area or municipality determined by a country's respective government. Conversely, some cities are also considered to be significantly smaller than their official metro area(s) designations. Because of this and the continual growth of most cities that might not immediately be captured, the widest neutrally-sourced boundaries for each city are used. This includes the crossing of international borders.

1980s by count

No.CityFlag1980198119821983198419851986198719881989
Baltimore Flag of the United States.svg 898897294356
490 Belo Horizonte Flag of Brazil.svg 450335321297314267293318324411
Bogotá Flag of Colombia.svg 609
Brasília Flag of Brazil.svg 461
Cali Flag of Colombia.svg 225388381327459859
Chicago Flag of the United States.svg 877743
Curitiba Flag of Brazil.svg 12999158175175176151179234301
Fortaleza Flag of Brazil.svg 352364340417412400368302345463
Goiânia Flag of Brazil.svg 127138117104775677134267299
Houston Flag of the United States.svg 799879731638620546464566578
Los Angeles Flag of the United States.svg 1,7311,5001,4161,3481,3011,3261,4091,4121,3461,587
Maceió Flag of Brazil.svg 449
Manaus Flag of Brazil.svg 129123139118170153131167186283
Manila Flag of the Philippines.svg 4564944364925537487641,1231,1151,183
Medellín Flag of Colombia.svg 7159208518181,0621,609
Miami Flag of the United States.svg 748818732583629578585593615
Philadelphia Flag of the United States.svg 502
Porto Alegre Flag of Brazil.svg 161210236202151175229256433704
Recife Flag of Brazil.svg 6387457478891,0251,1661,1701,2341,1831,448
Rio de Janeiro Flag of Brazil.svg 2,6852,1721,8761,5162,0232,0771,9033,2392,3883,514
Salvador Flag of Brazil.svg 35391764513714276174296481
Santos Flag of Brazil.svg 130143172264264264302225256321
São Paulo Flag of Brazil.svg 2,4613,0262,9334,3515,3785,3625,5506,2045,8257,140
Vitória Flag of Brazil.svg 116162186173166222193255350521
25 Washington Flag of the United States.svg 326350334298285243298367547640

1980s by rate per 100,000

1-25MetropoleDivisionCountrySources1980198119821983198419851986198719881989
1 Belém Pará Brazil [1] 14151317151416151820
2 Brasília Brazil [2] 15151515152020202020
3 Cali Valle del Cauca Colombia [3] 273334333757
4 Curitiba Paraná Brazil [1] 96101110108101215
5 Dallas Texas United States [4] 17
6 Detroit Michigan United States [4] 18
7 Fortaleza Ceará Brazil [1] 21211923212018141620
8 Goiânia Goiás Brazil [1] 15161311867122426
9 Houston TexasUnited States [4] [5] 1817
10 Kingston Jamaica [6] 483736353736
11 Los Angeles California United States [4] 18
12 Maceió Alagoas Brazil [2] 28282828284040404040
13 Medellín Antioquia Colombia [7] 4357585946109
14 Miami Florida United States [4] [5] 2022
15 New Orleans Louisiana United States [4] 25
16 New York City New York United States [4] 23
17 Petrolina Brazil [2] 13131313132121212121
18 Porto Alegre Rio Grande do Sul Brazil [1] 789856891423
19 Recife Pernambuco Brazil [1] 27313035404444454351
20 Rio de Janeiro Rio de Janeiro Brazil [1] [8] 30242042505559596880
21 Salvador Bahia Brazil [1] 229267371220
22 Santos São Paulo Brazil [2] 18181818182222222222
23 São Paulo São PauloBrazil [1] 20242233393939434048
24 Vitória Espírito Santo Brazil [2] 18181818182626262626
25 Washington United States [4] [5] 1517

1990s by count

1-25MetropoleDivisionCountrySources1990199119921993199419951996199719981999
1 Belo Horizonte Minas Gerais Brazil [1] 396475441474424588624727870899
2 Bogotá Distrito Capital Colombia [9] 2,2582,6983,2314,3783,6643,3853,2962,8102,4832,409
3 Brasília Brazil [10] [11] 593680591717727802843827835844
4 Cali Valle del Cauca Colombia [12] 2,4982,2672,1871,7941,8712,181
5 Campinas São Paulo Brazil [10] [11] 26529835542345152913604826977
6 Cúcuta Norte de Santander Colombia [13] 747
7 Curitiba Paraná Brazil [1] 326284301364386434481611554658
8 Detroit Michigan United States [14] [15] [16] [17] [18] 564517556514501
9 East London Eastern Cape South Africa [19] 494613753663643675
10 East Rand Gauteng South Africa [20] 1,3469851,0881,0771,1161,130
11 Fortaleza Ceará Brazil [1] 374426376475438644589657493658
12 Los Angeles California United States [14] [15] [16] [17] [18] [21] 1,7681,8561,9191,9441,6691,6821,4011,175959891
13 Medellín Antioquia Colombia [12] 5,2845,2855,2574,4784,0834,288
14 Mexico City Mexico [22] 4,7244,5624,6084,5684,3654,1164,0613,6923,6123,196
15 New York City New York United States [14] [15] [16] [17] [18] 2,2451,2201,030803662693
16 Pereira Risaralda Colombia [13] 647
17 Porto Alegre Rio Grande do Sul Brazil [1] 807801761526686744810886812820
18 Pretoria GautengSouth Africa [23] 483502483527549542
19 Recife Pernambuco Brazil [1] 1,6021,5521,3921,4821,3901,4871,6432,2402,7882,568
20 Rio de Janeiro Rio de Janeiro Brazil [1] 6,0444,2543,6204,3195,2637,0476,8536,8756,4646,086
21 San Pedro Sula Cortés Honduras [24] 572741761896
22 Santos São PauloBrazil [10] [11] 3213463273283423939633705811
23 São Paulo São PauloBrazil [1] 7,4197,5206,9126,8877,5358,9039,2479,20210,12211,499
24 Vereeniging GautengSouth Africa [25] 579690741673721605
25 Vitória Espírito Santo Brazil [10] [26] 5355955137478398278551,1031,2731,171

1990s by rate per 100,000

1-25MetropoleDivisionCountrySources1990199119921993199419951996199719981999
1 Apartadó Antioquia Colombia [13] 218
2 Barrancabermeja Santander Colombia [27] 15133
3 Buenaventura Valle del Cauca Colombia [3] [28] 24242445454546119
4 Buga Valle del CaucaColombia [3] [28] 6767679494948285
5 Cali Valle del CaucaColombia [3] [28] 747474106106106818294
6 Cape Town Western Cape South Africa [29] 667573737970
7 Cartago Valle del CaucaColombia [28] 39393974747473160
8 Cúcuta Norte de Santander Colombia [13] 97
9 Durban KwaZulu-Natal South Africa [30] 82
10 Fusagasugá Cundinamarca Colombia [13] 97
11 Kingston Jamaica [6] 48465654684960888677
12 La Dorada Caldas Colombia [13] 65
13 Maicao La Guajira Colombia [13] 75
14 Medellín AntioquiaColombia [31] 264325284196192192188160141145
15 Ocaña Norte de SantanderColombia [32] 62485946864065616291
16 Palmira Valle del CaucaColombia [3] [28] 3131314747474268
17 Pereira Risaralda Colombia [13] 102
18 Popayán Cauca Colombia [13] 85
19 Recife Pernambuco Brazil [1] [33] 56534749464853728880
20 Riohacha La GuajiraColombia [13] 63
21 Santa Marta Magdalena Colombia [13] 63
22 São Paulo São Paulo Brazil [1] [33] 49494443475456555966
23 Tuluá Valle del CaucaColombia [3] [28] 4343435656565393
24 Villavicencio Meta Colombia [13] 60
25 Vitória Espírito Santo Brazil [33] 62696768859687

2000s by count

1-25MetropoleDivisionCountrySources2000200120022003200420052006200720082009
1 Belém Pará Brazil [11] [26] 3393984915585848378348031,1661,150
2 Belo Horizonte Minas Gerais Brazil [11] [26] 1,2541,4131,7882,3862,7532,4742,3062,2252,0181,822
3 Bogotá Distrito Capital Colombia [12] [34] [35] 2,2642,0521,8981,6051,5711,6691,3721,3511,3411,327
4 Brasília Brazil [11] 1,0421,0541,0451,1851,1781,1391,1551,1951,4031,501
5 Cali Valle del Cauca Colombia [3] [12] [36] 2,2492,2992,3152,3282,4021,7741,726
6 Cape Town Western Cape South Africa [37] [38] [39] 2,4202,4212,1661,8232,0462,222
7 Ciudad Juárez Chihuahua Mexico [40] 2472552832081972232281921,5802,386
8 Curitiba Paraná Brazil [11] [26] 6947678321,0371,1531,3131,3811,3291,6551,880
9 Durban KwaZulu-Natal South Africa [37] [39] [41] 2,1002,1752,0711,9051,8741,981
10 Fortaleza Ceará Brazil [11] [26] 7817598588498759921,0901,2671,2321,233
11 Johannesburg Gauteng South Africa [37] [39] [42] 2,2742,2852,0241,5471,4411,697
12 Karachi Sindh Pakistan [43] [44] 7348411,142
13 Kingston Jamaica [45] 1,014936
14 Maceió Alagoas Brazil [11] 3895355905956357031,0111,0621,1411,012
15 Manaus Amazonas Brazil [11] 490403421479436514583604704797
16 Medellín Antioquia Colombia [12] [36] 4,2964,6104,6972,6791,5171,161
17 Mexico City Mexico [22] 2,9542,9262,9042,9092,6832,8962,5662,0862,548
18 New York City United States [46] [47] [48] [49] [50] [51] [52] [53] [54] [55] 710672622967931929978840855778
19 Porto Alegre Rio Grande do Sul Brazil [11] [26] 1,0021,0061,0781,0951,1381,1511,1031,3641,4851,319
20 Recife Pernambuco Brazil [11] [26] [33] 2,5722,8682,5102,6662,5912,6322,6662,6802,4452,216
21 Rio de Janeiro Rio de Janeiro Brazil [11] [26] [33] 6,0746,0817,0126,6156,1815,6105,7734,8554,0403,703
22 Salvador Bahia Brazil [11] [26] 3585996899439701,3721,5761,7872,3852,481
23 San Pedro Sula Cortés Honduras [24] 969
24 São Paulo São Paulo Brazil [11] [26] [33] 11,32111,2149,8559,5177,3785,6135,0283,8123,6253,535
25 Vitória Espírito Santo Brazil [11] [26] 1,0591,0741,2161,2001,2411,1641,2911,3291,3341,324

2000s by rate per 100,000

1-25MetropoleDivisionCountrySources2000200120022003200420052006200720082009
1 Angra dos Reis Rio de Janeiro Brazil [56] 4858
2 Arapiraca Alagoas Brazil [56] [57] 1226793
3 Barrancabermeja Santander Colombia [58] [59] [60] [61] [62] [63] [64] 2431927056536440364961
4 Belo Horizonte Minas Gerais Brazil [26] [57] [65] 293239525951464440
5 Buenaventura Valle del Cauca Colombia [28] [64] 1651481159895105145916241
6 Buga Valle del CaucaColombia [28] [60] [64] 84137104801076575898863
7 Cabo Frio Rio de JaneiroBrazil [56] [57] 425471
8 Cali Valle del CaucaColombia [3] [36] 94949392916764
9 Cape Town Western Cape South Africa [37] [39] [66] [67] [68] 7978756655606264
10 Cartago Valle del CaucaColombia [28] [60] [64] 146143160112127113769710773
11 Caruaru Pernambuco Brazil [56] [57] 685370
12 Cúcuta Norte de Santander Colombia [69] 1016159657355
13 Durban KwaZulu-Natal South Africa [37] [39] [70] 636561555456
14 Garanhuns PernambucoBrazil [56] 7164
15 Governador Valadares Minas GeraisBrazil [56] 4356
16 Ilhéus Bahia Brazil [56] 4761
17 Itabuna BahiaBrazil [56] [57] 546698
18 Johannesburg Gauteng South Africa [37] 52
19 Kingston Jamaica [6] 7093
20 La Ceiba Atlántida Honduras [71] [72] 150122
21 Macaé Rio de JaneiroBrazil [56] [57] 867560
22 Marabá Pará Brazil [56] [57] 7891125
23 Teófilo Otoni Minas GeraisBrazil [56] 3452
24 Tuluá Valle del CaucaColombia [28] [64] 13111410479
25 Vitória Espírito Santo Brazil [26] [57] [65] 747381788072787880

2010s by rate

No.CityPop. 2010Pop. 2013Pop. 2014 (P)Mi²Mi² (land)Flag(s)2010201120122013201420152016201720182019
Acapulco 877,577906,096913,4061,4061,365 Flag of Mexico.svg 56.18133.48150.69107.49
Apartadó 153,319167,895173,008232 Flag of Colombia.svg 46.3157.5730.0821.4423.7
Atlanta 5,929,3456,162,19511,73211,499 Flag of the United States.svg 5.975.75.95.53
Belém 2,760,0612,872,2022,129,515 [73] 9,242 Flag of Brazil.svg 62.7543.2943.9746.3853.06 [73]
Belize City 66,700 Flag of Belize.svg 102.1105.1
Berlin 5,142,247 (2016)5,142,247 (2016) Flag of Germany.svg 1.0 (2012)1.0 [74]
Bloemfontein 747,431 (2011)2,426 Flag of South Africa.svg 42.4140.8144.02
Bogotá 8,663,9469,057,7309,188,1311,888 Flag of Colombia.svg 23.2722.117.6417.6918.16
Buenaventura 362,764384,5042,629 Flag of Colombia.svg 40.2636.539.7850.71
Buenos Aires 14,999,75910,156 Flag of Argentina.svg 7.03 (2012)7.03
Buga 116,101115,772322 Flag of Colombia.svg 71.4946.5788.183.9
Cabo Frio 186,227200,380204,486158 Flag of Brazil.svg 49.453.9963.0160.39
Cali 2,950,5083,051,4083,085,2921,348 Flag of Colombia.svg 81.4183.3880.0377.8362.72
Campos dos Goytacazes 463,731402,912 [73] 1,555 Flag of Brazil.svg 42.2740.1637.97 [73]
Cape Town 4,088,9434,263,1774,321,2541,859 Flag of South Africa.svg 42.4642.4448.9955.559.89
Caracas 3,273,863 (2014)3,273,863 [73] 1,381 Flag of Venezuela.svg 124 (2011)12488115.98 [73]
Caucasia 99,297106,887109,511545 Flag of Colombia.svg 186.31141.4719.1760.8157.53
Chicago 9,840,92913,06710,636 Flag of the United States.svg 6.27 (2011)6.276.98
Chigorodó 67,10372,45374,309264 Flag of Colombia.svg 7663.9167.9440.0326.91
Chihuahua 882,808868,145 [73] 7,0216,993 Flag of Mexico.svg 134.1299.971.3233.29 [73]
Choluteca 169,113183,563399 Flag of Honduras.svg 24.8443.6734.6834.87
Cleveland 3,515,6468,9435,880 Flag of the United States.svg 3.934.21
Colón 110,564117,546120,04832 Flag of El Salvador.svg 129.3488.6742.5752.7581.63
Comayagua 118,406126,969129,820321 Flag of Honduras.svg 103.88113.8197.49110.2682.42
Culiacán 819,332910,564 [73] 2,5652,435 Flag of Mexico.svg 105.7098.8359.7142.17 [73]
Detroit–Windsor 5,650,3446,925 Flag of the United States.svg Flag of Canada (Pantone).svg 8.148.759.80
Durban 4,009,3393,442,361 [73] 1,801 Flag of South Africa.svg 39.5138.8939.9534.48 [73]
Grahamstown 80,390 (2011)1,689 Flag of South Africa.svg 46.0338.5644.78
Guadalajara 4,546,7324,733,8321,215 Flag of Mexico.svg 14.4321.521.75
Houston 6,114,56214,20212,402 Flag of the United States.svg 7.285.535.63
Iguala 121,992220 Flag of Mexico.svg 98.37162.42154.95
João Pessoa 1,248,7191,318,665780,738 [73] 1,332 Flag of Brazil.svg 69.5177.6979.14 [73]
Johannesburg 7,722,8743,549 Flag of South Africa.svg 31.0526.6426.8530.31
Juárez–El Paso 2,391,4662,448,4066,2046,195 Flag of Mexico.svg Flag of the United States.svg 159.4897.8636.6225.81
Kansas City 2,343,00811,36711,199 Flag of the United States.svg 7.647.116.73
Karachi 14,910,352 (2017)1,362 Flag of Pakistan.svg 7.028.4610.11
Knysna 68,659 (2011)428 Flag of South Africa.svg 34.9637.8723.30
La Ceiba 185,831201,838207,161240 Flag of Honduras.svg 158.21181.52157.25140.7195.1
Laredo 637,5783,8423,826 Flag of Mexico.svg Flag of the United States.svg 2432.5583.85
London [75] 8,061,0008,417,000 Flag of the United Kingdom.svg 1.51.41.31.31.1
Los Angeles 17,877,00618,407,08335,31633,955 Flag of the United States.svg 54.694.664.6
Macaé 206,728470 Flag of Brazil.svg 52.7342.36
Madrid 6,633,278 (2016)6,633,278 (2016) Flag of Spain.svg 0.9 (2012)0.9 [74]
Maicao 141,917151,469154,343861 Flag of Colombia.svg 64.1273.6766.0348.8528.51
Marabá 233,6695,841 Flag of Brazil.svg 106.56107.24
Mazatlán 429,598988978 Flag of Mexico.svg 89.3974.926.48
Medellín 3,569,1613,711,0583,757,577532 Flag of Colombia.svg 7861.4347.7136.326.08
Mexico City 23,426,67624,317,5384,3784,357 Flag of Mexico.svg 14.0916.1117.1311.57
Miami 6,166,7666,482,3409,0877,464 Flag of the United States.svg 6.3665.96.2
Monterrey 4,192,6092,7492,747 Flag of Mexico.svg 20.8748.1040.17
Montreal 3,934,078 (2011)2,306 Flag of Canada (Pantone).svg 1.330.95 [76]
Moscow 13,500,00016,600,000 Flag of Russia.svg 8.877.116.655.72
Newcastle 63,236 (2011)716 Flag of South Africa.svg 22.321.223.4
New York City 23,076,66423,484,22515,33812,247 Flag of the United States.svg 4.484.33.783.43
Paris 12,006,868 (2016)12,006,868 (2016) Flag of France.svg 1.8 (2012)1.8 [74]
Philadelphia 7,067,8078,5047,336 Flag of the United States.svg 7.47.78.12
Pietermaritzburg 618,085619,439245 Flag of South Africa.svg 45.9533.9539.7433.9
Porto Seguro 126,929930 Flag of Brazil.svg 126.05105.93
Porto Velho 428,52713,165 Flag of Brazil.svg 49.9443.38
Pretoria 2,518,4042,432 Flag of South Africa.svg 24.3817.7617.18
Quibdó 114,524115,290115,5172,329 Flag of Colombia.svg 61.9861.85110.3893.6870.99
Rio de Janeiro 12,578,48512,823,08312,878,7003,960 Flag of Brazil.svg 37.2330.3133.335.38
Rionegro 110,329116,289118,26476 Flag of Colombia.svg 49.8560.5545.4931.8245.66
Sabanalarga 92,53995,96697,076153 Flag of Colombia.svg 18.3719.916.8720.8417.51
St. Louis 2,927,6759,8759,647 Flag of the United States.svg 7.4 (2011)7.4
Salvador 4,215,4324,572,9863,919,864 [73] 4,335 Flag of Brazil.svg 67.7361.9566.8954.31 [73]
San Diego–Tijuana 4,864,8585,090,4645,172,5056,2355,914 Flag of the United States.svg Flag of Mexico.svg 16.6111.499.7211.68
San Francisco 8,153,6968,469,85411,61710,132 Flag of the United States.svg 5.075.75.7
San Miguel 239,881247,119249,638 Flag of El Salvador.svg 89.2180.9240.0632.7836.05
San Pedro Sula 1,197,1831,292,5081,322,748711 Flag of Honduras.svg 122.62142.1146.37146.46114.46
San Salvador 1,810,8401,822,9211,826,509286 Flag of El Salvador.svg 75.3278.7834.2540.7663.84
Santa Ana 260,913264,091265,518 Flag of El Salvador.svg 85.47105.0442.2327.2639.92
Santa Marta 447,963469,066476,385919 Flag of Colombia.svg 41.7542.8751.9642.6422.04
São Paulo 21,468,53622,669,9634,222 Flag of Brazil.svg 16.9315.7118.3915.9
Siguatepeque 85,21392,81995,407234 Flag of Honduras.svg 70.4192107.4778.6581.76
Sonsonate 72,91472,15872,01590 Flag of El Salvador.svg 138.52177.6955.2823.5645.82
Tegucigalpa 1,134,1831,203,3701,225,613562 Flag of Honduras.svg 91.7899.4387.9185.4381.1
Tocoa 86,039 (2013)86,03987,626 Flag of Honduras.svg 125.55 (2012)125.55137.15102.71
Toronto 5,583,064 (2011)2,750 Flag of Canada (Pantone).svg 1.431.38 [76]
Torreón 1,259,007 Flag of Mexico.svg 58.6
Tuluá 199,264206,610209,086345 Flag of Colombia.svg 79.383.3107.2871.6365.05
Tumaco 179,005191,218195,419293 Flag of Colombia.svg 136.87136.06140.04112.9672.66
Usulután 76,92279,56880,46754 Flag of El Salvador.svg 70.274.5554.6543.9972.08
Vancouver 2,313,328 (2011)1,000 Flag of Canada (Pantone).svg 1.541.83 [76]
Vereeniging 769,000 (2020)1,701 Flag of South Africa.svg 33.530.5328.75
Washington–Baltimore 9,051,9619,443,18014,22012,209 Flag of the United States.svg 6.555.745.22
Welkom 406,104407,1761,991 Flag of South Africa.svg 48.2658.0662.9362.14
Worcester 166,825 (2007)1,480 Flag of South Africa.svg 43.1644.9640.76

2010s by count

No.CityFlag(s)2010201120122013201420152016 (P)
Acapulco Flag of Mexico.svg 1,055
1,186
1,278
1,353
989
974
638
635
986
1,110
1,001
1,101
Acapulco Flag of Mexico.svg 4931,186
1,055
1,353
1,278
974
989
635
638
1,110
986
1,101
1,001
Atlanta Flag of the United States.svg 354342359341
Belém Flag of Brazil.svg 1,732
1,904
1,208
1,585
1,240
1,651
1,332
Belém Flag of Brazil.svg 1,904
1,732
1,585
1,208
1,651
1,240
1,332
Belize City Flag of Belize.svg 7074
Bloemfontein Flag of South Africa.svg 317305329286304315
Bogotá Flag of Colombia.svg 2,0161,9441,5751,6021,669
Buenaventura Flag of Colombia.svg 133
146
129
135
132
150
182
195
147
161
77
84
59
Buenaventura Flag of Colombia.svg 146
137
135
142
150
142
195
178
161
144
84
86
65
Buenaventura Flag of Colombia.svg 137
133
142
129
142
132
178
182
144
147
86
77
Buenos Aires Flag of Argentina.svg 1,0541,4321,559
Buga Flag of Colombia.svg 74
83
43
54
100
102
94
97
80
80
87
87
66
Buga Flag of Colombia.svg 83
98
54
61
102
115
97
98
80
82
87
88
71
Buga Flag of Colombia.svg 98
74
61
43
115
100
98
94
82
80
88
87
Cabo Frio Flag of Brazil.svg 92103123121
Cali Flag of Colombia.svg 2,087
2,402
2,402
2,488
2,420
2,415
2,426
2,375
1,938
1,935
1,838
1,873
1,746
Cali Flag of Colombia.svg 2,402
2,578
2,488
2,642
2,415
2,542
2,375
2,483
1,935
2,032
1,873
1,971
1,767
Cali Flag of Colombia.svg 2,578
2,087
2,642
2,402
2,542
2,420
2,483
2,426
2,032
1,938
1,971
1,838
Campos dos Goytacazes Flag of Brazil.svg 196188222227226193
Cape Town Flag of South Africa.svg 1,7331,7572,0562,3742,6282,6082,693
Caracas Flag of Venezuela.svg 4,9993,804
Caucasia Flag of Colombia.svg 114
185
46
144
27
20
55
65
57
63
45
37
37
Caucasia Flag of Colombia.svg 185
138
144
82
20
31
65
66
63
48
37
41
24
Caucasia Flag of Colombia.svg 138
114
82
46
31
27
66
55
48
57
41
45
Chicago Flag of the United States.svg 618691
Chigorodó Flag of Colombia.svg 5144482920
Chihuahua Flag of Mexico.svg 289
1,438
Chihuahua Flag of Mexico.svg 1,1858986514573348871,438
289
Choluteca Flag of Honduras.svg 4276626437
Cleveland Flag of the United States.svg 138148158
Colón Flag of El Salvador.svg 143100496298
Comayagua Flag of Honduras.svg 123138121140107
Culiacán Flag of Mexico.svg 866813493462492523590
Detroit–Toledo–Windsor (was Detroit–Windsor before 2012) Flag of the United States.svg Flag of Canada (Pantone).svg 460493596518450479500
Durban Flag of South Africa.svg 1,5801,5341,5771,6671,7921,772
Grahamstown Flag of South Africa.svg 373136
Guadalajara Flag of Mexico.svg 723
991
719
1,016
687
1,029
591
712
664
1,128
747
Guadalajara Flag of Mexico.svg 656991
723
1,016
719
1,029
687
712
591
1,128
664
Houston Flag of the United States.svg 433330349373377458487
Iguala Flag of Mexico.svg 120195183
João Pessoa Flag of Brazil.svg 858967872844806792
Johannesburg (became Johannesburg–Pretoria–Vereeniging in 2015) Flag of South Africa.svg 2,3892,2592,2842,5822,8213,8694,124
Juárez–El Paso Flag of Mexico.svg Flag of the United States.svg 3,8142,348892632
Kansas City Flag of the United States.svg 179167160
Karachi Flag of Pakistan.svg 1,4851,7892,137
Knysna Flag of South Africa.svg 24261612
La Ceiba Flag of Honduras.svg 294347309284197
Los Angeles Flag of the United States.svg 893841850847810869938
Macaé Flag of Brazil.svg 10990
Maicao Flag of Colombia.svg 91107987444
Marabá Flag of Brazil.svg 249256
Mazatlán Flag of Mexico.svg 384325116109105162371
Medellín Flag of Colombia.svg 2,7842,2221,7481,347980
Mexico City Flag of Mexico.svg 2,346
3,822
2,474
3,447
2,626
3,369
2,746
Mexico City Flag of Mexico.svg 2,7923,3223,4493,822
2,346
3,447
2,474
3,369
2,626
Miami Flag of the United States.svg 370344364383419399355
Monterrey Flag of Mexico.svg 1,679
2,047
1,314
1,734
617
868
420
542
384
471
548
Monterrey Flag of Mexico.svg 8752,047
1,679
1,734
1,314
868
617
542
420
471
384
Moscow Flag of Russia.svg 1,1981,1381,071950
Newcastle Flag of South Africa.svg 817785
New York City Flag of the United States.svg 1,012958823740687744715
Nuevo Laredo Flag of Mexico.svg 1422015461726997107
Philadelphia Flag of the United States.svg 523545579
Pietermaritzburg Flag of South Africa.svg 284210246210228252
Port Elizabeth Flag of South Africa.svg 517562515547541674660
Porto Seguro Flag of Brazil.svg 108
137
133
152
129
139
140
154
98
134
95
Porto Seguro Flag of Brazil.svg 160137
108
152
133
139
129
154
140
134
98
Porto Velho Flag of Brazil.svg 214189
Pretoria (merged with Johannesburg–Pretoria–Vereeniging in 2015) Flag of South Africa.svg 613518500518574
Quibdó Flag of Colombia.svg 717112710882
Rio de Janeiro Flag of Brazil.svg 4,854
4,683
4,049
3,837
3,708
3,768
4,260
4,025
4,541
4,310
3,992
3,995
4,884
Rio de Janeiro Flag of Brazil.svg 4,683
4,854
3,837
4,049
3,768
3,708
4,025
4,260
4,310
4,541
3,995
3,992
Rionegro Flag of Colombia.svg 5568523754
Sabanalarga Flag of Colombia.svg 1717162017
St. Louis Flag of the United States.svg 217
Salvador Flag of Brazil.svg 2,8552,6352,870
San Diego–Tijuana Flag of the United States.svg Flag of Mexico.svg 808
1,393
569
679
488
475
647
650
604
San Diego–Tijuana Flag of the United States.svg Flag of Mexico.svg 1,393
808
679
569
475
488
650
647
604
San Francisco Flag of the United States.svg 413466477
San Miguel Flag of El Salvador.svg 214196988190
San Pedro Sula Flag of Honduras.svg 1,4681,7471,8461,8931,514
San Salvador Flag of El Salvador.svg 1,3641,4306237431,1662,0571,577
Santa Ana Flag of El Salvador.svg 22327511172106
Santa Marta Flag of Colombia.svg 187195240200105
São Paulo Flag of Brazil.svg 3,6343,3984,0053,604
Siguatepeque Flag of Honduras.svg 6081977378
Sonsonate Flag of El Salvador.svg 101129401733
Tegucigalpa Flag of Honduras.svg 1,0411,1511,0381,028994
Tijuana Flag of Mexico.svg 741
1,326
487
597
381
368
576
579
530
516
750
705
1,069
974
Tijuana Flag of Mexico.svg 1,326
741
597
487
368
381
579
576
516
530
705
750
974
1,069
Tocoa Flag of Honduras.svg 10611890
Torreón Flag of Mexico.svg 747
Tuluá Flag of Colombia.svg 158168219148136
Tumaco Flag of Colombia.svg 245249262216142
Usulután Flag of El Salvador.svg 5458433558
Vereeniging (merged with Johannesburg–Pretoria–Vereeniging in 2015) Flag of South Africa.svg 281255242254304
Washington–Baltimore Flag of the United States.svg 593522487
Welkom Flag of South Africa.svg 196236256253230240229
83 Worcester Flag of South Africa.svg 72756875

See also

Related Research Articles

<span class="mw-page-title-main">Murder</span> Unlawful killing of a human

Murder is the unlawful killing of another human without justification or valid excuse, especially the unlawful killing of another human with malice aforethought. This state of mind may, depending upon the jurisdiction, distinguish murder from other forms of unlawful homicide, such as manslaughter. Manslaughter is killing committed in the absence of malice, brought about by reasonable provocation, or diminished capacity. Involuntary manslaughter, where it is recognized, is a killing that lacks all but the most attenuated guilty intent, recklessness.

The Bojayá massacre was a massacre that occurred on May 2, 2002 in the town of Bellavista, Bojayá Municipality, Chocó Department, Colombia. Revolutionary Armed Forces of Colombia (FARC) guerrillas attacked the town in an attempt to take control of the Atrato River region from United Self-Defense Forces of Colombia (AUC) paramilitaries. During the fighting, a cylinder bomb launched by the FARC with a mortar at the AUC paramilitaries positioned by the walls of a church, went through the roof of the church instead, landing on the altar inside. Of the approximately 300 inhabitants of the town who had taken refuge in the church, 119 died in the explosion.

Academia Mexicana de Derechos Humanos MEXICANOS is a human rights group based in Mexico. According to its website, the Academia Mexicana de Derechos Humanos is a non governmental, independent and plural organization founded in 1984 that has contributed in an active manner to the creation of a vigorous pro-human rights movement in Mexico.

<span class="mw-page-title-main">José Zalaquett</span> Chilean lawyer (1942–2020)

José "Pepe" Zalaquett Daher was a Chilean lawyer, renowned for his work in the defence of human rights during the de facto regime that governed Chile under General Augusto Pinochet from 1973 to 1990.

The Raizal are an Afro-Caribbean ethnic group from the Archipelago of San Andrés, Providencia and Santa Catalina, off of Colombia's Caribbean coast. They are recognized by the Colombian authorities as one of the Afro-Colombian ethnic groups under the multicultural policy pursued since 1991. They are speakers of the San Andrés-Providencia Creole, one of many English Creoles used in the Caribbean.

<span class="mw-page-title-main">Colonia Doctores</span> Neighborhood of Mexico City in Cuauhtémoc

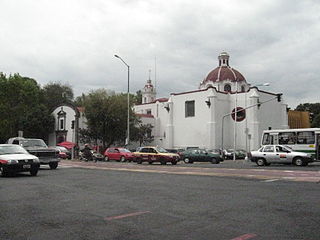
Colonia Doctores is an official neighborhood just southwest of the historic center of Mexico City. It is bordered by Avenida Cuauhtémoc to the west, across from Belen Street to the north, Eje Central to the east and Eje 3 Sur José Peón Contreras to the south.

The Colombian Red Cross is a Colombian-based nonprofit private entity member of the International Red Cross and Red Crescent Society. It has been a member since 1922. The Colombian Red Cross embraces the principles of the International Red Cross. It provides humanitarian aid to people in need of protection, protection of life and health during armed conflict and disaster relief during emergencies within the Colombian territory. The Colombian Red Cross has played a major humanitarian role within the Colombian Armed Conflict as a mediator in the area of human rights.

<span class="mw-page-title-main">Investigations Police of Chile</span> Civilian police of Chile

Investigations Police of Chile are the civilian police of Chile. Founded in 1933, it is one of two Chilean police bodies, along with the law enforcement police: Carabineros de Chile. The PDI is the principal law enforcement arm of the Public Ministry of Chile in criminal investigation.

In March 2006, six plainclothes agents of Mexico's Federal Investigations Agency (AFI) raided a market in Santiago Mexquititlán, Querétaro, in search of unauthorized copies of copyrighted works. The agents later alleged that they were held hostage by vendors during the raid. Three women were convicted of the alleged kidnapping. In September 2009, Jacinta Francisco Marcial and in April 2010 Alberta Alcántara and Teresa González, were released from prison after the charges against them were dropped.

The Facultad de Derecho Eugenio Maria de Hostos was a law school located in Mayagüez, Puerto Rico. The School was founded by Fernando Bayrón, Juan Mari Brás and Carlos Rivera Lugo in 1995. The institution lost its ABA accreditation, and then the Puerto Rico Supreme Court also withdrew the accreditation due to school's economical difficulties. After having granted degrees to 900 alumni, Hostos closed in 2013, when the last commencement ceremony had only eight graduates, out of ten students in their final semester. The Eugenio Maria de Hostos Law School aspired to achieve the development of a legal professional who was also responsive to the needs of their communities and who would embrace the Hostos educational philosophy.

<span class="mw-page-title-main">Ministry of Defense (Argentina)</span>

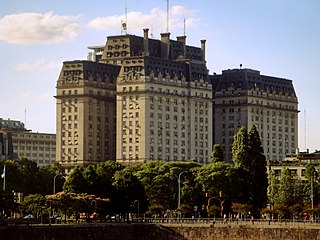
The Ministry of Defense of Argentina is a ministry of the national executive power that oversees and advises on matters of national defense, including overseeing the Argentine Armed Forces.

Colombia has a very high crime rate due to being a center for the cultivation and trafficking of cocaine. The Colombian conflict began in the mid-1960s and is a low-intensity asymmetric war between Colombian governments, paramilitary groups, crime syndicates, and left-wing guerrillas such as the Revolutionary Armed Forces of Colombia (FARC), and the National Liberation Army (ELN), fighting each other to increase their influence in Colombian territory. Two of the most important international actors that have contributed to the Colombian conflict are multinational companies and the United States.

<span class="mw-page-title-main">Mike O'Connor (journalist)</span>

Mike O'Connor was a German-born American journalist, war correspondent, and Mexico's representative for Committee to Protect Journalists (CPJ), a New York-based nonprofit organization dedicated to promote press freedom around the world. Born in Germany following World War II to Americans stationed in a refugee camp, O'Connor began his career as a journalist in the 1980s. As a foreign journalist, he covered civil wars and conflicts for NPR, The New York Times, CBS News, among others.

<span class="mw-page-title-main">Germán Garavano</span> Argentinian lawyer (born 1969)

Germán Carlos Garavano is an Argentine lawyer and expert on judicial reform, and the former minister of Justice and Human Rights of Argentina between 2015 and 2019. He was Attorney General of the city of Buenos Aires between 2007 and 2014 and substitute Councillor of the Council of Magistracy of Argentina.

<span class="mw-page-title-main">María Eugenia Rodríguez Palop</span>

María Eugenia Rodríguez Palop is a Spanish jurist, professor of Philosophy of Law at the Charles III University of Madrid (UC3M), specializing in human rights.

The 2019 Sacaba massacre occurred when Bolivian soldiers and police attacked and broke up a protest led by Bolivian coca growers at Huayllani in Sacaba municipality, Cochabamba on 15 November 2019. It came in the first week of the interim presidency of Jeanine Áñez. Marchers intended to enter the town of Sacaba and proceed to the departmental capital of Cochabamba to protest the ousting of Bolivian president Evo Morales, but were stopped by the police and military. During the afternoon, police and soldiers clashed with protesters, and eventually soldiers opened fire on the crowd. Ten demonstrators were killed; an estimated ninety-eight people were wounded, including four journalists and eight members of the security forces. Two hundred twenty-three protesters were arrested, many of whom suffered mistreatment and at least nine of whom were tortured.

Iduvina Hernández is a Guatemalan journalist and internationally-known human rights activist. Her work has involved analyzing democracy and state security. Specifically, her research has focused on the violence which occurred during the Guatemalan Civil War and rebuilding the structures to support the country's democracy. In her childhood, her father was threatened by the National Civil Police and her husband was killed in 1984. She interrupted her education after his murder and moved to Mexico, living in exile there and working as a journalist until 1989. After her return to Guatemala, Hernández wrote articles focused on the war and counterinsurgency for Crónica magazine.

References

  1. 1 2 3 4 5 6 7 8 9 10 11 12 13 14 15 16 17 18 "Ipeadata". Ipeadata. Retrieved 2008-01-08.
  2. 1 2 3 4 5 "Texto para Discussão N° 1144" (PDF) (in Portuguese). Instituto de Pesquisa Econômica Aplicada. p. 13. Archived from the original (PDF) on 2011-04-28. Retrieved 2009-05-17.
  3. 1 2 3 4 5 6 7 8 "Violencia, Criminalidad y Exclusion en el Valle del Cauca" (PDF) (in Spanish). Informe Regional de Desarrollo Humano 2008. pp. 48–49, 52, 55. Archived from the original (PDF) on 2011-07-26. Retrieved 2008-12-20.
  4. 1 2 3 4 5 6 7 8 "Questions and Answers in Lethal and Non-Lethal Violence" (PDF). Homicide Research Working Group. p. 23. Archived from the original (PDF) on 2012-04-26. Retrieved 2011-11-22.
  5. 1 2 3 Falk, Gerhard; Falk, Clifford (1990). Murder, an analysis of its forms, conditions, and causes . McFarland. p.  166. ISBN   9780899504780 . Retrieved 2010-03-06. Murder, an analysis of its forms, conditions, and causes.
  6. 1 2 3 "Annexes" (PDF). World Bank Group. p. 209. Archived from the original (PDF) on 2006-05-13. Retrieved 2007-09-15.
  7. "Registro Mensual de Homicidios 1987-2005" (PDF) (in Spanish). Metroseguridad. p. 3. Archived from the original (PDF) on 2011-07-07. Retrieved 2008-04-15.
  8. "Violent Crime in Latin America Cities: Rio de Janeiro & São Paulo" (PDF). Universidade de São Paulo. p. 25. Retrieved 2010-08-19.[ permanent dead link ]
  9. "Seguridad más cerca de los ciudadanos" (PDF) (in Spanish). Convivencia y Seguridad Ciudadana. p. 6. Retrieved 2009-07-04.[ dead link ]
  10. 1 2 3 4 "Óbitos por Causas Externas 1979 a 1995" (in Portuguese). DATASUS. Retrieved 2011-11-18.
  11. 1 2 3 4 5 6 7 8 9 10 11 12 13 14 15 16 "Óbitos por Causas Externas 1996 a 2009" (in Portuguese). DATASUS. Retrieved 2009-02-20.
  12. 1 2 3 4 5 "Los homicidios: Entre su descenso y las nuevas opciones de seguridad" (in Spanish). Área de Desarrollo Humano. Retrieved 2007-06-12.[ permanent dead link ]
  13. 1 2 3 4 5 6 7 8 9 10 11 12 "Homicidio 1999" (PDF) (in Spanish). Instituto Nacional de Medicina Legal. pp. 39–40, 42, 44. Retrieved 2008-11-29.[ permanent dead link ]
  14. 1 2 3 "CIUS 95 Section II" (PDF). Federal Bureau of Investigation. pp. 79–105. Archived from the original (PDF) on 2007-07-10. Retrieved 2007-09-19.
  15. 1 2 3 "CIUS 96 Section II" (PDF). Federal Bureau of Investigation. pp. 84–110. Archived from the original (PDF) on 2008-06-25. Retrieved 2008-11-20.
  16. 1 2 3 "CIUS 97 Section II" (PDF). Federal Bureau of Investigation. pp. 88–115. Archived from the original (PDF) on December 5, 2008. Retrieved 2008-11-20.
  17. 1 2 3 "CIUS 98 Section II" (PDF). Federal Bureau of Investigation. pp. 83–108. Archived from the original (PDF) on October 26, 2003. Retrieved 2008-11-20.
  18. 1 2 3 "CIUS 99 Section II" (PDF). Federal Bureau of Investigation. pp. 83–109. Archived from the original (PDF) on April 4, 2007. Retrieved 2007-11-18.
  19. "Crime in the RSA for the period January to December 1994-2002, East London". Institute for Security Studies. Archived from the original on 2003-12-04. Retrieved 2007-06-15.
  20. "Crime in the RSA for the period January to December 1994-2002, East Rand". Institute for Security Studies. Archived from the original on 2003-12-09. Retrieved 2010-07-01.
  21. "Gang-Related Crime in Los Angeles County". Los Angeles Almanac. Retrieved 2010-09-20.
  22. 1 2 "Homicidios y violencia organizada en México" (PDF) (in Spanish). Facultad Latinoamericana de Ciencias Sociales. p. 10. Archived from the original (PDF) on 2011-07-07. Retrieved 2010-07-08.
  23. "Crime in the RSA for the period January to December 1994-2002, Pretoria". Institute for Security Studies. Archived from the original on 2003-12-09. Retrieved 2007-06-15.
  24. 1 2 "Delincuencia y criminalidad en las estadísticas de Honduras, 1996-2000" (PDF) (in Spanish). Programa de las Naciones Unidas para el Desarrollo. p. 61. Archived from the original (PDF) on 2007-07-12. Retrieved 2008-11-16.
  25. "Crime in the RSA for the period January to December 1994-2002, Vaal Rand". Institute for Security Studies. Archived from the original on 2003-12-04. Retrieved 2010-07-09.
  26. 1 2 3 4 5 6 7 8 9 10 11 12 13 "Mapa da Violência 2006" (PDF). OEI. p. 45. Archived from the original (PDF) on 2008-06-24. Retrieved 2008-10-22.
  27. "ALGUNOS INDICADORES SOBRE LA SITUACIÓN DE LOS DERECHOS HUMANOS EN BARRANCABERMEJA Y SU ZONA DE INFLUENCIA" (PDF) (in Spanish). ReliefWeb. p. 3. Retrieved 2009-05-09.
  28. 1 2 3 4 5 6 7 8 9 10 "Diagnóstico Departamental Valle del Cauca" (PDF) (in Spanish). Programa Presidencial de Derechos Humanos y Derecho Internacional Humanitario. p. 25. Archived from the original (PDF) on 2012-04-04. Retrieved 2009-05-16.
  29. "The Status of Cape Town: Development Overview" (PDF). Isandla Institute. p. 43. Archived from the original (PDF) on 2007-09-30. Retrieved 2007-07-08.
  30. "Crime in South Africa: A country and cities profile". Institute for Security Studies. Archived from the original on 2013-01-26. Retrieved 2008-01-08.
  31. "Antioquia" (PDF) (in Spanish). UN Virtual. p. 25. Archived from the original (PDF) on 2012-02-27. Retrieved 2007-09-18.
  32. "Panorama actual del Norte de Santander" (PDF) (in Spanish). Programa Presidencial de Derechos Humanos y Derecho Internacional Humanitario. p. 19. Archived from the original (PDF) on 2021-09-04. Retrieved 2010-07-08.
  33. 1 2 3 4 5 6 "Mapa da violência IV" (PDF) (in Portuguese). UNESCO Documents and Publications. pp. 44, 46. Retrieved 2009-10-30.
  34. "Diagnóstico Bogotá" (PDF) (in Spanish). Programa Presidencial de Derechos Humanos y Derecho Internacional Humanitario. p. 2. Archived from the original (PDF) on 2012-04-04. Retrieved 2009-10-15.
  35. "Estadistico Bogotá" (PDF) (in Spanish). Programa Presidencial de Derechos Humanos y Derecho Internacional Humanitario. Archived from the original (PDF) on 2012-04-04. Retrieved 2011-09-30.
  36. 1 2 3 "Crime Report 2005" (PDF). GunCite. pp. 6, 48. Retrieved 2009-05-09.
  37. 1 2 3 4 5 6 "Violent Deaths in SA" (PDF). Institute for Security Studies. pp. 3–4, 6. Archived from the original (PDF) on 2006-10-12. Retrieved 2009-10-17.
  38. "a profile of fatal injuries in South Africa, Cape Town Metropolitan Area" (PDF). SA HealthInfo. p. 1. Archived from the original (PDF) on 2011-10-03. Retrieved 2009-10-17.
  39. 1 2 3 4 5 "A profile of fatal injuries in South Africa" (PDF). SA Medical Research Council. p. 49. Archived from the original (PDF) on 2011-07-26. Retrieved 2009-10-22.
  40. "Estadísticas de Mortalidad" (in Spanish). Instituto Nacional de Estadística y Geografía. Retrieved 2011-09-14.
  41. "A profile of fatal injuries in South Africa, eThekwini Metropolitan Area" (PDF). SA HealthInfo. p. 1. Archived from the original (PDF) on 2011-10-03. Retrieved 2009-10-19.
  42. "A profile of fatal injuries in South Africa, Johannesburg Metropolitan Area" (PDF). SA HealthInfo. p. 1. Archived from the original (PDF) on 2011-10-03. Retrieved 2009-05-18.
  43. "Comparative Statement Showing Cognizable Cases Reported During the Period from 01-01-2007 to 31-12-2007". Sindh Police. Archived from the original on 2008-11-20. Retrieved 2010-07-07.
  44. "Disposal of Cases for the Year 2008" (PDF). Sindh Police. p. 1. Retrieved 2010-07-07.[ permanent dead link ]
  45. "Murders Reported and Cleared Up for Period 2008/01/01 to 2008/12/31 & Comparative" (PDF). Jamaica Constabulary Force. Retrieved 2009-02-28.[ dead link ]
  46. "CIUS 2000 Section II Crime Index Offenses Reported" (PDF). Federal Bureau of Investigation. pp. 21–49. Archived from the original (PDF) on March 27, 2009. Retrieved 2009-05-18.
  47. "CIUS 2001 Section II" (PDF). Federal Bureau of Investigation. pp. 87–116. Archived from the original (PDF) on March 27, 2009. Retrieved 2009-05-18.
  48. "CUIS 2002 Section II" (PDF). Federal Bureau of Investigation. pp. 83–112. Archived from the original (PDF) on March 27, 2009. Retrieved 2009-05-18.
  49. "CIUS 2003 Section II" (PDF). Federal Bureau of Investigation. pp. 93–129. Archived from the original (PDF) on March 25, 2009. Retrieved 2009-05-18.
  50. "Table 6, Crime in the United States by Metropolitan Statistical Area, 2004". Federal Bureau of Investigation. Retrieved 2009-05-18.
  51. "Table 6, Crime in the United States by Metropolitan Statistical Area, 2005". Federal Bureau of Investigation. Retrieved 2009-05-18.
  52. "Table 6, Crime in the United States by Metropolitan Statistical Area, 2006". Federal Bureau of Investigation. Retrieved 2009-05-18.
  53. "Table 6, Crime in the United States by Metropolitan Statistical Area, 2007". Federal Bureau of Investigation. Retrieved 2009-05-18.
  54. "Table 6, Crime in the United States by Metropolitan Statistical Area, 2008". Federal Bureau of Investigation. Retrieved 2010-01-16.
  55. "Table 6, Crime in the United States by Metropolitan Statistical Area, 2009". Federal Bureau of Investigation. Retrieved 2011-03-21.
  56. 1 2 3 4 5 6 7 8 9 10 11 "Análise das Ocorrências Registradas pelas Polícias Civis (Janeiro de 2004 a Dezembro de 2005)" (in Portuguese). Ministério da Justiça. pp. 18–19. Archived from the original (PDF) on 2011-07-21. Retrieved 2011-03-31.
  57. 1 2 3 4 5 6 7 8 "Mapa da Violência 2011" (PDF) (in Portuguese). Instituto Sangari. pp. 42, 46–47. Archived from the original (PDF) on 2011-09-05. Retrieved 2011-10-10.
  58. "Homicidios 2000" (PDF) (in Spanish). Medicina Legal. p. 27. Retrieved 2009-05-16.[ permanent dead link ]
  59. "Homicidios 2001" (PDF) (in Spanish). Medicina Legal. pp. 51–53. Retrieved 2009-05-16.[ permanent dead link ]
  60. 1 2 3 "Homicidio 2002" (PDF) (in Spanish). Medicina Legal. pp. 40–42. Retrieved 2009-05-16.[ permanent dead link ]
  61. "Diagnóstico Departamental Santander" (PDF) (in Spanish). Programa Presidencial de Derechos Humanos y Derecho Internacional Humanitario. p. 16. Archived from the original (PDF) on September 4, 2021. Retrieved 2009-05-17.
  62. "Homicidios 2007" (PDF) (in Spanish). Medicina Legal. pp. 33–55. Archived from the original (PDF) on 2008-12-17. Retrieved 2009-05-16.
  63. "Homicidios 2008" (PDF) (in Spanish). Medicina Legal. pp. 10–19. Retrieved 2010-07-10.[ permanent dead link ]
  64. 1 2 3 4 5 "Homicidio 2009" (PDF) (in Spanish). Medicina Legal. pp. 60, 64. Retrieved 2010-11-19.[ permanent dead link ]
  65. 1 2 "Mapa da Violência 2010" (PDF) (in Portuguese). Instituto Sangari. p. 29. Archived from the original (PDF) on 2010-07-28. Retrieved 2010-07-01.
  66. "The Status of Cape Town: Development Overview" (PDF). City of Cape Town official website. p. 43. Archived from the original (PDF) on 2007-09-30. Retrieved 2007-07-08.
  67. "A profile of fatal injuries in South Africa" (PDF). SA HealthInfo. p. 1. Retrieved 2009-05-17.
  68. "Crime in Cape Town: 2001-2008" (PDF). City of Cape Town official website. p. 11. Archived from the original (PDF) on 2009-10-07. Retrieved 2009-05-17.
  69. "Diagnóstico Departamental Norte de Santander" (PDF) (in Spanish). Programa Presidencial de Derechos Humanos y Derecho Internacional Humanitario. p. 24. Archived from the original (PDF) on 2012-04-04. Retrieved 2011-11-13.
  70. "A profile of fatal injuries in South Africa" (PDF). SA HealthInfo. p. 1. Archived from the original (PDF) on 2011-10-03. Retrieved 2009-05-17.
  71. "Muertes Violentas y No Intencionales 2008" (PDF) (in Spanish). Instituto Universitario en Democracia, Paz y Seguridad. p. 5. Archived from the original (PDF) on 2012-04-25. Retrieved 2009-04-08.
  72. "Muertes Violentas y No Intencionales 2009" (PDF) (in Spanish). Instituto Universitario en Democracia, Paz y Seguridad. p. 5. Archived from the original (PDF) on 2011-07-26. Retrieved 2010-06-29.
  73. 1 2 3 4 5 6 7 8 9 10 11 12 13 14 15 16 "Prensa".
  74. 1 2 3 "• Homicide rate for the most populous city in European countries 2012 | Statista" . Retrieved 2020-03-10.
  75. "Crime data dashboard | The Met". www.met.police.uk. Archived from the original on 2019-04-13. Retrieved 2019-04-13.
  76. 1 2 3 "Canada: Homicide Rates". www150.statcan.gc.ca. Retrieved 2020-03-10.