State tax levels in the United States

Last updated

Top Marginal State Income Tax Rate Top Marginal State Income Tax Rate.svg
Top Marginal State Income Tax Rate

State tax levels indicate both the tax burden and the services a state can afford to provide residents.

Contents

States use a different combination of sales, income, excise taxes, and user fees. Some are levied directly from residents and others are levied indirectly. This table includes the per capita tax collected at the state level.

This table does not necessarily reflect the actual tax burdens borne directly by individual persons or businesses in a state. For example, the direct state tax burden on individuals in Alaska is far lower than the table would indicate. The state has no direct personal income tax and does not collect a sales tax at the state level, although it allows local governments to collect their own sales taxes. Alaska collects most of its revenue from corporate taxes on the oil and gas industry.

This table does not take into consideration the taxing and spending of local governments within states, which can vary widely, and sometimes disproportionately with state tax burdens.
State government tax collections (2024)

This data is collected by the United States Census Bureau for state governments during fiscal year 2015. These statistics include tax collections for state governments only; they do not include tax collections from local governments. % represents the proportion of total taxes from that category and not the tax rate.

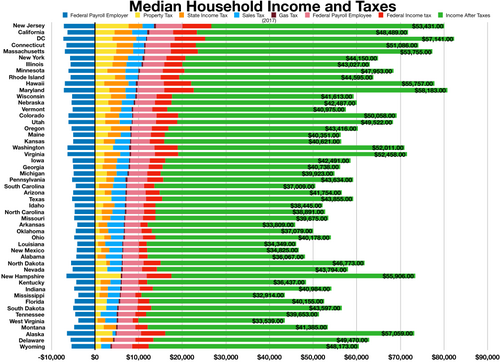
Median household income and taxes.png
Median household income and taxes
State Tax Burdens 2022.jpg
State Tax Burdens 2022
 % of income
State income tax by type.jpg

[1]

Property taxes [A]
($ thousands)
Sales taxes [B]
($ thousands)
License taxes
($ thousands)
Income taxes [C]
($ thousands)
Other taxes [D]
($ thousands)
Total taxes
($ thousands)
Population [E] Per capita ($)
State%%%%%
Alabama 620,6983.67%8,106,23647.98%612,5403.63%7,463,20944.17%92,9980.55%16,895,6815,024,2793362.81
Alaska 130,8556.59%322,60616.25%106,1865.35%389,12519.59%1,037,07452.22%1,985,846733,3912707.76
Arizona 762,8653.23%15,342,93765.02%633,0652.68%6,593,55127.94%263,1981.12%23,595,6167,151,5023299.39
Arkansas 1,515,97811.96%6,815,00053.77%432,9043.42%3,732,27029.45%178,1381.41%12,674,2903,011,5244208.60
California 3,558,0411.34%74,065,32827.89%15,013,8495.65%164,509,96561.95%8,403,4963.16%265,550,67939,538,2236716.30
Colorado 00.00%8,136,84144.05%754,4704.08%9,394,65950.86%187,1051.01%18,473,0755,773,7143199.51
Connecticut 00.00%9,177,91639.54%404,2681.74%13,237,04157.02%393,8531.70%23,213,0783,605,9446437.45
Delaware 00.00%658,91410.08%2,584,13939.55%3,070,86447.00%220,4453.37%6,534,362989,9486600.71
D.C. 3,000,10728.81%2,458,43923.61%240,0532.30%4,271,95441.02%444,2394.27%10,414,792689,54515103.86
Florida 00.00%50,501,72180.05%2,450,4623.88%6,045,8909.58%4,089,8146.48%63,087,88721,538,1872929.12
Georgia 862,8842.56%12,321,55536.62%620,7951.85%19,635,62758.36%203,4260.60%33,644,28710,711,9083140.83
Hawaii 00.00%6,294,85659.53%330,9023.13%3,795,09635.89%153,2051.45%10,574,0591,455,2717266.04
Idaho 00.00%3,758,40945.11%505,7986.07%4,056,25548.69%10,5870.13%8,331,0491,839,1064529.94
Illinois 73,3420.11%27,667,83841.34%3,917,3065.85%34,525,70751.59%736,0511.10%66,920,24412,812,5085223.04
Indiana 15,2850.06%16,156,60461.85%889,1143.40%9,061,32934.69%1,2350.00%26,123,5676,785,5283849.89
Iowa 8370.01%6,241,21748.98%1,118,3798.78%5,293,28041.54%88,2870.69%12,742,0003,190,3693993.90
Kansas 952,5237.29%5,657,73143.30%452,9583.47%5,969,39545.68%35,0440.27%13,067,6512,937,8804447.99
Kentucky 808,1624.69%8,585,80749.86%570,4943.31%7,056,63640.98%199,7871.16%17,220,8864,505,8363821.91
Louisiana 131,2360.82%8,127,41750.94%970,8996.09%5,896,98036.96%828,6125.19%15,955,1444,657,7573425.50
Maine 39,9930.61%3,196,23649.10%336,4345.17%2,858,70243.92%77,7081.19%6,509,0731,362,3594777.80
Maryland 994,7763.22%12,673,02541.00%1,052,6943.41%15,496,87950.13%694,3292.25%30,911,7036,177,2245004.14
Massachusetts 15,4160.04%12,302,20128.56%1,417,4383.29%28,425,44265.98%920,4752.14%43,080,9727,029,9176128.23
Michigan 2,592,9246.90%18,082,32248.13%2,294,2196.11%14,177,50437.73%425,3771.13%37,572,34610,077,3313728.40
Minnesota 731,8652.05%13,575,92638.06%1,622,3084.55%19,149,54153.69%587,3391.65%35,666,9795,706,4946250.24
Mississippi 30,3610.29%6,845,57664.57%631,9005.96%3,045,60028.73%49,1520.46%10,602,5892,961,2793580.41
Missouri 46,1360.26%7,583,23242.63%739,3844.16%9,400,08552.84%20,8590.12%17,789,6966,154,9132890.32
Montana 481,08710.18%902,77719.11%527,07311.16%2,556,94054.13%255,8315.42%4,723,7081,084,2254356.76
Nebraska 1260.00%3,663,20345.20%207,9972.57%4,207,28051.91%26,2330.32%8,104,8391,961,5044131.95
Nevada 1,816,13612.08%11,417,46675.95%783,5185.21%00.00%1,016,1946.76%15,033,3143,104,6144842.25
New Hampshire 410,54911.45%1,020,50928.46%569,53315.88%1,401,97939.09%183,7295.12%3,586,2991,377,5292603.43
New Jersey 4,9640.01%20,870,07240.26%2,333,8014.50%27,446,39852.95%1,183,1242.28%51,838,3599,288,9945580.62
New Mexico 125,9600.92%5,344,36139.03%396,3052.89%3,184,22523.25%4,643,19633.91%13,694,0472,117,5226467.02
New York 00.00%34,950,51829.19%1,934,6561.62%77,058,11464.36%5,783,7494.83%119,727,03720,201,2495926.71
North Carolina 00.00%18,174,64846.45%2,613,1546.68%18,223,47646.58%113,4680.29%39,124,74610,439,3883747.80
North Dakota 5,8180.10%1,881,91232.18%251,7944.31%612,92210.48%3,095,26252.93%5,847,708779,0947505.78
Ohio 00.00%25,290,34167.50%2,094,5245.59%10,020,91926.75%60,5830.16%37,466,36711,799,4483175.26
Oklahoma 00.00%5,630,90243.22%974,8277.48%5,202,63139.94%1,218,9669.36%13,027,3263,959,3533290.27
Oregon 20,7340.12%4,219,27024.48%1,268,9997.36%11,223,34065.12%501,6252.91%17,233,9684,237,2564067.25
Pennsylvania 44,0730.08%27,610,03050.02%3,163,3085.73%22,035,56339.92%2,345,0534.25%55,198,02713,002,7004245.12
Rhode Island 5,3640.10%2,841,17853.84%165,2323.13%2,197,59641.64%68,0781.29%5,277,4481,097,3794809.14
South Carolina 92,8210.51%9,497,66952.69%750,4854.16%7,496,59141.59%188,9291.05%18,026,4955,118,4253521.88
South Dakota 00.00%2,258,09584.31%347,62412.98%60,7182.27%11,9950.45%2,678,432886,6673020.79
Tennessee 00.00%18,157,16975.15%2,559,42210.59%3,050,69212.63%392,5131.62%24,159,7966,910,8403495.93
Texas 00.00%74,929,96885.79%3,810,7054.36%00.00%8,596,0279.84%87,336,70029,145,5052996.58
Utah 00.00%5,719,11042.56%450,0483.35%7,169,55653.35%99,1180.74%13,437,8323,271,6164107.40
Vermont 1,307,25528.17%1,544,09333.27%156,8283.38%1,498,47032.29%134,1032.89%4,640,749643,0777216.47
Virginia 45,1140.12%14,316,56338.01%1,205,0703.20%21,473,73757.02%620,6601.65%37,661,1448,631,3934363.28
Washington 4,614,07312.36%28,367,38175.97%2,140,8155.73%350,4470.94%1,869,3395.01%37,342,0557,705,2814846.29
West Virginia 9,3500.13%3,546,59450.79%236,2483.38%2,735,32239.17%455,6046.52%6,983,1181,793,7163893.10
Wisconsin 104,7560.41%10,641,43341.74%1,396,3955.48%13,244,56151.95%108,9310.43%25,496,0765,893,7184325.97
Wyoming 401,75115.22%1,223,68946.36%212,8468.06%00.00%801,44230.36%2,639,728576,8514576.10
United States26,374,2151.78%678,674,84145.87%71,254,1654.82%649,004,06343.87%54,115,5853.66%1,479,422,869331,449,2814463.50

Notes

  1. ^ Only includes taxes collected at the state level
  2. ^ Includes alcohol, fuel, and tobacco taxes
  3. ^ Includes both personal and business income
  4. ^ Includes inheritance, gift, and severance taxes
  5. ^ As of April 1, 2020

State government tax collections (2012)

This data is collected by the United States Census Bureau for state governments during fiscal year 2012. These statistics include tax collections for state governments only; they do not include tax collections from local governments. [2]  % represents the proportion of total taxes from that category and not the tax rate.

Sales taxes [A]
($ thousands)
Income taxes [B]
($ thousands)
Property taxes [C]
($ thousands)
License taxes
($ thousands)
Other taxes [D]
($ thousands)
Total taxes
($ thousands)
Population [E] Per capita ($)
State%%%%%
Alabama 4,626,35751%3,430,69038%321,5304%517,6766%153,0412%9,049,2944,822,0231,876.66
Alaska 248,4324%663,1449%215,4073%135,0552%5,787,36082%7,049,398731,4499,637.58
Arizona 8,066,12462%3,741,71329%754,4286%370,2223%40,7780%12,973,2656,553,2551,979.67
Arkansas 3,982,83248%2,805,98534%1,008,70712%355,7684%131,2082%8,284,5002,949,1312,809.13
California 41,341,18836%62,973,43555%2,079,8782%8,658,0418%37,1120%115,089,65438,041,4303,025.38
Colorado 4,090,64540%5,367,85152%XX616,7526%175,3802%10,250,6285,187,5821,975.99
Connecticut 6,678,11743%7,996,50952%XX416,3963%309,9962%15,401,0183,590,3474,289.56
Delaware 491,04415%1,455,15943%XX1,230,38437%170,3655%3,346,952917,0923,649.53
Florida 27,267,19683%2,003,4906%1400%2,205,3767%1,520,8105%32,997,01219,317,5681,708.13
Georgia 7,253,55444%8,733,04753%68,9510%505,6183%15,7330%16,576,9039,919,9451,671.07
Hawaii 3,581,65265%1,621,00229%XX258,7955%54,6971%5,516,1461,392,3133,961.86
Idaho 1,664,61549%1,401,92442%XX299,4439%8,3220%3,374,3041,595,7282,114.59
Illinois 14,295,68839%19,006,84952%65,1060%2,602,2967%287,8231%36,257,76212,875,2552,816.08
Indiana 9,172,71558%5,724,36636%00%629,2604%178,1661%15,704,5076,537,3342,402.28
Iowa 3,532,81145%3,455,48544%XX751,62710%92,4651%7,832,3883,074,1862,547.79
Kansas 3,685,59550%3,209,32143%74,4131%315,4114%133,6012%7,418,3412,885,9052,570.54
Kentucky 5,034,57748%4,087,23939%529,5675%463,7934%390,6184%10,505,7944,380,4152,398.36
Louisiana 4,888,85454%2,764,99531%50,9371%402,2124%887,05510%8,994,0534,601,8931,954.42
Maine 1,748,81546%1,674,04444%38,3601%252,4047%63,5072%3,777,1301,329,1922,841.67
Maryland 7,173,51542%7,996,96147%755,9374%730,8784%381,2032%17,038,4945,884,5632,895.46
Massachusetts 7,319,03032%13,935,23261%4,4410%899,6824%647,2593%22,805,6446,646,1443,431.41
Michigan 12,654,54753%7,725,07032%1,911,1888%1,414,9866%213,9501%23,919,7419,883,3602,420.20
Minnesota 9,139,15444%9,054,10644%807,7004%1,186,7346%372,8462%20,560,5405,379,1393,822.27
Mississippi 4,396,66963%1,896,94527%23,9820%517,9827%117,7842%6,953,3622,984,9262,329.49
Missouri 4,764,94044%5,433,36750%29,4090%563,5705%10,7660%10,802,0526,021,9881,793.77
Montana 544,73322%1,032,54142%257,18910%315,57113%309,29013%2,459,3241,005,1412,446.75
Nebraska 2,059,91348%2,072,64048%780%183,0354%17,0910%4,332,7571,855,5252,335.06
Nevada 5,231,96277%00%234,5223%583,8299%724,79911%6,775,1122,758,9312,455.70
New Hampshire 875,03740%602,86627%380,68217%265,55512%84,0614%2,208,2011,320,7181,671.97
New Jersey 12,009,55244%13,057,55148%5,6500%1,425,4415%957,9813%27,456,1758,864,5903,097.29
New Mexico 2,653,44952%1,431,51528%60,1831%180,2594%767,73615%5,093,1422,085,5382,442.12
New York 22,869,32732%43,339,85761%XX1,926,8043%3,409,7575%71,545,74519,570,2613,655.84
North Carolina 9,539,29942%11,603,86851%XX1,475,9606%94,2300%22,713,3579,752,0732,329.08
North Dakota 1,594,52928%648,14912%2,3980%187,8473%3,187,11357%5,620,036699,6288,032.89
Ohio 13,119,73451%9,147,10335%XX3,580,48314%76,7040%25,924,02411,544,2252,245.63
Oklahoma 3,724,41642%3,220,38536%XX1,032,98112%861,51710%8,839,2993,814,8202,317.09
Oregon 1,398,99816%6,258,92372%15,7100%903,13210%122,8631%8,699,6263,899,3532,231.04
Pennsylvania 17,151,63352%11,939,48736%38,4520%2,646,4938%1,173,8524%32,949,91712,763,5362,581.57
Rhode Island 1,477,99252%1,203,95943%2,0950%107,5954%35,8621%2,827,5031,050,2922,692.11
South Carolina 4,198,26152%3,349,73842%8,8110%449,7276%29,9450%8,036,4824,723,7231,701.30
South Dakota 1,197,11679%59,8374%XX250,57216%13,9521%1,521,477833,3541,825.73
Tennessee 8,962,19575%1,408,14112%XX1,282,01511%329,9943%11,982,3456,456,2431,855.93
Texas 37,431,96677%00%XX7,509,00015%3,655,5828%48,596,54826,059,2031,864.85
Utah 2,722,12847%2,725,07347%XX255,6774%107,0752%5,809,9532,855,2872,034.81
Vermont 968,30335%695,02925%948,74934%101,1614%44,1282%2,757,370626,0114,404.67
Virginia 5,853,26632%11,054,93861%34,2970%777,1874%417,8982%18,137,5868,185,8672,215.72
Washington 14,171,44380%00%1,897,09511%994,8196%561,3583%17,624,7156,897,0122,555.41
West Virginia 2,559,58648%1,948,13137%6,0390%137,6703%634,34712%5,285,7731,855,4132,848.84
Wisconsin 7,008,02244%7,696,50248%155,5711%1,077,7427%57,4980%15,995,3355,726,3982,793.26
Wyoming 1,120,20344%00%316,73412%140,0455%974,00938%2,550,991576,4124,425.64
Total377,541,72947%322,654,16240%13,104,3362%54,090,9617%30,830,4874%798,221,675313,914,0402,542.80

Notes

  1. ^ Includes alcohol, fuel, and tobacco taxes
  2. ^ Includes both personal and business income
  3. ^ Only includes taxes collected at the state level
  4. ^ Includes inheritance, gift, and severance taxes
  5. ^ As of July 1, 2012 [3]

State individual income tax rates and brackets

State individual income tax rates & brackets (2016) [4]
StateSingle filer
rates > Brackets
Married filing jointly
rates > Brackets
Ala.2.00% > $02.00% > $0
4.00% > $5004.00% > $1,000
5.00% > $3,0005.00% > $6,000
Alaskanonenone
Ariz.2.59% > $02.59% > $0
2.88% > $10,0002.88% > $20,000
3.36% > $25,0003.36% > $50,000
4.24% > $50,0004.24% > $100,000
4.54% > $150,0004.54% > $300,000
Ark.0.90% > $00.90% > $0
2.50% > $4,2992.50% > $4,299
3.50% > $8,3993.50% > $8,399
4.50% > $12,5994.50% > $12,599
6.00% > $20,9996.00% > $20,999
6.90% > $35,0996.90% > $35,099
Calif.1.00% > $01.00% > $0
2.00% > $7,8502.00% > $15,700
4.00% > $18,6104.00% > $37,220
6.00% > $29,3726.00% > $58,744
8.00% > $40,7738.00% > $81,546
9.30% > $51,5309.30% > $103,060
10.30% > $263,22210.30% > $526,444
11.30% > $315,86611.30% > $631,732
12.30% > $526,44312.30% > $1,000,000
13.30% > $1,000,00013.30% > $1,052,886
Colo.4.63% of federal4.63% of federal
Conn.3.00% > $03.00% > $0
5.00% > $10,0005.00% > $20,000
5.50% > $50,0005.50% > $100,000
6.00% > $100,0006.00% > $200,000
6.50% > $200,0006.50% > $400,000
6.90% > $250,0006.90% > $500,000
6.99% > $500,0006.99% > $1,000,000
Del.2.20% > $2,0002.20% > $2,000
3.90% > $5,0003.90% > $5,000
4.80% > $10,0004.80% > $10,000
5.20% > $20,0005.20% > $20,000
5.55% > $25,0005.55% > $25,000
6.60% > $60,0006.60% > $60,000
Fla.nonenone
Ga.1.00% > $01.00% > $0
2.00% > $7502.00% > $1,000
3.00% > $2,2503.00% > $3,000
4.00% > $3,7504.00% > $5,000
5.00% > $5,2505.00% > $7,000
6.00% > $7,0006.00% > $10,000
Hawaii1.40% > $01.40% > $0
3.20% > $2,4003.20% > $4,800
5.50% > $4,8005.50% > $9,600
6.40% > $9,6006.40% > $19,200
6.80% > $14,4006.80% > $28,800
7.20% > $19,2007.20% > $38,400
7.60% > $24,0007.60% > $48,000
7.90% > $36,0007.90% > $72,000
8.25% > $48,0008.25% > $96,000
Idaho1.60% > $01.60% > $0
3.60% > $1,4523.60% > $2,904
4.10% > $2,9404.10% > $5,808
5.10% > $4,3565.10% > $8,712
6.10% > $5,8086.10% > $11,616
7.10% > $7,2607.10% > $14,520
7.40% > $10,8907.40% > $21,780
Ill.3.75% of federal3.75% of federal
Ind.3.3% of federal3.3% of federal
Iowa0.36% > $00.36% > $0
0.72% > $1,5540.72% > $1,554
2.43% > $3,1082.43% > $3,108
4.50% > $6,2164.50% > $6,216
6.12% > $13,8966.12% > $13,896
6.48% > $23,3106.48% > $23,310
6.80% > $31,0806.80% > $31,080
7.92% > $46,6207.92% > $46,620
8.98% > $69,9308.98% > $69,930
Kans.2.70% > $02.70% > $0
4.60% > $15,0004.60% > $30,000
Ky.2.00% > $02.00% > $0
3.00% > $3,0003.00% > $3,000
4.00% > $4,0004.00% > $4,000
5.00% > $5,0005.00% > $5,000
5.80% > $8,0005.80% > $8,000
6.00% > $75,0006.00% > $75,000
La.2.00% > $02.00% > $0
4.00% > $12,5004.00% > $25,000
6.00% > $50,0006.00% > $100,000
Maine5.80% > $05.80% > $0
6.75% > $21,0496.75% > $42,099
7.15% > $37,4997.15% > $74,999
Md.2.00% > $02.00% > $0
3.00% > $1,0003.00% > $1,000
4.00% > $2,0004.00% > $2,000
4.75% > $3,0004.75% > $3,000
5.00% > $100,0005.00% > $150,000
5.25% > $125,0005.25% > $175,000
5.50% > $150,0005.50% > $225,000
5.75% > $250,0005.75% > $300,000
Mass.5.10% > $05.10% > $0
Mich.4.25% of federal AGI4.25% of federal AGI
Minn.5.35% > $05.35% > $0
7.05% > $25,1807.05% > $36,820
7.85% > $82,7407.85% > $146,270
9.85% > $155,6509.85% > $259,420
Miss.3.00% > $03.00% > $0
4.00% > $5,0004.00% > $5,000
5.00% > $10,0005.00% > $10,000
Mo.1.50% > $01.50% > $0
2.00% > $1,0002.00% > $1,000
2.50% > $2,0002.50% > $2,000
3.00% > $3,0003.00% > $3,000
3.50% > $4,0003.50% > $4,000
4.00% > $5,0004.00% > $5,000
4.50% > $6,0004.50% > $6,000
5.00% > $7,0005.00% > $7,000
5.50% > $8,0005.50% > $8,000
6.00% > $9,0006.00% > $9,000
Mont.1.00% > $01.00% > $0
2.00% > $2,9002.00% > $2,900
3.00% > $5,1003.00% > $5,100
4.00% > $7,8004.00% > $7,800
5.00% > $10,5005.00% > $10,500
6.00% > $13,5006.00% > $13,500
6.90% > $17,4006.90% > $17,400
Nebr.2.46% > $02.46% > $0
3.51% > $3,0603.51% > $6,120
5.01% > $18,3705.01% > $36,730
6.84% > $29,5906.84% > $59,180
Nev.nonenone
N.H.5.00% > $0
Interest & dividends
5.00% > $0
Interest & dividends
N.J.1.40% > $01.40% > $0
1.75% > $20,0001.75% > $20,000
3.50% > $35,0002.45% > $50,000
5.53% > $40,0003.50% > $70,000
6.37% > $75,0005.53% > $80,000
8.97% > $500,0006.37% > $150,000
8.97% > $500,000
N.M.1.70% > $01.70% > $0
3.20% > $5,5003.20% > $8,000
4.70% > $11,0004.70% > $16,000
4.90% > $16,0004.90% > $24,000
N.Y.4.00% > $04.00% > $0
4.50% > $8,4504.50% > $17,050
5.25% > $11,6505.25% > $23,450
5.90% > $13,8505.90% > $27,750
6.45% > $21,3006.45% > $42,750
6.65% > $80,1506.65% > $160,500
6.85% > $214,0006.85% > $321,050
8.82% > $1,070,3508.82% > $2,140,900
N.C.5.75% > $05.75% > $0
N.D.1.10% > $01.10% > $0
2.04% > $37,4502.04% > $62,600
2.27% > $90,7502.27% > $151,200
2.64% > $189,3002.64% > $230,450
2.90% > $411,5002.90% > $411,500
Ohio0.50% > $00.50% > $0
0.99% > $5,2000.99% > $5,200
1.98% > $10,4001.98% > $10,400
2.48% > $15,6502.48% > $15,650
2.97% > $20,9002.97% > $20,900
3.47% > $41,7003.47% > $41,700
3.96% > $83,3503.96% > $83,350
4.60% > $104,2504.60% > $104,250
5.00% > $208,5005.00% > $208,500
Okla.0.50% > $00.50% > $0
1.00% > $1,0001.00% > $2,000
2.00% > $2,5002.00% > $5,000
3.00% > $3,7503.00% > $7,500
4.00% > $4,9004.00% > $9,800
5.00% > $7,2005.00% > $12,200
Ore.5.00% > $05.00% > $0
7.00% > $3,3507.00% > $6,500
9.00% > $8,4009.00% > $16,300
9.90% > $125,0009.90% > $250,000
Pa.3.07% > $03.07% > $0
R.I.3.75% > $03.75% > $0
4.75% > $60,8504.75% > $60,850
5.99% > $138,3005.99% > $138,300
S.C.0.00% > $00.00% > $0
3.00% > $2,9203.00% > $2,920
4.00% > $5,8404.00% > $5,840
5.00% > $8,7605.00% > $8,760
6.00% > $11,6806.00% > $11,680
7.00% > $14,6007.00% > $14,600
S.D.nonenone
Tenn.6.00% > $0
Interest & dividends
6.00% > $0
Interest & dividends
Tex.nonenone
Utah5.00% > $05.00% > $0
Vt.3.55% > $03.55% > $0
6.80% > $39,9006.80% > $69,900
7.80% > $93,4007.80% > $160,450
8.80% > $192,4008.80% > $240,000
8.95% > $415,6008.95% > $421,900
Va.2.00% > $02.00% > $0
3.00% > $3,0003.00% > $3,000
5.00% > $5,0005.00% > $5,000
5.75% > $17,0005.75% > $17,000
Wash.nonenone
W.Va.3.00% > $03.00% > $0
4.00% > $10,0004.00% > $10,000
4.50% > $25,0004.50% > $25,000
6.00% > $40,0006.00% > $40,000
6.50% > $60,0006.50% > $60,000
Wis.4.00% > $04.00% > $0
5.84% > $11,1505.84% > $14,820
6.27% > $22,2306.27% > $29,640
7.65% > $244,7507.65% > $326,330
Wyo.nonenone
D.C.4.00% > $04.00% > $0
6.00% > $10,0006.00% > $10,000
6.50% > $40,0006.50% > $40,000
8.50% > $60,0008.50% > $60,000
8.75% > $350,0008.75% > $350,000

See also

State taxes:

Federal:

General:

References

  1. "2024 State Government Tax Tables". US Census Bureau. Retrieved 2025-04-18.
  2. "2012 Annual Survey of State Government Tax Collections". U.S. Census Bureau. Retrieved 2014-02-08.
  3. "Annual Estimates of the Resident Population for the United States, Regions, States, and Puerto Rico: April 1, 2010 to July 1, 2012". U.S. Census Bureau. Retrieved 2014-02-08.
  4. "State Individual Income Tax Rates and Brackets for 2016". 8 February 2016.