This article has lists of US states and US territories by incarceration and correctional supervision rates. There are also counts of inmates for various categories. The data is from the United States Department of Justice and other sources. The incarceration numbers include sentenced and unsentenced inmates from many categories.
This table and the one that directly follows it are a comprehensive breakdown of inmates across many categories. The incarceration rate for a state or US territory is calculated from the total of inmates across that location row in both tables. Nationwide totals for each column are at the end of each table. [1]
Some US territories are in alphabetical order in the 2 table halves: American Samoa, Northern Mariana Islands, and the U.S. Virgin Islands.
Incarceration rates per 100,000. Counts. Data is from various years. Latest data available as of June 24.
Location | Incarceration rate | Total incarcerated | State population | State prisons | Federal | Local jails |
---|---|---|---|---|---|---|
Alabama * | 898 | 45,573 | 5,073,903 | 26,421 | 3,607 | 14,727 |
Alaska * | 744 | 5,456 | 733,276 | 4,778 | 498 | 12 |
American Samoa | 606 | 301 | 49,710 | 301 | N/A | N/A |
Arizona * | 710 | 52,329 | 7,365,684 | 33,865 | 3,567 | 13,541 |
Arkansas * | 912 | 27,795 | 3,046,404 | 17,625 | 2,522 | 7,165 |
California * | 494 | 192,694 | 39,040,616 | 97,608 | 12,172 | 75,061 |
Colorado * | 556 | 32,495 | 5,841,039 | 17,168 | 1,811 | 12,719 |
Connecticut * | 326 | 11,747 | 3,608,706 | 10,506 | 949 | N/A |
Delaware * | 539 | 5,492 | 1,019,459 | 4,954 | 361 | N/A |
Florida * | 705 | 156,734 | 22,245,521 | 84,678 | 13,370 | 55,826 |
Georgia * | 881 | 96,171 | 10,913,150 | 48,439 | 6,897 | 40,085 |
Guam | 502 | 772 | 153,836 | 678 | 94 | N/A |
Hawaii * | 367 | 5,283 | 1,439,399 | 4,149 | 834 | N/A |
Idaho * | 720 | 13,965 | 1,938,996 | 9,110 | 950 | 3,508 |
Illinois * | 433 | 54,474 | 12,582,515 | 29,634 | 6,386 | 16,493 |
Indiana * | 721 | 49,241 | 6,832,274 | 25,286 | 3,436 | 19,416 |
Iowa * | 550 | 17,598 | 3,199,693 | 8,473 | 3,744 | 4,950 |
Kansas * | 648 | 19,022 | 2,936,716 | 8,709 | 1,537 | 8,065 |
Kentucky * | 889 | 40,107 | 4,511,563 | 19,744 | 3,182 | 16,844 |
Louisiana * | 1,067 | 48,973 | 4,588,023 | 27,296 | 2,538 | 18,183 |
Maine | 272 | 3,777 | 1,389,338 | 1,675 | 452 | 1,623 |
Maryland * | 475 | 29,304 | 6,163,981 | 15,637 | 4,068 | 8,455 |
Massachusetts * | 241 | 16,798 | 6,982,740 | 6,001 | 1,279 | 9,129 |
Michigan * | 535 | 53,683 | 10,033,281 | 32,374 | 4,477 | 15,875 |
Minnesota * | 323 | 18,457 | 5,714,300 | 8,636 | 2,003 | 6,343 |
Mississippi * | 1,020 | 29,980 | 2,938,928 | 19,802 | 2,041 | 7,829 |
Missouri * | 713 | 44,016 | 6,177,168 | 23,911 | 6,747 | 11,576 |
Montana * | 758 | 8,508 | 1,122,878 | 4,691 | 1,214 | 2,206 |
Nebraska * | 591 | 11,635 | 1,968,060 | 5,649 | 1,390 | 4,119 |
Nevada * | 610 | 19,370 | 3,177,421 | 10,304 | 1,311 | 7,211 |
New Hampshire | 278 | 3,886 | 1,399,003 | 2,086 | 426 | 1,332 |
New Jersey * | 270 | 25,016 | 9,260,817 | 12,657 | 2,337 | 8,775 |
New Mexico * | 647 | 13,676 | 2,113,476 | 4,970 | 1,746 | 6,549 |
New York * | 317 | 62,339 | 19,673,200 | 31,148 | 8,859 | 20,448 |
North Carolina * | 559 | 59,753 | 10,695,965 | 29,627 | 9,164 | 20,360 |
North Dakota * | 560 | 4,363 | 778,912 | 1,817 | 901 | 1,434 |
Northern Mariana Islands | 400 | 189 | 47,329 | 170 | 19 | N/A |
Ohio * | 621 | 72,989 | 11,759,697 | 45,313 | 4,728 | 20,582 |
Oklahoma * | 905 | 36,388 | 4,019,271 | 22,941 | 2,350 | 10,625 |
Oregon * | 494 | 20,942 | 4,239,379 | 12,518 | 1,182 | 5,991 |
Pennsylvania * | 589 | 76,355 | 12,972,091 | 37,910 | 5,726 | 31,303 |
Puerto Rico * | 341 | 10,995 | 3,220,113 | 7,067 | 3,928 | N/A |
Rhode Island * | 254 | 2,779 | 1,093,842 | 2,393 | 260 | N/A |
South Carolina * | 606 | 32,038 | 5,282,955 | 16,318 | 3,712 | 11,177 |
South Dakota * | 812 | 7,386 | 909,869 | 3,444 | 1,327 | 2,003 |
Tennessee * | 817 | 57,625 | 7,048,976 | 23,735 | 7,044 | 26,463 |
Texas * | 751 | 225,480 | 30,029,848 | 139,631 | 23,244 | 58,489 |
U.S. Virgin Islands | 651 | 567 | 87,146 | 417 | 150 | N/A |
Utah * | 396 | 13,381 | 3,381,236 | 6,009 | 1,313 | 5,765 |
Vermont * | 245 | 1,583 | 647,110 | 1,360 | 219 | N/A |
Virginia * | 679 | 58,917 | 8,679,099 | 27,162 | 4,722 | 25,229 |
Washington * | 373 | 29,065 | 7,784,477 | 13,772 | 2,438 | 11,567 |
Washington, D.C. * | 816 | 5,473 | 670,949 | N/A | 3,445 | 1,817 |
West Virginia * | 674 | 11,954 | 1,774,035 | 5,873 | 1,289 | 4,372 |
Wisconsin * | 615 | 36,199 | 5,890,543 | 20,873 | 1,615 | 12,741 |
Wyoming * | 785 | 4,568 | 581,629 | 2,154 | 615 | 1,558 |
U.S. total | 608 | 2,048,524 | 336,829,545 | 1,079,467 | 219,140 | 649,181 |
Further breakdown of inmates across categories. US totals at end of table. [1]
US states and territories. Number of inmates by category. Data is from various years. Latest data available as of June 24.
Location | Youth | Indian Country jails | Civil commitment | Forensic psychiatric | Immigration | Military |
---|---|---|---|---|---|---|
Alabama * | 678 | N/A | N/A | 140 | N/A | N/A |
Alaska * | 156 | 2 | N/A | 10 | N/A | N/A |
American Samoa | N/A | N/A | N/A | N/A | N/A | N/A |
Arizona * | 351 | 774 | 88 | 143 | N/A | N/A |
Arkansas * | 297 | N/A | N/A | 186 | N/A | N/A |
California * | 2,385 | N/A | 946 | 4,522 | N/A | N/A |
Colorado * | 462 | 45 | N/A | 290 | N/A | N/A |
Connecticut * | 63 | N/A | N/A | 229 | N/A | N/A |
Delaware * | 135 | N/A | N/A | 42 | N/A | N/A |
Florida * | 1,221 | N/A | 531 | 1,108 | N/A | N/A |
Georgia * | 750 | N/A | N/A | N/A | N/A | N/A |
Guam | N/A | N/A | N/A | N/A | N/A | N/A |
Hawaii * | 27 | N/A | N/A | 273 | N/A | N/A |
Idaho * | 264 | 61 | N/A | 72 | N/A | N/A |
Illinois * | 516 | N/A | 493 | 952 | N/A | N/A |
Indiana * | 837 | N/A | N/A | 266 | N/A | N/A |
Iowa * | 267 | N/A | 164 | N/A | N/A | N/A |
Kansas * | 351 | N/A | 256 | 104 | N/A | N/A |
Kentucky * | 297 | N/A | N/A | 40 | N/A | N/A |
Louisiana * | 717 | N/A | N/A | 239 | N/A | N/A |
Maine | 27 | N/A | N/A | N/A | N/A | N/A |
Maryland * | 198 | N/A | N/A | 946 | N/A | N/A |
Massachusetts * | 204 | N/A | 104 | 81 | N/A | N/A |
Michigan * | 723 | 11 | N/A | 223 | N/A | N/A |
Minnesota * | 378 | 81 | 740 | 276 | N/A | N/A |
Mississippi * | 186 | 44 | N/A | 78 | N/A | N/A |
Missouri * | 612 | N/A | 280 | 890 | N/A | N/A |
Montana * | 99 | 244 | N/A | 54 | N/A | N/A |
Nebraska * | 207 | 8 | 150 | 112 | N/A | N/A |
Nevada * | 342 | 3 | N/A | 199 | N/A | N/A |
New Hampshire | 12 | N/A | 0 | 30 | N/A | N/A |
New Jersey * | 378 | N/A | 419 | 450 | N/A | N/A |
New Mexico * | 198 | 125 | N/A | 88 | N/A | N/A |
New York * | 741 | N/A | 386 | 757 | N/A | N/A |
North Carolina * | 411 | 0 | N/A | 191 | N/A | N/A |
North Dakota * | 39 | 137 | 27 | 8 | N/A | N/A |
Northern Mariana Islands | N/A | N/A | N/A | N/A | N/A | N/A |
Ohio * | 1,476 | N/A | N/A | 890 | N/A | N/A |
Oklahoma * | 261 | 11 | N/A | 200 | N/A | N/A |
Oregon * | 597 | N/A | N/A | 654 | N/A | N/A |
Pennsylvania * | 1,002 | N/A | 55 | 359 | N/A | N/A |
Puerto Rico * | N/A | N/A | N/A | N/A | N/A | N/A |
Rhode Island * | 72 | N/A | N/A | 54 | N/A | N/A |
South Carolina * | 414 | N/A | 204 | 213 | N/A | N/A |
South Dakota * | 99 | 487 | N/A | 26 | N/A | N/A |
Tennessee * | 300 | N/A | N/A | 83 | N/A | N/A |
Texas * | 2,730 | N/A | 447 | 939 | N/A | N/A |
U.S. Virgin Islands | N/A | N/A | N/A | N/A | N/A | N/A |
Utah * | 168 | N/A | N/A | 126 | N/A | N/A |
Vermont * | 0 | N/A | N/A | 4 | N/A | N/A |
Virginia * | 558 | N/A | 406 | 840 | N/A | N/A |
Washington * | 396 | 187 | 102 | 603 | N/A | N/A |
Washington, D.C. * | 78 | N/A | N/A | 133 | N/A | N/A |
West Virginia * | 345 | N/A | N/A | 75 | N/A | N/A |
Wisconsin * | 417 | 44 | 187 | 322 | N/A | N/A |
Wyoming * | 171 | 28 | N/A | 42 | N/A | N/A |
U.S. total | 24,891 | 2,292 | 6,051 | 18,562 | 47,835 | 1,105 |
US territories. Incarceration rate per 100,000 of all ages. Incarceration count. Percent female. Data year is in order by column. [2]
Territory | Rate | Count | Percent female | Data year |
---|---|---|---|---|
American Samoa | 345 | 193 | 4.1% | 2017, 2017, 2017 |
Guam | 411 | 690 | 7.2% | 2019, 2019, 2017 |
Northern Mariana Islands | 313 | 175 | 5.8% | 2019, 2019, 2007 |
Puerto Rico * | 278 | 8,884 | 3.6% | 2019, 2019, 2017 |
U.S. Virgin Islands | 394 | 412 | 2.7% | 2020, 2020, 2011 |
Juvenile detention totals from the Office of Juvenile Justice and Delinquency Prevention. [3]
Year | Male | Female | Total |
---|---|---|---|
1997 | 90,771 | 14,284 | 105,055 |
1999 | 92,985 | 14,508 | 107,493 |
2001 | 89,115 | 15,104 | 104,219 |
2003 | 81,975 | 14,556 | 96,531 |
2006 | 78,998 | 13,723 | 92,721 |
2007 | 75,017 | 11,797 | 86,814 |
2010 | 61,359 | 9,434 | 70,793 |
2011 | 53,079 | 8,344 | 61,423 |
2013 | 46,421 | 7,727 | 54,148 |
2015 | 40,750 | 7,293 | 48,043 |
2017 | 36,982 | 6,598 | 43,580 |
2019 | 31,064 | 5,415 | 36,479 |
2021 | 21,340 | 3,554 | 24,894 |
On January 1, 2008 more than 1 in 100 adults in the United States were in prison or jail. [7] [8] Total US incarceration peaked in 2008. [5] The US incarceration rate was the highest in the world in 2008. [4] It is no longer the highest rate. [9]
The United States has one of the highest rates of female incarceration. [10] According to a November 2017 report by the World Prison Brief around 212,000 of the 714,000 female prisoners worldwide (women and girls) are incarcerated in the United States. [11] In the United States in 2016, women made up 9.8% of the incarcerated population in adult prisons and jails. [12] [13]
Comparing English-speaking developed countries; [9] the overall incarceration rate in the US was 531 per 100,000 population of all ages in 2021, [12] the incarceration rate of Canada was 85 per 100,000 in 2020, [14] England and Wales was 146 per 100,000 in 2023, [15] and Australia was 158 per 100,000 in 2022. [16] Comparing other developed countries, the rate of Spain was 122 per 100,000 in 2020, [17] France was 90 per 100,000 in 2020, [18] Germany was 69 per 100,000 in 2020, [19] Norway was 49 per 100,000 in 2020, [20] Netherlands was 63 per 100,000 in 2018, [21] and Japan was 38 per 100,000 in 2019. [22]
The racial aspect of mass incarceration in the United States is striking. According to Michelle Alexander (in 2010 book), the United States "imprisons a larger percentage of its black population than South Africa did at the height of apartheid." [23]
Chart below has numbers for people in adult facilities, and for people on probation and on parole. [24] The incarceration numbers for the states in the chart below are for sentenced and unsentenced inmates in adult facilities in local jails and state prisons. Numbers for federal prisons are in the Federal line.
Asterisk (*) indicates "Incarceration in STATE" or "Crime in STATE" links.
Correctional supervision numbers for Dec 31, 2018. "In community" is community supervision. Rates are per 100,000 adults. [24]
Jurisdiction | Total | In community | Incarcerated | |||
---|---|---|---|---|---|---|
Counts | Rate | Probation or Parole | Rate | In prison or jail | Rate | |
Federal | 302,100 | 90 | 122,800 | 40 | 179,200 | 50 |
State | 6,083,300 | 1,850 | 4,276,200 | 1,300 | 1,919,200 | 580 |
Alabama * | 99,200 | 2,030 | 60,900 | 1,240 | 40,400 | 820 |
Alaska * | 7,800 | 1,060 | 3,400 | 460 | 4,400 | 600 |
Arizona * | 136,800 | 1,890 | 84,300 | 1,170 | 54,600 | 750 |
Arkansas * | 74,700 | 2,470 | 53,800 | 1,780 | 24,700 | 820 |
California * | 513,100 | 1,290 | 312,400 | 790 | 200,700 | 510 |
Colorado * | 122,600 | 2,140 | 91,300 | 1,590 | 32,700 | 570 |
Connecticut * | 54,800 | 1,530 | 43,100 | 1,210 | 13,700 | 380 |
Delaware * | 20,600 | 2,120 | 14,500 | 1,490 | 6,100 | 620 |
District of Columbia * | 9,500 | 1,340 | 8,600 | 1,210 | 1,800 | 260 |
Florida * | 357,400 | 1,670 | 209,400 | 980 | 150,500 | 700 |
Georgia * | 495,200 | 4,680 | 433,200 | 4,100 | 89,700 | 850 |
Hawaii * | 27,200 | 1,920 | 21,900 | 1,540 | 5,400 | 380 |
Idaho * | 51,800 | 2,920 | 39,700 | 2,240 | 12,100 | 690 |
Illinois * | 171,900 | 1,350 | 116,100 | 910 | 55,800 | 440 |
Indiana * | 164,700 | 2,450 | 118,400 | 1,760 | 46,300 | 690 |
Iowa * | 47,600 | 1,500 | 35,600 | 1,120 | 14,000 | 440 |
Kansas * | 39,000 | 1,340 | 21,900 | 750 | 18,000 | 620 |
Kentucky * | 99,600 | 2,230 | 62,800 | 1,400 | 37,500 | 840 |
Louisiana * | 104,000 | 2,230 | 62,300 | 1,340 | 45,700 | 980 |
Maine | 10,300 | 770 | 6,800 | 500 | 4,000 | 300 |
Maryland * | 96,600 | 1,600 | 80,600 | 1,330 | 27,600 | 460 |
Massachusetts * | 71,200 | 1,030 | 53,700 | 780 | 17,600 | 250 |
Michigan * | 219,200 | 2,190 | 164,800 | 1,650 | 54,500 | 540 |
Minnesota * | 122,900 | 2,180 | 107,500 | 1,910 | 15,900 | 280 |
Mississippi * | 63,600 | 2,130 | 37,200 | 1,240 | 27,500 | 920 |
Missouri * | 106,100 | 1,730 | 63,100 | 1,030 | 43,000 | 700 |
Montana * | 16,700 | 1,570 | 11,400 | 1,070 | 6,200 | 580 |
Nebraska * | 25,100 | 1,300 | 15,900 | 820 | 9,300 | 480 |
Nevada * | 40,300 | 1,310 | 19,800 | 640 | 20,500 | 670 |
New Hampshire | 10,400 | 760 | 6,300 | 460 | 4,100 | 300 |
New Jersey * | 173,700 | 1,950 | 146,300 | 1,640 | 28,700 | 320 |
New Mexico * | 26,800 | 1,280 | 13,700 | 660 | 13,100 | 620 |
New York * | 202,300 | 1,040 | 139,700 | 720 | 67,700 | 350 |
North Carolina * | 148,600 | 1,420 | 94,100 | 900 | 54,600 | 520 |
North Dakota * | 10,100 | 1,320 | 7,000 | 920 | 3,100 | 400 |
Ohio * | 322,500 | 2,760 | 253,900 | 2,170 | 70,500 | 600 |
Oklahoma * | 81,800 | 2,070 | 43,300 | 1,100 | 38,500 | 970 |
Oregon * | 81,000 | 1,920 | 59,900 | 1,420 | 21,100 | 500 |
Pennsylvania * | 360,200 | 2,810 | 288,000 | 2,250 | 77,900 | 610 |
Rhode Island * | 22,000 | 2,080 | 20,900 | 1,980 | 2,800 | 260 |
South Carolina * | 67,000 | 1,310 | 36,700 | 720 | 30,300 | 590 |
South Dakota * | 15,100 | 1,710 | 9,200 | 1,040 | 6,100 | 680 |
Tennessee * | 117,400 | 1,730 | 72,100 | 1,060 | 49,300 | 730 |
Texas * | 672,400 | 2,330 | 474,600 | 1,640 | 218,000 | 750 |
Utah * | 26,800 | 840 | 16,600 | 520 | 12,500 | 390 |
Vermont * | 6,500 | 1,030 | 4,800 | 770 | 1,700 | 260 |
Virginia * | 122,000 | 1,430 | 65,000 | 760 | 57,100 | 670 |
Washington * | 115,200 | 1,520 | 88,900 | 1,170 | 30,900 | 410 |
West Virginia * | 21,500 | 1,190 | 10,900 | 600 | 10,600 | 590 |
Wisconsin * | 100,600 | 1,730 | 63,900 | 1,100 | 36,700 | 630 |
Wyoming * | 9,900 | 1,720 | 6,300 | 1,090 | 4,000 | 700 |
In 2015 there were 1,942,500 male and 202,600 female inmates in prisons and jails. That is 10.4% female. [25]
2015 male and female incarceration and correctional supervision numbers. Rate is per 100,000 of all ages.
Jurisdiction | Parole, probation, etc. | Incarcerated | ||||||||
---|---|---|---|---|---|---|---|---|---|---|
Number | Rate | Number | Rate | |||||||
Total | Male | Female | Male | Female | Total | Male | Female | Male | Female | |
State | 4,518,100 | 3,485,100 | 1,033,000 | 2,190 | 630 | 1,949,400 | 1,759,700 | 189,800 | 1,450 | 150 |
Federal | 132,800 | 109,200 | 23,700 | 70 | 10 | 195,700 | 182,800 | 12,900 | 150 | 10 |
U.S. total | 4,650,900 | 3,594,300 | 1,056,700 | 2,260 | 640 | 2,145,100 | 1,942,500 | 202,600 | 1,600 | 160 |
Alabama * | 64,600 | 50,600 | 14,000 | 2,140 | 560 | 42,900 | 38,600 | 4,300 | 1,640 | 170 |
Alaska * | 8,500 | 6,600 | 1,900 | 1,700 | 550 | 5,400 | 4,800 | 600 | 1,230 | 170 |
Arizona * | 83,300 | 66,700 | 16,700 | 1,950 | 480 | 54,900 | 49,100 | 5,800 | 1,440 | 170 |
Arkansas * | 51,500 | 39,000 | 12,500 | 2,660 | 820 | 24,000 | 21,200 | 2,800 | 1,450 | 180 |
California * | 349,600 | 277,500 | 72,100 | 1,420 | 360 | 201,000 | 186,000 | 15,100 | 950 | 80 |
Colorado * | 89,200 | 66,700 | 22,400 | 2,410 | 820 | 31,800 | 28,000 | 3,800 | 1,010 | 140 |
Connecticut * | 45,300 | 35,700 | 9,500 | 2,040 | 520 | 15,800 | 14,700 | 1,100 | 840 | 60 |
Delaware * | 16,100 | 12,400 | 3,700 | 2,690 | 760 | 6,700 | 6,100 | 500 | 1,330 | 110 |
District of Columbia * | 9,900 | 8,500 | 1,400 | 2,640 | 400 | 1,800 | 1,700 | 100 | 530 | 30 |
Florida * | 225,400 | 167,000 | 58,400 | 1,670 | 560 | 153,000 | 137,900 | 15,100 | 1,380 | 140 |
Georgia * | 451,800 | 353,600 | 98,200 | 7,060 | 1,870 | 88,500 | 79,600 | 8,900 | 1,590 | 170 |
Hawaii * | 22,500 | 17,200 | 5,300 | 2,360 | 740 | 5,900 | 5,200 | 700 | 710 | 100 |
Idaho * | 37,800 | 28,100 | 9,700 | 3,370 | 1,160 | 10,900 | 9,300 | 1,600 | 1,120 | 190 |
Illinois * | 151,300 | 118,200 | 33,100 | 1,870 | 510 | 63,900 | 59,500 | 4,400 | 940 | 70 |
Indiana * | 122,500 | 93,100 | 29,400 | 2,850 | 870 | 43,500 | 38,200 | 5,200 | 1,170 | 160 |
Iowa * | 35,600 | 26,900 | 8,700 | 1,730 | 550 | 12,900 | 11,500 | 1,400 | 740 | 90 |
Kansas * | 20,900 | 16,400 | 4,500 | 1,120 | 310 | 16,600 | 14,800 | 1,800 | 1,010 | 130 |
Kentucky * | 70,600 | 49,400 | 21,300 | 2,260 | 940 | 33,800 | 28,700 | 5,100 | 1,310 | 230 |
Louisiana * | 71,900 | 57,400 | 14,500 | 2,510 | 600 | 49,000 | 45,400 | 3,600 | 1,980 | 150 |
Maine | 6,700 | 5,400 | 1,400 | 820 | 200 | 4,000 | 3,500 | 500 | 540 | 70 |
Maryland * | 87,400 | 71,800 | 15,600 | 2,460 | 500 | 29,700 | 27,800 | 1,900 | 950 | 60 |
Massachusetts * | 66,900 | 52,600 | 14,300 | 1,590 | 410 | 20,100 | 19,000 | 1,200 | 570 | 30 |
Michigan * | 193,900 | 147,700 | 46,100 | 3,020 | 910 | 57,700 | 53,100 | 4,600 | 1,090 | 90 |
Minnesota * | 105,100 | 81,000 | 24,000 | 2,960 | 870 | 16,500 | 14,800 | 1,600 | 540 | 60 |
Mississippi * | 44,800 | 35,500 | 9,300 | 2,440 | 600 | 28,000 | 25,800 | 2,300 | 1,770 | 150 |
Missouri * | 62,600 | 47,600 | 15,000 | 1,590 | 480 | 43,400 | 38,500 | 4,900 | 1,290 | 160 |
Montana * | 9,700 | 7,400 | 2,300 | 1,430 | 440 | 5,600 | 4,800 | 800 | 930 | 150 |
Nebraska * | 13,700 | 10,000 | 3,700 | 1,050 | 390 | 8,600 | 7,700 | 900 | 810 | 100 |
Nevada * | 19,200 | 15,200 | 4,000 | 1,040 | 270 | 19,100 | 16,800 | 2,300 | 1,150 | 160 |
New Hampshire | 6,300 | 4,900 | 1,400 | 750 | 210 | 4,600 | 4,100 | 500 | 620 | 80 |
New Jersey * | 151,300 | 117,700 | 33,700 | 2,690 | 730 | 33,900 | 31,700 | 2,200 | 720 | 50 |
New Mexico * | 16,800 | 12,600 | 4,200 | 1,210 | 400 | 15,100 | 13,300 | 1,800 | 1,290 | 170 |
New York * | 145,600 | 120,500 | 25,000 | 1,250 | 250 | 75,900 | 71,100 | 4,800 | 740 | 50 |
North Carolina * | 97,400 | 73,400 | 24,000 | 1,490 | 460 | 53,800 | 48,800 | 5,000 | 990 | 100 |
North Dakota * | 6,900 | 5,100 | 1,800 | 1,300 | 490 | 3,200 | 2,700 | 400 | 690 | 120 |
Ohio * | 262,000 | 189,700 | 72,300 | 3,330 | 1,220 | 70,700 | 62,800 | 7,900 | 1,100 | 130 |
Oklahoma * | 33,400 | 25,700 | 7,700 | 1,320 | 390 | 39,700 | 34,400 | 5,300 | 1,770 | 270 |
Oregon * | 61,900 | 49,600 | 12,300 | 2,470 | 600 | 21,000 | 18,600 | 2,400 | 930 | 120 |
Pennsylvania * | 296,200 | 223,500 | 72,700 | 3,560 | 1,110 | 83,900 | 76,300 | 7,600 | 1,220 | 120 |
Rhode Island * | 24,400 | 20,600 | 3,800 | 4,010 | 690 | 3,200 | 3,100 | 100 | 600 | 30 |
South Carolina * | 38,500 | 30,500 | 8,000 | 1,280 | 320 | 31,600 | 28,900 | 2,800 | 1,210 | 110 |
South Dakota * | 9,800 | 7,500 | 2,300 | 1,720 | 540 | 5,300 | 4,600 | 800 | 1,050 | 180 |
Tennessee * | 75,400 | 57,100 | 18,300 | 1,770 | 540 | 48,000 | 41,600 | 6,500 | 1,290 | 190 |
Texas * | 488,800 | 375,200 | 113,600 | 2,730 | 810 | 214,800 | 192,500 | 22,300 | 1,400 | 160 |
Utah * | 15,700 | 12,000 | 3,700 | 790 | 240 | 11,700 | 10,100 | 1,600 | 660 | 110 |
Vermont * | 6,300 | 4,800 | 1,500 | 1,550 | 470 | 1,800 | 1,600 | 200 | 520 | 50 |
Virginia * | 57,000 | 43,700 | 13,300 | 1,060 | 310 | 57,300 | 51,000 | 6,300 | 1,230 | 150 |
Washington * | 104,700 | 81,600 | 23,200 | 2,260 | 640 | 29,700 | 26,300 | 3,400 | 730 | 90 |
West Virginia * | 10,100 | 7,300 | 2,800 | 800 | 300 | 10,100 | 8,700 | 1,400 | 950 | 150 |
Wisconsin * | 65,600 | 52,700 | 12,900 | 1,830 | 440 | 35,000 | 31,800 | 3,100 | 1,110 | 110 |
Wyoming * | 5,900 | 4,300 | 1,600 | 1,450 | 550 | 3,900 | 3,400 | 600 | 1,130 | 200 |
See first chart to right. The data is from various years, and is the latest available as of June 2024. From the source report: "This graph shows the number of people in state prisons, local jails, federal prisons, and other systems of confinement from each U.S. state and territory per 100,000 people in that state or territory and the incarceration rate per 100,000 in all countries with a total population of at least 500,000." [26]
See second chart at right. Female incarceration rates by country and US state. Per 100,000 female population of all ages. Incarcerated females of all ages (where the data are available). From a 2018 report with latest available data. From the source report: "This graph shows the number of women in state prisons, local jails, and federal prisons from each U.S. state per 100,000 people in that state and the incarceration rate per 100,000 in all countries with at least a half million in total population." [10]
The West Virginia Division of Corrections and Rehabilitation is an agency of the U.S. state of West Virginia within the state Department of Homeland Security that operates the state's prisons, jails and juvenile detention facilities. The agency has its headquarters in the state's capital of Charleston. The state incarcerates 273 women per 100,000 population, the highest rate of female incarceration in the world, ahead of all other states and foreign nations.
Incarceration in the United States is one of the primary means of punishment for crime in the United States. In 2021, over five million people were under supervision by the criminal justice system, with nearly two million people incarcerated in state or federal prisons and local jails. The United States has the largest known prison population in the world. It has 5% of the world’s population while having 20% of the world’s incarcerated persons. China, with more than four times more inhabitants, has fewer persons in prison. Prison populations grew dramatically beginning in the 1970s, but began a decline around 2009, dropping 25% by year-end 2021.
The Federal Bureau of Prisons (BOP) is responsible for all federal prisons and provides for the care, custody, and control of federal prisoners.
Prison rape commonly refers to the rape of inmates in prison by other inmates or prison staff. In 2001, Human Rights Watch estimated that at least 4.3 million inmates had been raped while incarcerated in the United States. A United States Department of Justice report, Sexual Victimization in Prisons and Jails Reported by Inmates, states that "In 2011–12, an estimated 4.0% of state and federal prison inmates and 3.2% of jail inmates reported experiencing one or more incidents of sexual victimization by another inmate or facility staff in the past 12 months or since admission to the facility, if less than 12 months." However, advocates dispute the accuracy of the numbers, saying they seem to under-report the real numbers of sexual assaults in prison, especially among juveniles.
Crime has been recorded in the United States since its founding and has fluctuated significantly over time. Most available data underestimate crime before the 1930s, giving the false impression that crime was low in the early 1900s and had a sharp rise after. Instead, violent crime during the colonial period was likely three times higher than the highest modern rates in the data we have, and crime had been on the decline since colonial times. Within the better data for crime reporting and recording available starting in the 1930s, crime reached its broad, bulging modern peak between the 1970s and early 1990s. After 1992, crime rates have generally trended downwards each year, with the exceptions of a slight increase in property crimes in 2001 and increases in violent crimes in 2005–2006, 2014–2016 and 2020–2021. As of July 1, 2024 violent crime was down and homicides were on pace to drop to 2015 levels by the end of the year.
Prisons in Germany are a set of penal institutions in the Federal Republic of Germany. Their purpose is rehabilitation--to enable prisoners to lead a life of "social responsibility without committing criminal offenses" upon release--and public safety. Prisons are administered by each federal state , but governed by an overarching federal law. There are 183 prisons in all, with the most located in Germany's most populous states Bavaria and North Rhine-Westphalia. In 2022, the total number of prisoners in Germany was 56,325, an incarceration rate of 67 per 100,000 people.
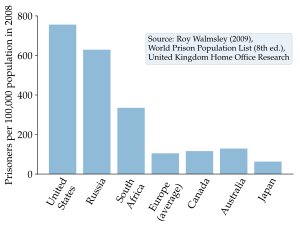
According to the World Prison Brief the United States in 2021 had the sixth highest incarceration rate in the world, at 531 people per 100,000. Between 2019 and 2020, the United States saw a significant drop in the total number of incarcerations. State and federal prison and local jail incarcerations dropped by 14% from 2.1 million in 2019 to 1.8 million in mid-2020. In 2018, the United States had the highest incarceration rate in the world.
The Department of Public Safety and Corrections (DPS&C) is a state law enforcement agency responsible for the incarceration of inmates and management of facilities at state prisons within the state of Louisiana. The agency is headquartered in Baton Rouge. The agency comprises two major areas: Public Safety Services and Corrections Services. The secretary, who is appointed by the governor of Louisiana, serves as the department's chief executive officer. The Corrections Services deputy secretary, undersecretary, and assistant secretaries for the Office of Adult Services and the Office of Youth Development report directly to the secretary. Headquarters administration consists of centralized divisions that support the management and operations of the adult and juvenile institutions, adult and juvenile probation and parole district offices, and all other services provided by the department.
A prison, also known as a jail, gaol, penitentiary, detention center, correction center, correctional facility, remand center, hoosegow, or slammer is a facility where people are imprisoned against their will and denied their liberty under the authority of the state, generally as punishment for various crimes. Authorities most commonly use prisons within a criminal-justice system: people charged with crimes may be imprisoned until their trial; those who have pled or been found guilty of crimes at trial may be sentenced to a specified period of imprisonment.
Lesbian, gay, bisexual, transgender and queer (LGBTQ) people face difficulties in prison such as increased vulnerability to sexual assault, other kinds of violence, and trouble accessing necessary medical care. While much of the available data on LGBTQ inmates comes from the United States, Amnesty International maintains records of known incidents internationally in which LGBTQ prisoners and those perceived to be lesbian, gay, bisexual or transgender have suffered torture, ill-treatment and violence at the hands of fellow inmates as well as prison officials.
Punishment in Australia arises when an individual has been accused or convicted of breaking the law through the Australian criminal justice system. Australia uses prisons, as well as community corrections. When awaiting trial, prisoners may be kept in specialised remand centres or within other prisons.
Approximately 741,000 women are incarcerated in correctional facilities, a 17% increase since 2010 and the female prison population has been increasing across all continents. The list of countries by incarceration rate includes a main table with a column for the historical and current percentage of prisoners who are female.
The Federal Penitentiary Service is a federal agency of the Ministry of Justice of Russia responsible for correctional services.
Prison overcrowding in the United States is a social phenomenon occurring when the demand for space in a U.S. prison exceeds the capacity for prisoners. The issues associated with prison overcrowding are not new, and have been brewing for many years. During the United States' War on Drugs, the states were left responsible for solving the prison overcrowding issue with a limited amount of money. Moreover, federal prison populations may increase if states adhere to federal policies, such as mandatory minimum sentences. On the other hand, the Justice Department provides billions of dollars a year for state and local law enforcement to ensure they follow the policies set forth by the federal government concerning U.S. prisons. Prison overcrowding has affected some states more than others, but overall, the risks of overcrowding are substantial and there are solutions to this problem.
The incarceration of women in the United States refers to the imprisonment of women in both prisons and jails in the United States. There are approximately 219,000 incarcerated women in the US according to a November 2018 report by the Prison Policy Initiative, and the rate of incarceration of women in the United States is at a historic and global high, with 133 women in correctional facilities per every 100,000 female citizens. The United States is home to just 4% of the world's female population, yet the US is responsible for 33% of the entire world's incarcerated female population. The steep rise in the population of incarcerated women in the US is linked to the complex history of the war on drugs and the US's prison–industrial complex, which lead to mass incarceration among many demographics, but had particularly dramatic impacts on women and especially women of color. However, women made up only 10.4% of the US prison and jail population, as of 2015.
Incarceration prevention refers to a variety of methods aimed at reducing prison populations and costs while fostering enhanced social structures. Due to the nature of incarceration in the United States today caused by issues leading to increased incarceration rates, there are methods aimed at preventing the incarceration of at-risk populations.
In 2021, the United States had 1,767,200 inmates in adult facilities. This left America with the highest prison population if China's latest official number (2018) of 1,690,000 were used. According to the World Prison Brief the total number in China would be much higher if pre-trial detainees and those held in administrative detention were added. And yet more depending on the number of Uyghurs being held. The 2021 US incarceration rate of 531 per 100,000 population was the 6th highest rate. According to the World Prison Population List there were around 10.35 million people in penal institutions worldwide in 2015. The US had 2,173,800 prisoners in adult facilities in 2015. That means the US held 21.0% of the world's prisoners in 2015, even though the US represented only around 4.4 percent of the world's population in 2015. In 2015 the US had the 2nd highest incarceration rate (698), behind the Seychelles rate of 799 per 100,000.
Decarceration in the United States involves government policies and community campaigns aimed at reducing the number of people held in custody or custodial supervision. Decarceration, the opposite of incarceration, also entails reducing the rate of imprisonment at the federal, state and municipal level. As of 2019, the US was home to 5% of the global population but 25% of its prisoners. Until the COVID-19 pandemic, the U.S. possessed the world's highest incarceration rate: 655 inmates for every 100,000 people, enough inmates to equal the populations of Philadelphia or Houston. The COVID-19 pandemic has reinvigorated the discussion surrounding decarceration as the spread of the virus poses a threat to the health of those incarcerated in prisons and detention centers where the ability to properly socially distance is limited. As a result of the push for decarceration in the wake of the pandemic, as of 2022, the incarceration rate in the United States declined to 505 per 100,000, resulting in the United States no longer having the highest incarceration rate in the world, but still remaining in the top five.
Incarceration in Oklahoma is how inmates are rehabilitated and reformed. Incarceration in Oklahoma includes state prisons and county and city jails. Oklahoma has the second highest state incarceration rate in the United States. Oklahoma is the second in women's incarceration in the United States. After becoming a state in 1907, the first prisons were opened and reform began.