
Crime in Canada is generally considered low overall. Under the Canadian constitution, the power to establish criminal law and rules of investigation is vested in the federal Parliament. The provinces share responsibility for law enforcement, and while the power to prosecute criminal offences is assigned to the federal government, responsibility for prosecutions is delegated to the provinces for most types of criminal offences. Laws and sentencing guidelines are uniform throughout the country, but provinces vary in their level of enforcement.
Crime in Washington, D.C., is directly related to the city's demographics, geography, and unique criminal justice system. The District's population reached a peak of 802,178 in 1950. Shortly after that, the city began losing residents, and by 1980 Washington had lost one-quarter of its population. The population loss to the suburbs also created a new demographic pattern, which divided affluent neighborhoods west of Rock Creek Park from the less well-off neighborhoods to the east.
Crime in St. Louis includes an overview of crime both in the city of St. Louis and in the Greater St. Louis metropolitan area. Crime in the city increased from the 1960s through the early 1990s as measured by the index crime rate, followed by a decline in crime rates through 2014. Despite decreasing crime, rates of violent crime and property crime in both the city and the metropolitan area remain higher than the national metropolitan area average. In addition, the city of St. Louis consistently has been ranked among the most dangerous cities in the United States. As of April 2017, St. Louis has the highest murder rate in America. At the end of 2017, St. Louis metropolitan had 205 murders, 159 of which were within the city limits. In 2018, the new Chief of Police, John Hayden said two-thirds (67%) of all the murders and one-half of all the assaults are concentrated in a triangular area in the north part of the city.
The municipal government of Winnipeg is represented by 15 city councillors and a mayor elected every four years.
Crime has been recorded in the United States since its founding and has fluctuated significantly over time. Crime rates have varied over time, with a sharp rise after 1900 and reaching a broad bulging peak between the 1970s and early 1990s. After 1992, crime rates have generally trended downwards each year, with the exceptions of a slight increase in property crimes in 2001 and increases in violent crimes in 2005-2006, 2014-2016 and 2020-2021. While official federal crime data beginning in 2021 has a wide margin of error due to the incomplete system adoption of the National Incident-Based Reporting System by government agencies, federal data for 2020-2021 and limited data from select U.S. cities collected by the nonpartisan Council on Criminal Justice showed significantly elevated rates of homicide and motor vehicle theft in 2020-2022. Although overall crime rates have fallen far below the peak of crime seen in the United States during the late 1980s and early 1990s, the homicide rate in the U.S. has remained high, relative to other "high income"/developed nations, with eight major U.S. cities ranked among the 50 cities with the highest homicide rate in the world in 2022. The aggregate cost of crime in the United States is significant, with an estimated value of $4.9 trillion reported in 2021. Data from the first half of 2023, from government and private sector sources show that the murder rate has dropped, as much as 12% in as many as 90 cities across the United States, however crime rates remain higher than pre-Covid-19 pandemic levels, with property crime showing an upward trend. The drop in homicide rates is not uniform across the country however, with some cities such as Memphis, TN showing an uptick in murder rates.
The following table is based on Federal Bureau of Investigation Uniform Crime Reports statistics.
The following table is based on Federal Bureau of Investigation Uniform Crime Reports statistics.
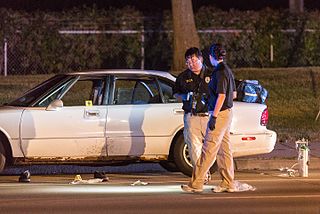
As of 2018, Detroit had the fourth highest murder rate among major cities in the United States after St. Louis and Baltimore and the 42nd highest murder rate in the world. The rate of robberies in Detroit declined by 67% between 1985 and 2014 while the rate of aggravated assaults increased. As a whole, the city's crime rate has decreased considerably from its 1980s peak.
Crime in Chicago has been tracked by the Chicago Police Department's Bureau of Records since the beginning of the 20th century. The city's overall crime rate, especially the violent crime rate, is higher than the US average. Gangs in Chicago have a role in the city's crime rate. The number of homicides in Chicago hit a 25-year high in 2021.
Crime in Atlanta, Georgia is above the national median and has been a major problem for the city since the middle 20th century.
Crime rates in Alabama overall have declined by 17% since 2005. Trends in crime within Alabama have largely been driven by a reduction in property crime by 25%. There has been a small increase in the number of violent crimes since 2005, which has seen an increase of 9% In 2020, there were 511 violent crime offenses per 100,000 population. Alabama was ranked 44th in violent crime out of a total 50 states in the United States.
This article refers to crime in the U.S. state of Louisiana.
In 2019, 43,686 crimes were reported in the U.S. state of Michigan. Crime statistics vary widely by location. For example, Dearborn has a murder rate of only 2.1 per 100,000 while sharing borders with Detroit and Inkster, some of the highest rates in the state.
Crime in Minnesota encompasses a wide range of unlawful activities that occur within the state, regulated by both state and federal laws. While crime rates in Minnesota are generally below the national average, certain areas and types of crime have garnered public attention.
Crime in Oakland, California, began to rise during the late 1960s, and by the end of the 1970s Oakland's per capita murder rate had risen to twice that of San Francisco or New York City. In 1983, the National Journal referred to Oakland as the "1983 crime capital" of the San Francisco Bay Area. Crime continued to escalate during the 1980s and 1990s, and during the first decade of the 21st century Oakland has consistently been listed as one of the most dangerous large cities in the United States.
Crime rates in Connecticut are lower than in the United States as a whole and have fallen significantly over the past decade, according to the 2021 Crime in Connecticut Report. This pattern holds true overall, and for most types of crime.
The American city of Baltimore, Maryland, is notorious for its crime rate, which ranks well above the national average. Violent crime spiked in 2015 after the death of Freddie Gray on April 19, 2015, which touched off riots and an increase in murders. The city recorded 348 homicides in 2019, a number second only to the number recorded in 1993 when the population was nearly 125,000 higher.
In 2014, the city of Memphis ranked eleventh in violent crimes for major cities around the U.S. In 2006, Memphis led the nation in number of violent crimes. In 2001, 2005, and 2007, Memphis ranked second most dangerous in the nation among cities with a population over 500,000. It also ranked as most dangerous in 2002. There are approximately 182 gangs in Memphis, Tennessee with 8,400 gang members in the county.