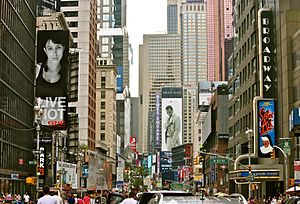
Looking down Broadway in Midtown Manhattan. As of the 2020 U.S. Census, Manhattan (New York County) was home to 74,870.7 inhabitants per square mile (28,907.7/km), rendering it the most densely populated municipality in the United States.
Sources:[1][2][3][4] and see individual borough articles.
New York County, coterminous with the New York Cityborough of Manhattan, is the most densely populated U.S. county, with a density of 70,825.6/mi2 (27,267.4/km2) as of 2013. In 1910, it reached a peak of 101,548/mi2 (39,222.9/km2). The county is one of the original counties of New York State.
According to New York City Department of City Planning's 2020 census, there were a total of 1,694,251 residents with 793,294 White residents making up 46.8%, 402,640 Hispanic residents making up 23.8%, 219,624 Asian residents making up 13.0%, and 199,592 Black residents making up 11.8%. For a long time, the Asian population in the borough had always been at the lowest ranking in the borough, but in 2020, for the first time in history, the Asian population has surpassed the Black population in the borough, meanwhile the Black population has now fallen to the lowest population ranking. The Hispanic population still makes up the largest non-white population in the borough.[9][10]
From 2010 to 2020, only the White and Asian populations and other racial group populations increased while the Hispanic and Black populations declined. Of the population gains from 2010 to 2020, the White population went from 761,493 residents at 48.0% to 793,294 residents at 46.8%, a gain of 31,801 residents or 4.2%, though because of increases from other racial groups, the White population percentage portion out of the total Manhattan population did slightly drop, the Asian population went from 177,624 residents at 11.2% to 219,624 residents at 13.0%, a gain of 42,000 or 23.6% and they contributed to the largest increase in population in the borough, Some Other Race population went from 7,882 residents at 0.5% to 16,112 residents at 1.0%, a gain of 8,230 residents or 104.4%, the multiracial population went from 29,957 residents at 1.9% to 62,989 residents at 3.7%, a gain of 33,032 residents or 110.3%. Of the population declines from 2010 to 2020, the Hispanic population went from 403,577 residents at 25.4% to 402,640 residents at 23.8% a decline of -937 residents or -0.2, though the Hispanic population decline was very minor whereas the Black population had the largest decline of all racial groups in Manhattan going from 205,340 residents at 12.9% to 199,592 residents at 11.8%, a decline of -5,748 residents or -2.8%.[11]
Demographics from the 2010 census
At the 2010 Census, there were 1,585,873 people living in Manhattan, an increase of 3.2% since 2000. Since 2010, Manhattan's population was estimated by the Census Bureau to have increased 2.5% to 1,626,159 as of 2013, representing 19.3% of the city's population and 8.3% of the state's population.[12][13]
According to the 2010 Census, 48.0% of the population was non-Hispanic White, 12.9% non-Hispanic Black or African American, 0.1% non-Hispanic American Indian and Alaska Native, 11.2% non-Hispanic Asian, 0.3% from some other race (non-Hispanic) and 1.9% of two or more races (non-Hispanic). 25.4% of Manhattan's population was of Hispanic, Latino, or Spanish origin (they may be of any race).[14]
Manhattan has the second highest percentage of non-Hispanic Whites (48%) of New York City's boroughs, after Staten Island (where non-Hispanic Whites make 64.0% of the residents).
Demographics from the 2000 census
In the 2000 census, there were 1,537,195 people, 738,644 households, and 302,105 families residing in the county. The population density was 25,859.8/km2 (66,951/mi2). There were 798,144 housing units at an average density of 13,421.8/km2 (34,756.7/mi2). The racial makeup of the county was 54.36% White (45.79% White Non-Hispanic), 9.40% Asian, 0.07% Pacific Islander, 17.39% African American, 0.50% Native American, 14.14% from other races, and 4.14% from two or more races. 27.18% of the population were Hispanic of any race. 29.43% of the population was foreign born; of this, 48.4% came from Latin America, 27.1% from Asia, 18.4% from Europe and 6.1% from other parts of the world.[15]
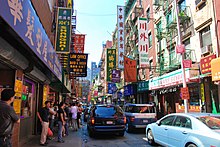
The census of 2000 showed that the neighborhoods of Lower Manhattan (i.e., Manhattan south of Houston street) had a sharply different population than the rest of the borough with 41% Asian, 32% white (non-Hispanic), 19% Hispanic, and 6% black. In addition, 43% of the inhabitants were immigrants. The high number of immigrants are related to those in Chinatown, whose population accounts for 55% of the total of Lower Manhattan. [citation needed]
2009 American community survey
Ethnic origins in Manhattan
According to the 2009 American Community Survey, White Americans made up 58.9% of Manhattan's population; non-Hispanic whites made up 50.7% of the population. Black Americans made up 15.5% of Manhattan's population; non-Hispanic blacks made up 13.0% of the population; Native Americans made up 0.3% of the population; Asian Americans made up 10.3% of the population; Multiracial Americans made up 3.4% of the population; Hispanics and Latinos made up 23.8% of Manhattan's population.[16] White Americans are the largest racial group in Manhattan; whites make up 58.9% of the borough's population. Whites of non-Hispanic origin form a slight majority, making up 50.7% of the population. Of Manhattan's 1,630,000 people, 960,000 are white, of which 825,000 are non-Hispanic whites. Manhattan's white population is ethnically heterogeneous. German Americans are the largest Euro-American ethnic group in the borough, making up 7.2% of the population. Irish Americans and Italian Americans make up 6.9% and 5.5% of the population, respectively. Russian Americans are also sizable, making up 6.2% of the populace. Americans of English descent form 5.2% of the borough's population, and Polish Americans make up 4.8% of the populace. Americans of French descent make up 1.9% of Manhattan's population, while those of Scottish descent form 1.3% of the populace. Jewish Americans, most of whom self-identify as "white" under the U.S. Census classifications, are most concentrated in the Upper West Side, Upper East Side, and Midtown regions of Manhattan.[17]
Black Americans make up 15.5% of the borough's population and are concentrated primarily in the Upper Manhattan region of Harlem. The percentage of Blacks in Manhattan has continually been on the decline since the end of World War II.[citation needed] This is in large part due to the exodus of Black residents from Harlem which peaked in population in 1950[citation needed] and the establishment of Black communities in the other boroughs such as Bedford Stuyvesant, Brooklyn, Southeast Queens, and the Northeast Bronx. Blacks of non-Hispanic origin form 13.0% of the population. Roughly 253,000 are black, of which 211,000 are non-Hispanic blacks. Roughly 27,000 residents reported their ancestry as Sub-Saharan African in the survey, which is equal to 1.6% of Manhattan's population. Included in the African descendant population in Harlem are African immigrants and Afro-Caribbeans from the West Indies. Harlem has seen a pattern of gentrification and a wave of new businesses came to the section during the 1990s and it is home of an increasingly large upper-class of all races, but the majority happen to be African-American.[18][19]
Native Americans are one of the borough's smallest ethnic minority groups. Only 5,500 individuals of the borough's 1.6 million people are Native Americans. The number of Native Americans who are of non-Hispanic origin is even smaller. Roughly 1,370 residents are Native Americans of non-Hispanic descent, which is 0.1% of the population. In addition, people who are of mixed Caucasian and Native American ancestry make up 0.2% of the population. There are a number of Mohawks indigenous to the New York city area and/or Upstate New York, and many Mohawks arrived in the 1930s to work in the skyscraper building construction industry.[20][unreliable source?]
Asian Americans are one of the borough's larger racial groups. Asians represent 10.3% of Manhattan's population. Asians of non-Hispanic origin make up 10.2% of the population. Like the Caucasian population, the Asian population is ethnically heterogeneous. Chinese Americans make up the majority of the Asian population. Of Manhattan's 168,000 Asians, some 90,000 are of Chinese descent (5.6% of the population). Roughly 21,000 residents are of Indian descent. Manhattan is home to over 16,300 Koreans, 15,200 Japanese, 11,800 Filipinos, and nearly 3,000 Vietnamese.
Pacific Islander Americans are, by far, the smallest racial minority group in Manhattan. Just over 540 people identified themselves as such. Also, just above 270 individuals are Pacific Islanders of non-Hispanic origin.
Multiracial Americans are a smaller minority group in Manhattan, but they are sizable. Nearly 55,000 multiracial individuals call Manhattan home, and they make up 3.4% of the population. People of European American and African American heritage form 1.4% of the population, and number over 22,200 individuals. In addition, people of Caucasian and Asian heritage make up 0.8% of the population, and number over 13,400 individuals. People of African American and Native American heritage make up 0.1% of the population, and they number at nearly 1,800 individuals.
Hispanic and Latino Americans are the largest ethnic minority group in Manhattan. Over 387,000 Hispanics and Latinos represent 23.8% of Manhattan's total population. Significant groups include Puerto Ricans, Dominicans and Mexicans; Puerto Ricans make up 6.7% of the population, and number over 109,000 individuals. Mexicans make up 2.7% of the population, and number over 43,000 individuals. In addition, the borough is home to over 10,000 Cubans; people of Cuban descent form 0.6% of the population. Lastly, there are over 224,000 Hispanics that are of other ethnic groups, such as Ecuadorian, Salvadoran, etc. These people collectively make up 13.8% of the population. Hispanics are numerous throughout the borough but most prominently in East Harlem, Loisada, and Washington Heights.[16][21]
Household income
There were 738,644 households, out of which 17.1% had children under the age of 18 living with them, 25.2% were married couples living together, 12.6% had a female householder with no husband present, and 59.1% were non-families. 48.0% of all households were made up of individuals, and 10.9% had someone living alone who was 65 years of age or older. The average household size was 2.00 and the average family size was 2.99.
In the county the population was spread out, with 16.8% under the age of 18, 10.2% from 18 to 24, 38.3% from 25 to 44, 22.6% from 45 to 64, and 12.2% who were 65 years of age or older. The median age was 36 years. For every 100 females there were 90.3 males. For every 100 females age 18 and over, there were 87.9 males. The largest age cohort in the county was 25–29(recent college graduates).[22]
The median income for a household in the county was $47,030, and the median income for a family was $50,229. Males had a median income of $51,856 versus $45,712 for females. The per capita income for the county was $42,922. About 17.6% of families and 20.0% of the population were below the poverty line, including 31.8% of those under age 18 and 18.9% of those age 65 or over.
Manhattan is one of the highest-income places in the United States with a population over 1,000,000. In particular the Upper East Side, ZIP Code 10021, with over 100,000 inhabitants and a per capita income of over $90,000, is one of the largest concentrations of wealth in the entire United States, although this is offset by a high cost of living[citation needed]. Like all large US cities, Manhattan does have some large enclaves of concentrated poverty.[citation needed]
Languages
As of 2010, 59.98% (902,267) of Manhattan residents age 5 and older spoke English at home as a primary language, while 23.07% (347,033) spoke Spanish, 5.33% (80,240) Chinese, 2.03% (30,567) French, 0.78% (11,776) Japanese, 0.77% (11,517) Russian, 0.72% (10,788) Korean, 0.70% (10,496) German, 0.66% (9,868) Italian, 0.64% (9,555) Hebrew, and African languages were spoken as a main language by 0.48% (7,158) of the population over the age of five. In total, 40.02% (602,058) of Manhattan's population age 5 and older spoke a mother language other than English.[23]
Religion
New York County is diverse religiously and ethnically. According to a report by The Association of Religion Data,[24] the largest religious affiliation in Manhattan is the Roman Catholic Church, whose adherents constitute 564,505 persons (more than 36% of the population) and maintain 110 congregations. Jewish-Americans comprise the second largest religious group, with 314,500 persons (around 20.5%), and have 102 congregations. Other large denominations include Protestants (139,732 adherents) and Muslims (37,078).
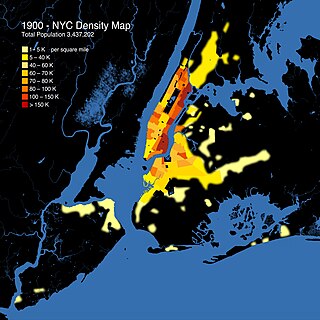
Population density
As of the 2020 census, the population density of New York County was 74,870.7 inhabitants per square mile (28,907.7/km2), the highest population density of any county in the United States.[5] In 1910, at the height of European immigration to New York, Manhattan's population density reached a peak of 101,548 peopleper square mile (39,208 people/km2).[5][13]
The Bronx is a borough of New York City, coextensive with Bronx County, in the U.S. state of New York. It is south of Westchester County; north and east of the New York City borough of Manhattan, across the Harlem River; and north of the New York City borough of Queens, across the East River. The Bronx has a land area of 42 square miles (109 km2) and a population of 1,472,654 in the 2020 census. If each borough were ranked as a city, the Bronx would rank as the ninth-most-populous in the U.S. Of the five boroughs, it has the fourth-largest area, fourth-highest population, and third-highest population density. The population density of the Bronx was 32,718.7 inhabitants per square mile (12,632.8/km2) in 2022, the third-highest population density of any county in the United States, behind Manhattan and Brooklyn. It is the only borough of New York City not primarily on an island. With a population that is 54.8% Hispanic as of 2020, it is the only majority-Hispanic county in the Northeastern United States and the fourth-most-populous nationwide.
Brooklyn is a borough of New York City. Located on the westernmost edge of Long Island, it is coextensive with Kings County in the U.S. state of New York. With 2,736,074 residents as of the 2020 United States census, Kings County is the most populous of the five boroughs of New York City and the most populous county in the State of New York. The population density of Brooklyn was 37,339.9 inhabitants per square mile (14,417.0/km2) in 2022, making it the second-most-densely-populated county in the United States, behind Manhattan, and it had the ninth-highest population of any county nationwide. If Brooklyn were an independent city, it would be the fourth most populous in the U.S. after the rest of New York City, Los Angeles, and Chicago.
Harlem is a neighborhood in Upper Manhattan, New York City. It is bounded roughly by the Hudson River on the west; the Harlem River and 155th Street on the north; Fifth Avenue on the east; and Central Park North on the south. The greater Harlem area encompasses several other neighborhoods and extends west and north to 155th Street, east to the East River, and south to Martin Luther King Jr. Boulevard, Central Park, and East 96th Street.
The United States had an official estimated resident population of 334,914,895 on July 1, 2023, according to the U.S. Census Bureau. This figure includes the 50 states and the District of Columbia but excludes the population of five unincorporated U.S. territories as well as several minor island possessions. The United States is the third most populous country in the world. The Census Bureau showed a population increase of 0.4% for the twelve-month period ending in July 2022, below the world average annual rate of 0.9%. The total fertility rate in the United States estimated for 2022 is 1.665 children per woman, which is below the replacement fertility rate of approximately 2.1.
Barbour County is a county in the southeastern part of the U.S. state of Alabama. As of the 2020 census, the population was 25,223. Its county seat is Clayton. Its largest city is Eufaula. Its name is in honor of James Barbour, who served as Governor of Virginia.
New York City is a large and ethnically diverse metropolis. It is the largest city in the United States with a long history of international immigration. The New York region continues to be by far the leading metropolitan gateway for legal immigrants admitted into the United States. The city is the geographical and demographic center of both the Northeast megalopolis and the New York metropolitan area, the largest metropolitan area in the U.S. by both population and urban area. With over 20.1 million people in its metropolitan statistical area and 23.5 million in its combined statistical area as of 2020, New York City is one of the world's most populous megacities.
Chicago's demographics show that it is a large, and ethnically and culturally diverse metropolis. It is the third largest city and metropolitan area in the United States by population. Chicago was home to over 2.7 million people in 2020, accounting for over 25% of the population in the Chicago metropolitan area, home to approximately 9.6 million.
Atlanta is the capital and largest city in the state of Georgia. Atlanta ranks as the 38th-largest in the United States, and the sixth-largest city in the southeastern region. 2010 census results varied dramatically with previous Census Bureau estimates, counting 420,003 residents. Atlanta is the core city of the ninth most populous United States metropolitan area at 5,268,860, with a combined statistical area of 5,626,400. A 2015 article, written by Nate Silver of fivethirtyeight.com, found that Atlanta was the second most segregated city in the U.S.
The demographics of Brooklyn reveal a very diverse borough of New York City and a melting pot for many cultures, like the city itself. Since 2010, the population of Brooklyn was estimated by the Census Bureau to have increased 3.5% to 2,592,149 as of 2013, representing 30.8% of New York City's population, 33.5% of Long Island's population, and 13.2% of New York State's population. If the boroughs of New York City were separate cities, Brooklyn would be the third largest city in the United States after Los Angeles and Chicago.
The demographics of Queens, the second-most populous borough in New York City, are highly diverse. No racial or ethnic group holds a majority in the borough.
The demographics of the Bronx are characterized by a Hispanic majority and by the lowest percentage of Whites among all boroughs.
Richmond County, also known as Staten Island is a borough of New York City, New York, United States. Staten Island is the least populated of the five boroughs with 475,000 people but is the third largest in area at 59 sq mi (153 km2).
According to the U.S. Census Bureau, as of 2023, Texas was the second largest state in population after California, with a population of 30,503,301, an increase of more than 1.3 million people, or 4.7%, since the 29,145,505 of the 2020 census. Its apportioned population in 2020 was 29,183,290. Since the beginning of the 21st century, the state of Texas has experienced strong population growth. Texas has many major cities and metropolitan areas, along with many towns and rural areas. Much of the population is concentrated in the major cities of Dallas–Fort Worth, Austin, San Antonio, Houston, McAllen, and El Paso and their corresponding metropolitan areas. The first four aforementioned main urban centers are also referred to as the Texas Triangle megaregion.
According to the U.S. Census Bureau, as of 2023, New York was the fourth largest state in population after California, Texas, and Florida, with a population of 19,571,216, a decrease of over 600,000 people, or −3.1%, since the 2020 census. The population change between 2000–2006 includes a natural increase of 601,779 people and a decrease due to net migration of 422,481 people out of the state. Immigration from outside the United States resulted in a net increase of 820,388 people, and migration within the country produced a net loss of about 800,213.
Florida is the third-most populous state in the United States. Its residents include people from a wide variety of ethnic, racial, national and religious backgrounds. The state has attracted immigrants, particularly from Latin America. Florida's majority ethnic group are European Americans, with approximately 65% of the population identifying as White. National ethnic communities in the state include Cubans, who migrated en masse following the revolution in the mid 20th century. They have been joined by other immigrants from Latin America, and Spanish is spoken by more than 20% of the state's population, with high usage especially in the Miami-Dade County area.
As of the 2020 United States census, Arizona had a population of 7,151,502.
Non-Hispanic Whites, Non-Latino Whites, or more simply White Americans, are Americans classified by the United States census as "white" and are not of Hispanic ethnicity. According to the United States Census Bureau yearly estimates, as of July 1, 2022, Non-Hispanic whites make up about 59.3% of the U.S. population, or 197,639,521 people. The United States Census Bureau defines white to include European Americans, Middle Eastern Americans, and North African Americans. Americans of European ancestry are divided into various ethnic groups. More than half of the white population are German, Irish, English, Italian, French and Polish Americans. Many Americans are also the product of other European groups that migrated to parts of the US in the 19th and 20th centuries, as the bulk of immigrants from various countries in Northern, Central, Eastern, and Southeastern Europe, as well as the Caucasus region, migrated to the United States.
The racial and ethnic history of New York City has varied widely; from its sale to the Dutch by Native American residents, to the modern multi-cultural period.
The 2020 United States Census reported that San Francisco had a population of 815,201—an increase from the 2010 Census count of 805,235. With a population density of 18,633 per square mile (7,194/km2), San Francisco is the second-most densely populated major American city, behind only New York.
As according to the New York City Department of City Planning, there were a total of 8,804,190 residents. There were almost equivalent populations of 2,719,856 White residents at 30.9% and 2,490,350 Hispanic residents at 28.3%, meanwhile there were 1,776,891 Black residents at 20.2% and 1,373,502 Asian residents at 15.6%. There were even much smaller numbers of 143,632 other race residents at 1.6% and 299,959 Two or More races residents at 3.4%. The White population declined mainly in Queens, The Bronx, and then Staten Island, though the White population increased marginally in Brooklyn and then Manhattan. The Black population experienced declines by Brooklyn, Queens, and Manhattan, increasing marginally in the Bronx and Staten Island. The Hispanic population increased in the Bronx, Queens, Brooklyn, and Staten Island, but experienced decline in Manhattan. The Asian population increased in all five boroughs.
This page is based on this Wikipedia article Text is available under the CC BY-SA 4.0 license; additional terms may apply. Images, videos and audio are available under their respective licenses.