This article is about the demographics of the People's Republic of China. For the demographics of the Republic of China (Taiwan), see Demographics of Taiwan.
In 2025, China's population officially stood at 1.404billion, which was three million less than the previous year, with the lowest recorded birthrate since at least the proclamation of the People's Republic of China in 1949.[9] China's population has a relatively small youth component, partially a result of the strict enforcement of China's one-child policy that was in effect from 1979 until 2015, which limited urban families to one child and rural families to two. As of 2022[update], Chinese state media reported the country's total fertility rate to be 1.09, one of the lowest in the world alongside South Korea, Taiwan, Hong Kong and Singapore.[10] Since 2022, deaths have outstripped births in the country.[9]
China faces the challenge of an aging population due to increased life expectancy and declining birth rates.[16] This demographic shift has implications for social services and the labor force.[16]
Historical population in China from 400 BCHistorical population of India and China since 1100 with projection to 2100 (Outdated, early 2022 projections)
During 1960–2015, the population grew to nearly 1.4billion. Under Mao Zedong, China nearly doubled in population from 540 million in 1949 to 969million in 1979. This growth slowed because of the one-child policy instituted in 1979.[17] The 2022 data shows a declining population for the first time since 1961.[18]
China's population reached 1billion in 1982, making it the first country to reach this milestone.[19]
The People's Republic of China conducted censuses in 1953, 1964, 1982, 1990, 2000, 2010, and 2020. In 1987, the government announced that the fourth national census would take place in 1990 and that there would be one every ten years thereafter. The 1982 census (which reported a total population of 1,008,180,738) is generally accepted as significantly more reliable, accurate, and thorough than the previous two.[20] Various international organizations eagerly assisted the Chinese in conducting the 1982 census, including the United Nations Fund for Population Activities, which donated US$100.0million between 1980 and 1989 for a variety of projects, one of which being the 1982 census.[21]
China was the world's most populous nation until being surpassed by India in 2023.[22]
By the seventh census in 2020, the total population had reached to 1,419,933,142, with the mainland having 1,411,778,724, Hong Kong having 7,474,200, and Macau having 683,218. However, this number is disputed by obstetrics researcher Yi Fuxian, who argues that data related to population growth is inflated by local governments to obtain financial subsidies from the central government.[23]
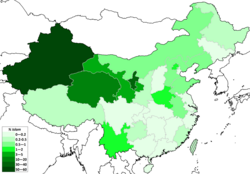
Population density and distribution
Population density in the year 2000General topographic map of the most populous part of China, as per 2024 (Click to enlarge)
China is the second most populous country in the world and its national population density (137/km2) is very similar to those of countries like Denmark (excluding Greenland) or the Czech Republic. However, the overall population density of China contains major regional variations. In 2002, about 94% of the population lived east of the Heihe–Tengchong Line; although this eastern area comprises only 43% of China's total land area, its population density, at roughly 280/km2, is comparable to that of Japan.[24]
Population is most sparse in the mountainous, desert, and grassland regions of the northwest and southwest. In the Inner Mongolia Autonomous Region, portions are completely uninhabited, and only a few sections have populations denser than ten people per km2. The Inner Mongolia, Xinjiang, and Tibet autonomous regions and Qinghai and Gansu comprise 55% of the country's land area but in 1985 contained only 5.7% of its population.
Population with permanent residence difficult to define
4,649,985
Total China
582,603,417
694,581,759
1,008,175,288
1,133,682,501
1,265,830,000
1,339,724,852
1,411,778,724
Structure of the population
Census population of China by age and sex:
China population pyramid as of 1st National Census day on June 30, 1953
China population pyramid as of 2nd National Census day on July 1, 1964
China population pyramid as of 3rd National Census day on July 1, 1982
China population pyramid as of 4th National Census day on July 1, 1990
China population pyramid as of 5th National Census day on November 1, 2000
China population pyramid as of 6th National Census day on November 1, 2010
China population pyramid as of 7th National Census day on November 1, 2020
China population pyramid as projected of 8th National Census day on November 1, 2030, in scenario of constant TFR at 2021 level and continued improvements in mortality
Population by Sex and Age Group (as of 1 November 2010). For statistical purposes, the data for China do not include those for Hong Kong and Macau. Data exclude 2.3million servicemen, 4.65million persons with permanent resident status difficult to define, and 0.12 per cent undercount based on the post enumeration survey:[28]
Initially, China's post-1949 leaders were ideologically disposed to view a large population as an asset. But soon afterwards, the leaders changed course. For one year, starting in August 1956, vigorous support was given to the Ministry of Public Health's mass birth control efforts. These efforts, however, had little impact on fertility. After the interval of the Great Leap Forward, Chinese leaders again saw rapid population growth as an obstacle to development, and their interest in birth control revived. In the early 1960s, schemes somewhat more muted than during the first campaign, emphasized the virtues of late marriage. Birth control offices were set up in the central government and some provincial-level governments in 1964. The second campaign was particularly successful in the cities, where the birth rate was cut in half during the 1963–66 period.[citation needed]
The one-child policy enjoyed much greater success in urban than in rural areas. Even without state intervention, there were compelling reasons for urban couples to limit the family to a single child. Raising a child required a significant portion of family income, and in the cities a child did not become an economic asset until he or she entered the work force at age sixteen. Couples with only one child were given preferential treatment in housing allocation. In addition, because city dwellers who were employed in state enterprises received pensions after retirement, the sex of their first child was less important to them than it was to those in rural areas.[31]
Observers suggested that an accurate assessment of the one-child program would not be possible until all women who came of childbearing age in the early 1980s passed their fertile years. As of 1987 the one-child program had achieved mixed results. In general, it was very successful in almost all urban areas but less successful in rural areas.[32]
Rapid fertility reduction associated with the one-child policy has potentially negative results. For instance, in the future the elderly might not be able to rely on their children to care for them as they have in the past, leaving the state to assume the expense, which could be considerable. Based on United Nations and Chinese government statistics, it was estimated in 1987 that by 2000 the population 60 years and older (the retirement age is 60 in urban areas) would number 127 million, or 10.1% of the total population; the projection for 2025 was 234million elderly, or 16.4%. According to projections based on the 1982 census, if the one-child policy were maintained to the year 2000, 25% of China's population would be age 65 or older by 2040. In 2050, the number of people over 60 is expected to increase to 430million.[33] Even though China has already opened two-child policy since 2016, data shows that the second-child policy cannotstopthe problem of an aging population. China needs to find an appropriate birth policy to optimize the demographic dividend, which refers to the proportion of labor-age population.[34] On the other hand, higher house prices plays an important role on the influence of marriage and fertility. The increasing house prices leads to lower marriage rates and cause other serious social problems in China.[35]
In 2024, United Nations researchers forecast China's population to fall to 639million by 2100.[36] The same year, researchers from Victoria University and the Shanghai Academy of Social Sciences forecast that China's population will fall to approximately 525million by 2100 at current rates.[37][36] This revision, reducing the population estimate to 525 million from a previous forecast of 597million by 2100, indicates a sharper decline than previously anticipated.[37] Demographer Yi Fuxian estimated that China's population may fall to as low as 330 million by 2100.[38]
Pro-natalist policies
In the 2020s, pro-natalist policies have been put in place to encourage people to have more children.[39] Specific policies have included lengthening of paid maternity leave, cash payments to mothers in some regions who have their second and third children,[40][41] government-provided children's clothing and toys, increased child allowances, reduced taxes, government-subsidized fertility and pregnancy treatment,[42] and new childcare facilities.[43]:163 Local government family-planning committees, previously used to enforce the one-child policy, are deployed for pro-natalist policies such as calling women to check on their menstrual cycle.[44][41][45]
In July 2025, China announced an annual childcare subsidy of 3,600 yuan (about $500) until age three; this subsidy is estimated to impact about 20 million families.[46][47] In December 2025, China announced an end to the value-add tax exemption on contraceptives[48] and reimbursement for out-of-pocket childbirth expenses.[49] In February 2026, the Cyberspace Administration of China mandated that social media platforms censor content deemed as spreading "fear of marriage" or "anxiety about childbirth."[50]
The 2010 census reported a TFR of 1.18 (0.88 in cities, 1.15 in townships, and 1.44 in rural areas).[58] The five regions with the lowest fertility rates were Beijing (0.71), Shanghai (0.74), Liaoning (0.74), Heilongjiang (0.75), and Jilin (0.76). The five regions with the highest fertility rates were Guangxi (1.79), Guizhou (1.75), Xinjiang (1.53), Hainan (1.51), and Anhui (1.48).[58]
The 2020 census reported a TFR of 1.301, with 1.118 in cities, 1.395 in townships, and 1.543 in rural areas.[59] The shift of fertility rate recorded in 2020 census compared to that in the previous 2 censuses may not be an actual recovery, but rather due to the low quality and massive underreporting of lower-age groups in the 2000 and 2010 censuses, while the population control policy in China back then may also give families an incentive to hide their children, which is largely relieved as the policy changed in 2010s. This can be demonstrated by the much lower number of population aged 0~4 and 5~9 in the 2000 and 2010 censuses[60][61] when compared to the corresponding age groups in 2020.[62]
In 2025, China's population decreased by 3.39 million, with 7.92 million births outpaced by 11.31 million deaths. The country's population stands at 1.4 billion, still the world's second-largest after India. The birth rate fell to 5.63 births per 1,000 people, down from 6.39 in 2023, continuing a steady decline since 2016. Despite a slight uptick in 2024, the trend suggests no reversal. The decline follows years of strict "one-child" policy until its end in 2016 and mirrors patterns seen in other countries like Japan and South Korea, where rising education levels, changing attitudes toward marriage, urbanization, and high child-rearing costs contribute to falling birth rates.[64]
Beginning in the early 1950s, mortality steadily declined; it continued to decline through 1978 and remained relatively constant through 1987. One major fluctuation was reported in a computer reconstruction of China's population trends from 1953 to 1987 produced by the United States Bureau of the Census. The computer model showed that the crude death rate increased dramatically during the famine years associated with the Great Leap Forward (1958–60).[68]
China exhibits a serious gender imbalance. Census data obtained in 2000 revealed that 119 boys were born for every 100 girls, and among China's "floating population" the ratio was as high as 128:100. These situations led the government in July 2004 to ban selective abortions of female fetuses. It is estimated[by whom?] that this imbalance will rise until 2025–2030 to reach 20% then slowly decrease.[69]
In the 2020s, cash incentives have been offered to increase birth rates.[70][71] Local government family-planning committees, previously used to enforce the one-child policy, are deployed for pro-natalist policies such as calling women to check on their menstrual cycle.[72][71][73]
Censorship of data
Although the National Bureau of Statistics of China reported 9.02million births in 2023,[74] the state-owned Mother and Infant Daily newspaper reported there were 7.88million births for the same year.[75] The report was promptly censored following publication.[75]
Labor force
In 2012, for the first time, according to the National Bureau of Statistics in January 2013, the number of people theoretically able to enter the Chinese labor force (individuals aged 15 to 59), shrank slightly to 937.27million, a decrease of 3.45million from 2011. This trend, resulting from a demographic transition, is anticipated to continue until at least 2030.[76] The World Factbook estimated the 2019 active labor force was 774.71million.[77]
Height and weight
As of 2020, the average Chinese man was 169.7 centimeters (5feet 6.8inches) tall in 2019, the figures showed, and women's average height was 158 centimeters (5ft 2in). The same study showed an average Chinese man weighed 69.6 kilograms (153lb; 10st 13lb), up 3.4 kilograms (7.5lb) over 10 years, while women were 1.7 kilograms (3.7lb) heavier on average at 59 kilograms (130lb; 9st 4lb). They were up 1.2 and 0.8 centimeters (0.47 and 0.31in) respectively from 5 years earlier.[78]
Gender balance
Future challenges for China will be the gender disparity. According to the 2020 census, males account for 51.24% of China's 1.41billion people, while females made up 48.76% of the total. The sex ratio (the number of males for each female in a population) at birth was 118.06 boys to every 100 girls (54.14%) in 2010, higher than the 116.86 (53.89%) of 2000, but 0.53 points lower than the ratio of 118.59 (54.25%) in 2005.[79]
The People's Republic of China (PRC) officially recognizes 56 distinct ethnic groups, the largest of which are Han, who constitute 91.51% of the total population in 2010. Ethnic minorities constitute 8.49% or 113.8million of China's population in 2010. During the past decades ethnic minorities have experienced higher growth rates than the majority Han population, because they are not under the one-child policy. Their proportion of the population in China has grown from 6.1% in 1953, to 8.04% in 1990, 8.41% in 2000, and 8.49% in 2010. Large ethnic minorities (data according to the 2000 census) include the Zhuang (16million, 1.28%), Manchu (10million, 0.84%), Uyghur (9million, 0.78%), Hui (9million, 0.71%), Miao (8million, 0.71%), Yi (7million, 0.61%), Tujia (5.75million, 0.63%), Mongols (5million, 0.46%), Tibetan (5million, 0.43%), Buyei (3million, 0.23%), and Korean (2million, 0.15%). Over 126,000 Westerners from Canada, the US and Europe are living in mainland China.[80]
Population of China according to ethnic group in censuses 1953–2020[26]
Neither Hong Kong nor Macau recognizes the official ethnic classifications maintained by the central government. In Macau, the largest substantial ethnic groups of non-Chinese descent are the Macanese, of mixed Chinese and Portuguese descent (Eurasians), as well as migrants from the Philippines and Thailand. Overseas Filipinos (overwhelmingly female) working as domestic workers comprise the largest non-Han Chinese ethnic group in Hong Kong.[citation needed]
The 2020 Census counted 371,380 residents from Hong Kong, 55,732 residents from Macau, 157,886 residents from Taiwan, and 845,697 residents from other locations, totaling 1,430,695 residents.[84][85]
China’s immigration policy, governed by the 2012 Exit-Entry Law, focuses on strict, merit-based, and security-driven controls, actively discouraging low-skilled immigration while restricting long-term permanent residency for most foreigners.[110] In 2004, a system was introduced allowing immigrants to obtain permanent residence; however, its implementation has been carried out on a case-by-case basis. Between 2004 and 2023, approximately 12,000 individuals were granted this status. Naturalization rates have been even lower.[111]
Internal migration in the People's Republic of China is one of the most extensive in the world according to the International Labour Organization.[112] In fact, research done by Kam Wing Chan of the University of Washington suggests that "In the 30 years since 1979, China's urban population has grown by about 440 million to 622million in 2009. Of the 440million increase, about 340million was attributable to net migration and urban reclassification. Even if only half of that increase was migration, the volume of rural-urban migration in such a short period is likely the largest in human history."[113] Migrants in China are commonly members of a floating population, which refers primarily to migrants in China without local household registration status through the Chinese Hukou system.[114] In general, rural-urban migrant workers are most excluded from local educational resources, citywide social welfare programs and many jobs because of their lack of hukou status.[115]
In 2011 a total of 252.78million migrant workers (an increase of 4.4% compared to 2010) existed in China. Out of these, migrant workers who left their hometown and worked in other provinces accounted for 158.63million (an increase of 3.4% compared to 2010) and migrant workers who worked within their home provinces reached 94.15million (an increase of 5.9% compared to 2010).[116] Estimations are that Chinese cities will face an influx of another 243 million migrants by 2025, taking the urban population up to nearly 1billion people.[117] This population of migrants would represent "almost 40 percent of the total urban population," a number which is almost three times the current level.[117][118] While it is often difficult to collect accurate statistical data on migrant floating populations, the number of migrants is undoubtedly quite large. "In China's largest cities, for instance, it is often quoted that at least one out of every five persons is a migrant."[119] China's government influences the pattern of urbanization through the Hukou permanent residence registration system, land-sale policies, infrastructure investment and the incentives offered to local government officials. The other factors influencing migration of people from rural provincial areas to large cities are employment, education, business opportunities and higher standard of living.[120]
The mass emigration known as the Chinese diaspora,[121] which occurred from the 19th century to 1949, was mainly caused by wars and starvation in mainland China, invasion from various foreign countries, as well as the problems resulting from political corruption. Most immigrants were illiterate peasants and manual labourers, called "coolies" by analogy to the same pattern of immigration from India, who emigrated to work in countries such as the Americas, Australia, South Africa and Southeast Asia.[citation needed]
↑The statistics for Chinese ancestorism, that is the worship of ancestor-gods within the lineage system, are from the Chinese Spiritual Life Survey of 2010.[86] The statistics for Buddhism and Christianity are from the China Family Panel Studies survey of 2012.[87] The statistics for Islam are from a survey conducted in 2010.[88] It is worthwhile to note that the populations of Chinese ancestorism and Buddhism may overlap, even with the large remaining parts of the population whose belief is not documented in the table. The latter, the uncharted population, may practise other forms of Chinese religion, such as the worship of gods, Taoism, Confucianism and folk salvationisms, or may be atheist. Indeed, according to the CFPS 2012, only 6.3% of the Chinese were irreligious in the sense of "atheism", while the rest practised the worship of gods and ancestors.[89]:13
↑Chinese ancestral or lineage religion is the worship of kin's ancestor-gods in the system of lineage churches and ancestral shrines. It is worthwhile to note that this does not include other forms of Chinese religion, such as the worship of national ancestral gods or the gods of nature (which in northern China is more common than ancestor worship), and Taoism and Confucianism.
↑Historical record and contemporary scholarly fieldwork testify certain central and northern provinces of China as hotbeds of folk religious sects and Confucian religious groups.
↑The map represents the geographic diffusion of the tradition of folk religious movements of salvation, Confucian churches and jiaohua ("transformative teachings") movements, based on historical data and contemporary fieldwork. Due to incomplete data and ambiguous identity of many of these traditions the map may not be completely accurate. Sources include a World Religion Map from Harvard University, based on data from the World Religion Database, showing highly unprecise ranges of Chinese folk (salvationist) religions' membership by province. Another source, the studies of China's Regional Religious System, find "very high activity of popular religion and secret societies and low Buddhist presence in northern regions, while very high Buddhist presence in the southeast".[96][note 4]
Hebei: Fieldwork by Thomas David Dubois[97] testifies the dominance of folk religious movements, specifically the Church of the Heaven and the Earth and the Church of the Highest Supreme, since their "energetic revival since the 1970s" (p.13), in the religious life of the counties of Hebei. Religious life in rural Hebei is also characterised by a type of organisation called the benevolent churches and the salvationist movement known as Zailiism has returned active since the 1990s.
Henan: According to Heberer and Jakobi (2000)[98] Henan has been for centuries a hub of folk religious sects (p.7) that constitute significant focuses of the religious life of the province. Sects present in the region include the Baguadao or Tianli ("Order of Heaven") sect, the Dadaohui, the Tianxianmiaodao, the Yiguandao, and many others. Henan also has a strong popular Confucian orientation (p. 5).
Northeast China: According to official records by the then-government, the Universal Church of the Way and its Virtue or Morality Society had 8 million members in Manchuria, or northeast China in the 1930s, making up about 25% of the total population of the area (note that the state of Manchuria also included the eastern end of modern-day Inner Mongolia).[99] Folk religious movements of a Confucian nature, or Confucian churches, were in fact very successful in the northeast.
Shandong: The province is traditionally a stronghold of Confucianism and is the area of origin of many folk religious sects and Confucian churches of the modern period, including the Universal Church of the Way and its Virtue, the Way of the Return to the One (皈依道 Guīyīdào), the Way of Unity (一貫道 Yīguàndào), and others. Alex Payette (2016) testifies the rapid growth of Confucian groups in the province in the 2010s.[100]
According to the Chinese General Social Survey of 2012,[101] about 2.2% of the total population of China (around 30 million people) claims membership in the folk religious sects, which have likely maintained their historical dominance in central-northern and northeastern China.
↑Wu, Xiaogang; He, Guangye (2015). "The Evolution of Population Census Undertakings in China, 1953?2010". China Review. 15 (1): 171–206. ISSN1680-2012. JSTOR24291933.
↑Kaufman, Joan (March 2011). "China Case Study on UNFPA"(PDF). Center for Global Development. p.19. Archived(PDF) from the original on 26 December 2020.
↑"中国人口连续三年下降 去年减少139万人"[China's population has declined for three consecutive years, with a decrease of 1.39 million people last year]. Lianhe Zaobao. 17 January 2025. Retrieved 18 January 2025.
↑Mesa-Lago, Carmelo (2025). Comparing Socialist Approaches: Economics and Social Security in Cuba, China, and Vietnam. Pitt Latin American Series. Pittsburgh, PA: University of Pittsburgh Press. ISBN9780822948476.
↑Team, Discuz! Team and Comsenz UI. "科学网—2010年人口普查各民族人口数据 - 易富贤的博文". blog.sciencenet.cn. Archived from the original on 31 August 2017. Retrieved 31 August 2017.
↑Jamil Anderliniin; Ed Crooks (19 January 2013). "Chinese Labor Pool Begins to Drain". CNBC. Financial Times. Archived from the original on 28 March 2013. Retrieved 8 February 2013.
12China Family Panel Studies 2012. Reported and compared with Chinese General Social Survey (CGSS) 2006, 2008, 2010 and 2011 in Lu 卢, Yunfeng 云峰 (2014). "卢云峰:当代中国宗教状况报告——基于CFPS(2012)调查数据"[Report on Religions in Contemporary China – Based on CFPS (2012) Survey Data](PDF). World Religious Cultures (1). Archived from the original(PDF) on 9 August 2014. Retrieved 13 June 2018.
↑Lai, Hongyi (2016). China's Governance Model: Flexibility and Durability of Pragmatic Authoritarianism. Routledge. ISBN978-1317859529. p. 167.
↑"Internazional Religious Freedom Report 2012"(PDF). US Government. Archived(PDF) from the original on 28 March 2017. Retrieved 23 May 2019. p. 20, quoting: "Most ethnic Tibetans practice Tibetan Buddhism, although a sizeable minority practices Bon, an indigenous religion, and very small minorities practice Islam, Catholicism, or Protestantism. Some scholars estimate that there are as many as 400,000 Bon followers across the Tibetan Plateau. Scholars also estimate that there are up to 5,000 ethnic Tibetan Muslims and 700 ethnic Tibetan Catholics in the TAR".
12For China Family Panel Studies 2014 survey results see release #1Archived 27 April 2017 at the Wayback Machine (archived) and release #2Archived 25 February 2017 at the Wayback Machine (). The tables also contain the results of CFPS 2012 (sample 20,035) and Chinese General Social Survey (CGSS) results for 2006, 2008 and 2010 (samples ~10.000/11,000). Also see, for comparison CFPS 2012 data in Lu 卢, Yunfeng 云峰 (2014). "卢云峰:当代中国宗教状况报告——基于CFPS(2012)调查数据"[Report on Religions in Contemporary China – Based on CFPS (2012) Survey Data](PDF). World Religious Cultures (1). Archived from the original(PDF) on 9 August 2014. Retrieved 13 June 2018. p. 13, reporting the results of the CGSS 2006, 2008, 2010 and 2011, and their average (fifth column of the first table).
↑Lu 卢, Yunfeng 云峰 (2014). "卢云峰:当代中国宗教状况报告——基于CFPS(2012)调查数据"[Report on Religions in Contemporary China – Based on CFPS (2012) Survey Data](PDF). World Religious Cultures (1): 13. Archived from the original(PDF) on 9 August 2014. Retrieved 13 June 2018. The report compares the data of the China Family Panel Studies 2012 with those of the Renmin University's Chinese General Social Survey (CGSS) of the years 2006, 2008, 2010 and 2011.
↑"Taoism in China" (Map). Taoism's incidence by province of China. Archived from the original on 27 April 2017. The map illustrates local religion led by Taoist specialists, forms and institutions.
↑Yao, Xinzhong (May 2007). "Religious Belief and Practice in Urban China 1995-2005". Journal of Contemporary Religion. 22 (2): 169–185. doi:10.1080/13537900701331031. S2CID144500936. pp. 169-185.
12China Family Panel Studies 2012. Reported and compared with Chinese General Social Survey (CGSS) 2006, 2008, 2010 and 2011 in Lu 卢, Yunfeng 云峰 (2014). "卢云峰:当代中国宗教状况报告——基于CFPS(2012)调查数据"[Report on Religions in Contemporary China – Based on CFPS (2012) Survey Data](PDF). World Religious Cultures (1). Archived from the original(PDF) on 9 August 2014.
↑Sun, Shangyang; Li, Ding. "Chinese Traditional Culture Study Fever, Scarcity of Meaning and the Trend of University Students' Attitudes towards Religions: A Survey in Beijing". Journal of Sino-Western Studies (2011): 53–68.
↑Yang, Fenggang; Tamney, Joseph (2011). Confucianism and Spiritual Traditions in Modern China and Beyond. Brill. ISBN978-9004212398.. p. 67.
↑"Labour migration". International Labour Organization. Archived from the original on 14 May 2021. Retrieved 20 October 2013.
↑Chan, Kam Wing; Peter Bellwood (2011). "China, Internal Migration"(PDF). In Immanuel Ness (ed.). The Encyclopedia of Global Migration. Blackwell Publishing. pp.1–46. Archived from the original(PDF) on 4 March 2016. Retrieved 20 October 2013.
↑Liang, Zai; Zhongdong Ma (2004). "China's floating population: new evidence from the 2000 census". Population and Development Review. 30 (3): 467–488. doi:10.1111/j.1728-4457.2004.00024.x.
↑Woetzel, Jonathan; Lenny Mendonca; Janamitra Devan; Stefano Negri; Yangmei Hu; Luke Jordan; Xiujun Li; Alexander Maasry; Geoff Tsen; Flora Yu (March 2009), Preparing for China's urban billion, McKinsey Global Institute, archived from the original on 5 October 2015, retrieved 21 September 2015
↑Wang, Feng; Xuejin Zuo (May 1999). "Inside China's Cities: Institutional Barriers and Opportunities for Urban Migrants". The American Economic Review. 89 (2): 276–280. doi:10.1257/aer.89.2.276. JSTOR117120.
↑Griffiths, Michael. B. (2010) 'Lamb Buddha's Migrant Workers: Self-assertion on China's Urban Fringe'. Journal of Current Chinese Affairs (China Aktuell), 39, 2, 3–37.
This page is based on this Wikipedia article Text is available under the CC BY-SA 4.0 license; additional terms may apply. Images, videos and audio are available under their respective licenses.


