This article needs to be updated. Please help update this article to reflect recent events or newly available information.(April 2024)
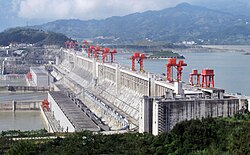
Most energy in China comes from coalDevelopment of carbon dioxide emissions in ChinaThe 22,500 MWThree Gorges Dam hydroelectric power plant in China, the largest hydroelectric power station in the world.
CO2 emission per year per country (2017 data)Consumption-based CO2 emission per capita per year per country (2016 data)
Between 1980 and 2000, China's emissions density (its ratio of carbon dioxide equivalent emissions to gross domestic product) declined sharply.[4]:26 The country quadrupled its GDP while only doubling the energy it consumed.[4]:26 No other country at a similar stage of industrial development has matched this achievement.[4]:26
On June 19, 2007, the Netherlands Environmental Assessment Agency announced that a preliminary study had indicated that China's greenhouse gas emissions for 2006 had exceeded those of the United States for the first time. The agency calculated that China's CO2 emissions from fossil fuels increased by 9% in 2006, while those of the United States fell by 1.4%, compared to 2005.[5] The study used energy and cement production data from BP which they believed to be 'reasonably accurate', while warning that statistics for rapidly changing economies such as China are less reliable than data on OECD countries.[6]
The Initial National Communication on Climate Change of the People's Republic of China calculated that carbon dioxide emissions in 2004 had risen to approximately 5.05billion metric tons, with total greenhouse gas emissions reaching about 6.1billion metric tons carbon dioxide equivalent.[7]
In 2002, China ranked 2nd (after the United States) in the list of countries by carbon dioxide emissions, with emissions of 3.3billion metric tons, representing 14.5% of the world total.[8] In 2006, China overtook the US, producing 8% more emissions than the US to become the world's largest emitter of CO2 emissions.[9] However per capita China was ranked 51st in CO2 emissions per capita in 2016, with emissions of 7.2 tonnes per person (compared to 15.5 tonnes per person in the United States).[10] In addition, it has been estimated that around a third of China's carbon emissions in 2005 were due to manufacturing exported goods.[11]
Energy use and carbon emissions by sector
In the industrial sector, six industries – electricity generation, steel, non-ferrous metals, construction materials, oil processing and chemicals – account for nearly 70% of energy use.[12]
In the construction materials sector, China produced about 44% of the world's cement in 2006.[6] Cement production produces more carbon emissions than any other industrial process, accounting for around 4% of global carbon emissions.[6] By 2023 most of its installed electricity capacity came from renewable energy.[13]
National Action Plan on Climate Change
China has been taking action on climate change for some years, with the publication on June 4, 2007, of China's first National Action Plan on Climate Change,[14] and in that year China became the first developing country to publish a national strategy addressing global warming.[15] The plan did not include targets for carbon dioxide emission reductions, but it has been estimated that, if fully implemented, China's annual emissions of greenhouse gases would be reduced by 1.5billion tons of carbon dioxide equivalent by 2010.[15] Other commentators, however, put the figure at 0.950billion metric tons.[16]
The publication of the strategy was officially announced during a meeting of the State Council, which called on governments and all sectors of the economy to implement the plan, and for the launch of a public environmental protection awareness campaign.[17]
In 2007 China stated that the (now reversed) one-child policy prevented 300 million births, saving 1.3billion tons of CO2 emissions based on average world per capita emissions of 4.2 tons at 2005 level.[19]
11th Five-Year Plan
Beginning with the 11th, each of China's five year plans have sought to move China away from energy-intensive manufacturing and into high-value sectors and have highlighted the importance of low-carbon technology as a strategic emerging industry, particularly in the areas of wind and solar power.[4]:26–27 The plan set a national energy intensity target.[4]:54 of a 20% reduction.[20]:167 It was identified as a "binding target" and focused on throughout the Plan's implementation.[20]:167Policymakers viewed emissions reductions and energy conservation as the highest priority environmental matters under the 11th Five-Year Plan.[20]:136
12th Five-Year Plan
Successful achievement of emissions and energy conservation targets[which?] in the 11th Five-Year Plan shaped policymaker's approach for the 12th Five-Year Plan, prompting expanded use of binding targets to capitalize on successes in these areas.[20]:136
In January 2012, as part of its 12th Five-year Plan, China published a report 12th Five-year Plan on Greenhouse Emission Control (guofa [2011] No. 41), which establishes goals of reducing carbon intensity by 17% by 2015, compared with 2010 levels and raising energy consumption intensity by 16%, relative to GDP.[21] More demanding targets were set for the most developed regions and those with most heavy industry, including Guangdong, Shanghai, Jiangsu, Zhejiang and Tianjin.[21] China also planned to meet 11.4% of its primary energy requirements from non-fossil sources by 2015.[21]
To facilitate carbon trading and to more broadly help assess emissions targets and meet the transparency requirements of the Paris Agreement, the Plan improved the system for greenhouse gas emissions monitoring.[4]:55 This was the first time that carbon emissions trading had featured in one of China's Five-Year Plans.[22]:80
The plan also provided for the development of an ultra-high-voltage (UHV) transmission corridor to increase the integration of renewable energy from the point of generation to its point of consumption.[4]:39–41
In addition, the Government will in future include data on greenhouse emissions in its official statistics.[21]
Coal remains the foundation of the Chinese energy system, covering close to 70 percent of the country's primary energy needs and representing 80 percent of the fuel used in electricity generation.[25] China produces and consumes more coal than any other country. Analysis in 2016 shows that China's coal consumption appears to have peaked in 2014.[26][27] According to Global Energy Monitor, China's government has limited the hours of 40% of coal-fired power stations built in 2019, due to overcapacity in electricity generation.[28]
As part of China's efforts to achieve its pledges of peak coal consumption by 2030 and carbon neutrality by 2060, a nationwide effort to reduce overcapacity resulted in the closure of many small and dirty coal mines.[29]:70 Major coal-producingregions like Shaanxi, Inner Mongolia, and Shanxi instituted administrative caps on coal output.[29]:70 These measures contributed to electricity outages in several northeastern provinces in September 2021 and a coal shortage elsewhere in China.[29]:70 The National Development and Reform Commission responded by relaxing some environmental standards and the government allowed coal-fired power plants to defer tax payments.[29]:71Trade policy was adjusted to permit the importation of a small amount of coal from Australia.[29]:72 The energy problems abated in a few weeks.[29]:72
In 2023, China accounted for about two-thirds of the global increase in coal capacity, commissioning 47.4 gigawatts (GW) of new coal plants. This level of expansion represents the largest annual increase in coal capacity initiated by any country since 2015.[30]
China's oil supply was 4,855 TWh in 2009 which represented 10% of the world's supply.[31]
Although China is still a major crude oil producer, it became an oil importer in the 1990s. China became dependent on imported oil for the first time in its history in 1993 due to demand rising faster than domestic production.[14] In 2002, annual crude petroleum production was 1,298,000,000 barrels, and annual crude petroleum consumption was 1,670,000,000 barrels. In 2006, it imported 145 million tons of crude oil, accounting for 47% of its total oil consumption.[32][33]As of 2023, China's crude-oil imports reached approximately 11.3 million barrels per day (b/d), an increase of about 10% over 2022, making it the world's largest crude-oil importer.[34] In 2024, China imported around 11.1 million b/d, accounting for roughly 74% of the country's apparent oil consumption, highlighting its increasing dependence on imported crude and the growing importance of supply-chain security.[35] Recent analyses indicate that China's demand for transport-fuel oil (gasoline, diesel, and jet fuel) has plateaued, with future oil consumption growth expected mainly from petrochemical feedstocks.[36]
As China's energy landscape continues to shift toward higher efficiency and diversification, its state-owned enterprises remain central to implementing national energy policies and managing the domestic petroleum market. Three state-owned oil companies — Sinopec, CNPC, and CNOOC — continue to dominate China's domestic market.
China announced on June 20, 2008, plans to raise petrol, diesel and aviation kerosene prices. This decision appeared to reflect a need to reduce the unsustainably high level of subsidies these fuels attract, given the global trend in the price of oil.[37]
Top oil producers were in 2010: Russia 502 Mt (13%), Saudi Arabia 471 Mt (12%), US 336 Mt (8%), Iran 227 Mt (6%), China 200 Mt (5%), Canada 159 Mt (4%), Mexico 144 Mt (4%), UAE 129 Mt (3%). The world oil production increased from 2005 to 2010 1.3% and from 2009 to 2010 3.4%.[38]
China was top seventh in natural gas production in 2010.[38]
Issued by China's State Council in September 2013, China's Action Plan for the Prevention and Control of Air Pollution illustrates government desire to increase the share of natural gas in China's energy mix.[14] In May 2014 China signed a 30-year deal with Russia to deliver 38 billion cubic metres of natural gas each year.[40] The Power of Siberia pipeline is designed to reduce China's dependence on coal, which is more carbon intensive and causes more pollution than natural gas.[41] The proposed western gas route from Russia's West Siberian petroleum basin to North-Western China is known as Power of Siberia 2.[42]
In November 2021, U.S. producer Venture Global LNG signed a twenty-year contract with China's state-owned Sinopec to supply liquefied natural gas (LNG).[43] China's imports of U.S. natural gas would more than double.[44]
Electricity generation
By 2025, Asia is projected to account for half of the world's electricity consumption, with one-third of global electricity to be consumed in China.[45]
China depends mainly on fossil fuels for its electricity
In 2013, China's total annual electricity output was 5.398 trillion kWh and the annual consumption was 5.380 trillion kWh with an installed capacity of 1247 GW (all the largest in the world).[46]
This is an increase from 2009, when China's total annual electricity output was 3.71465trillion kWh,[47] and the annual consumption was 3.6430trillion kWh (second largest in the world).[48] In the same year, the total installed electricity generating capacity was 874 GW.[49] China is undertaking substantial long-distance transmission projects with record breaking capacities, and has the goal of achieving an integrated nationwide grid in the period between 2015 and 2020.[50]
In 2015, China generated 73% of its electricity from coal-fired power stations, which has been dropping from a peak of 81% in 2007.[24]
In recent years, China has increased its use of coal power and continued to build new coal power plants. The National Energy Administration's early warning risk rating for coal plants approved the establishment of new power plants in 2020. China shut down roughly 7GW of power plants at the same time, continuing to decommission ageing coal-fired power reactors.[51]
In 2024, global coal-power capacity reached a record 2,130 gigawatts, with China initiating 70 gigawatts of new coal plants—nearly 20 times more than the rest of the world combined. This expansion led to a 2% increase in the world's coal fleet, primarily to enhance China's energy security. Despite a global shift away from coal, this rise underscores potential conflicts with China's climate goals. Additionally, coal capacity also grew in Indonesia and India, marking the first global increase outside China since 2019.[52]
China added more solar and wind power than the rest of the world combined in 2024.
China is the world's leading renewable energy producer, with an installed capacity of 152 GW.[53] China has been investing heavily in the renewable energy field in recent years. In 2007, the total renewable energy investment was US$12billion, second only to Germany.[54] In 2012, China invested US$65.1billion in clean energy (20% more than in 2011), fully 30% of the total investment by the G-20, including 25% (US$31.2billion) of global solar energy investment, 37% percent (US$27.2billion) of global wind energy investment, and 47% (US$6.3billion) of global investment in "other renewable energy" (small hydro, geothermal, marine, and biomass); 23 GW of clean generation capacity was installed.[55][needs update]
Approximately 7% of China's energy was from renewable sources in 2006, a figure targeted to rise to 10% by 2010 and to 16% by 2020.[16] The major renewable energy source in China is hydropower. Total hydro-electric output in China in 2009 was 615.64TWh, constituting 16.6% of all electricity generated. The country already has the most hydro-electric capacity in the world, and the Three Gorges Dam is currently the largest hydro-electric power station in the world, with a total capacity of 22.5 GW. It has been in full operation since 2012.
In 1991, China's first nuclear power plant became operational.[57]:197 As of 2020, it had 49 operational reactors, China, 41 additional nuclear reactors planned, and 168 proposed reactors under consideration.[57]:197
As of at least 2023, China's goals for nuclear power expansion are the most ambitious of any country.[57]:197
Although a majority of the renewable energy in China is from hydropower, other renewable energy sources are in rapid development. In 2006, a total of 10billion US dollars had been invested in renewable energy, second only to Germany.[60]
China is a major source of clean energy technology transfer to other developing countries.[4]:4 Approximately 54% of the Belt and Road Initiative's energy projects are in clean energy or alternative energy sectors.[61]:216
In 2006, 16 million tons of corn were used to produce a first generation biofuel (ethanol).[62] However, because food prices in China rose sharply during 2007, China has decided to ban the further expansion of the corn ethanol industry.
On February 7, a spokesman for the State Forestry Administration announced that 130,000 square kilometres (50,000sqmi) would be devoted to biofuel production. Under an agreement reached with PetroChina in January 2007, 400 square kilometres of Jatropha curcas is to be grown for biodiesel production. Local governments are also developing oilseed projects. There were concerns that such developments may lead to environmental damage.[63]
In 2018, The Telegraph reported that the biofuel industry was further on the rise.[64] There was[when?] also considerable interest in biofuels (for example biodiesel, green jet fuel)[65][66][67] which use waste material as the input source (second generation biofuel).
China has become the world's largest consumer of solar energy.[68] It is the largest producer of solar water heaters, accounting for 60 percent of the world's solar water heating capacity, and the total installed heaters is estimated at 30 million households.[69]Solar photovoltaic (solar PV) production in China is also in rapid development. In 2007, 0.82 GW of solar PV was produced, second only to Japan.[53]
China's Sixth Five-Year Plan (1981–1985) was the first to address government policy support for solar PV panel manufacturing.[4]:34 Policy support for solar panel manufacturing has been a part of every Five-Year Plan since.[4]:34
As part of the stimulus plan of "Golden Sun", announced by the government in 2009, several developments and projects became part of the milestones for the development of solar technology in China. These include the agreement signed by LDK for a 500MW solar project, a new thin film solar plant developed by Anwell Technologies in Henan province using its own proprietary solar technology and the solar power plant project in a desert, headed by First Solar and Ordos City. The effort to drive the renewable energy use in China was further assured after the speech by the Chinese leader, given at the UN climate summit on 22 September 2009 in New York, pledging that China would plan to have 15% of its energy from renewable sources by 2019. China is using solar power in houses, buildings, and cars.[70][71][72]
Because solar works well as a distributed power source, recent Chinese policies have focused on increasing the prevalence of distributed solar energy and for developing systems so that electricity from solar energy can be used at its point of generation instead of being transmitted over long distances.[4]:34
China's total wind power capacity reached 2.67 gigawatts (GW) in 2006 and 44.7 GW by 2010.[73][74] This figure reached 281 GW in 2020, an increase of 71.6 GW on the previous year.[75]
Energy conservation
General work plan
Officials were warned that violating energy conservation and environmental protection laws would lead to criminal proceedings, while failure to achieve targets would be taken into account in the performance assessment of officials and business leaders.[12]
After achieving less than half the 4% reduction in energy intensity targeted for 2006, all companies and local and national government were asked to submit detailed plans for compliance before June 30, 2007.[76][77]
During the first four years of the plan, energy intensity improved by 14.4%, but dropped sharply in the first quarter of 2010. In August 2010, China announced the closing of 2,087 steel mills, cement works and other energy-intensive factories by September 30, 2010. The factory closings were made more palatable by a labor shortage in much of China making it easier for workers to find other jobs.[78]
Space heating and air conditioning
A State Council circular issued on June 3, 2007, restricts the temperature of air conditioning in public buildings to no lower than 26°C in summer (78.8°F), and of heating to no higher than 20°C (68°F) in winter. The sale of inefficient air conditioning units has also been outlawed.[79]
Public opinion
The Chinese results from the 1st Annual World Environment Review, published on June 5, 2007, revealed that, in a sample of 1024 people (50% male):[80]
62% think it appropriate for developed countries to demand restrictions on carbon dioxide emissions from developing countries.
Another survey published in August 2007 by China Youth Daily and the British Council sampled 2,500 Chinese people with an average age of 30.1. It showed that 80% of young Chinese are concerned about global warming.[81]
1234567891011Lewis, Joanna I. (2023). Cooperating for the Climate: Learning from International Partnerships in China's Clean Energy Sector. Cambridge, Massachusetts: The MIT Press. ISBN978-0-262-54482-5.
↑Ding, Iza (2020). "Pollution Emissions Trading in China". In Esarey, Ashley; Haddad, Mary Alice; Lewis, Joanna I.; Harrell, Stevan (eds.). Greening East Asia: The Rise of the Eco-Developmental State. Seattle: University of Washington Press. ISBN978-0-295-74791-0. JSTORj.ctv19rs1b2.
↑Liu, Jingye (2025). "Assessing the security of crude oil supply chain: The case of China". Energy Strategy Reviews. 53 101104. Elsevier. doi:10.1016/j.esr.2025.101104.
↑"Electricity Market Report 2023"(PDF). IEA.org. International Energy Agency. February 2023. p.15. Archived(PDF) from the original on March 15, 2023. Licensed CC BY 4.0.
12345Massot, Pascale (2024). China's Vulnerability Paradox: How the World's Largest Consumer Transformed Global Commodity Markets. New York, NY, United States of America: Oxford University Press. ISBN978-0-19-777140-2.
↑Jiang, Ting (2024). "Belt and Road by the Sea: 21st Century Maritime Silk Road". In Fang, Qiang; Li, Xiaobing (eds.). China under Xi Jinping: A New Assessment. Leiden University Press. ISBN978-90-8728-441-1.
↑"Archived copy"(PDF). wwindea.org. Archived from the original(PDF) on September 4, 2011. Retrieved August 8, 2011.{{cite web}}: CS1 maint: archived copy as title (link)
This page is based on this Wikipedia article Text is available under the CC BY-SA 4.0 license; additional terms may apply. Images, videos and audio are available under their respective licenses.