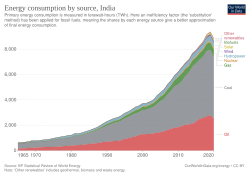
Energy in India

Last updated

Energy consumption by source, India Energy consumption India.svg
Energy consumption by source, India
Development of carbon dioxide emissions CO2 emissions India.svg
Development of carbon dioxide emissions

Since 2013, total primary energy consumption in India has been the third highest in the world (see world energy consumption) after China (see energy in China) and United States (see energy in United States). [1] [2] India is the second-top coal consumer in the year 2017 after China. India ranks third in oil consumption with 22.1 crore (221 million) tons in 2017 after United States and China. [3] India is net energy importer to meet nearly 47% of its total primary energy in 2019. [4] [5]

Contents

Overview

In 2022-23, Total Primary Energy Supply (TPES) per capita is 25,745 mega joule whereas Total Final Consumption per capita is 16,699 mega joule. Electricity consumption per capita is 1015 kWh in 2022-23. The energy intensity of agriculture is seven times less than industries in 2022-23 (see Table 8.9 [6] )

Yearwise consumption of energy sources [6]
Fiscal yearMid Year Population
(million)
Coal
(million tonnes)
Lignite
(million tonnes)
Crude oil
(million tonnes)
Natural gas
(billion cubic meters)
Electricity@
(billion kWh)
Eq CO2-emissions
(million tonnes) [7]
2013-141,25273944222528742,087.5
2014-151,26882247223519482,248.1
2015-161,28483742233531,0012,321.4
2016-171,29983743245561,0612,425.2
2017-181,31389846252591,1232,493.6
2018-191,32896846257611,2092,613.2
2019-201,34295642254641,2482,645.4
2020-211,35790638222611,2302,450.3
2021-221,3701,02849242641,3162,700.5
2022-231,3831,11547255601,4032,865.2

@ Includes electricity generated from fossil fuels.

India: Total primary energy use of 753.7 Mtoe (excluding traditional biomass use) in the calendar year 2017 [8]

  424.0 Mtoe Coal (56.26%)
  222.1 Mtoe Petroleum & other liquids (29.47%)
  46.6 Mtoe Natural gas (6.18%)
  8.5 Mtoe Nuclear (1.13%)
  30.7 Mtoe Hydroelectricity (4.07%)
  21.8 Mtoe Other renewables (2.89%)
Energy in India [9]
Population
million
Prim. energy
TWh
Production
TWh
Import
TWh
Electricity
TWh
CO2-emission
Mt
20041,0806,6625,4301,2304941,103
20071,1236,9195,2441,7456101,324
20081,1407, 2225,4461,8366451,428
20091,1557,8605,8442,1166901,586
20101,1718,0566,0322,1107551,626
20121,2418,7166,2912,4838351,745
2012R1,2379,1666,3332,8299401,954
20131,2509,0186,0862,9629791,869
Change 2004–108.4%20.9%11.1%72%53%47.4%
Mtoe = 11.63 TWh, Prim. energy includes energy losses that are 2/3 for nuclear power [10]

2012R = CO2 calculation criteria changed, numbers updated

Coal

Coal production of India Coal production of India.svg
Coal production of India

India is the second largest producer of coal and second largest importer of coal. Talcher coal based fertilizer plant is under final stages of execution to produce 1.21 million tonnes of urea. This plant is designed to use local coal mixed with pet coke available from crude oil refineries. India is planning to use 100 million tonnes of coal for gasification by 2030. [11]

Coal and lignite production was 73.1 crore (731 million) tons in the financial year 2019-2020. [12] [13] India was the fourth top coal producer in 2017 with 294.2 Mtoe (7.8% global share). [8] Nearly 80% of total electricity generated (utility and captive) in India is from coal and it is the main source of the nation's greenhouse gas emissions.

According to Greenpeace the largest coal belt in India is at Jharia. Before coal mining Jharia had forests inhabited by tribes. In 1971 the coal mines were nationalised. Bharat Coking Coal Limited (BCCL) took over Jharia coal mines. [14]

India accounts for the world’s greatest concentration of coal seam fires. Mine area suffers from pollution of air, water and land. [14]

As of 2019, coal production was integrated into the Central Government; [15] for example, the Government owned about 75% of Coal India Limited, which supplied about 84% of India's thermal coal. [15]

India imports coking coal as good quality coking coal deposits suitable for iron and steel production are not available. In the financial year 2021 -22, India imported nearly 57.16 million tons (90%) against the consumption of 63.74 MT. [16] Sponge iron route using noncoking coal is also followed to produce iron and steel which does not depend on coke or natural gas. [17] [18]

Oil and natural gas

India was the third top crude oil consumer globally (4.8% of the world) with 221 Mt in 2017. India was the second-top net crude oil (including crude oil products) importer of 205.3 Mt in 2019. [19] India has 49.72 lakh (4.972 million) barrels per day (5.1% of the world) crude oil refining capacity which is ranked 4th globally in 2017. [8]

Liquefied petroleum gas

Cylinders with LPG in India Liquefied petroleum gas cylinders.jpg
Cylinders with LPG in India

Nearly 1 crore (10.937 million) tons Liquefied Petroleum Gas (LPG) was consumed during April to September 2019 (six months) in the domestic sector mainly for cooking. [20] The number of domestic connections are 274 million (one connection for five people) with a circulation of more than 40 crore (400 million) LPG cylinders whose net aggregate length would form a 2,00,000 km long pipe line which is more than the length of total railway track laid in India. [21] India is second largest consumer of LPG globally. [22] Most of the LPG requirement is imported. [23] Piped city gas supply in India is not yet developed on major scale. [24] [25]

Biomass and charcoal

Biomass is a renewable energy source and its use as feedstock to produce biofuels or organic chemicals is mostly carbon-neutral fuel. [26] Carbon dioxide is first taken up by plants during photosynthesis, and later released when biomass is burned. Presently, only 20% of households in India use biomass and charcoal for cooking purposes as LPG use for cooking purposes is rising rapidly. [27] [28] In addition biomass is also used marginally in commercial cooking, electricity generation, process industries, etc. The total biomass use in India is nearly 177 Mtoe in the year 2013. [1] Substantial surplus crop residue is also burnt in agriculture fields to clear the land for the next crop. Nearly 75 crores (750 million) tons of nonedible (by cattle) biomass is available annually in India which can be put to use for higher value addition without CO2 emissions. [29] [30]

Huge quantity of imported coal is being used in pulverised coal-fired power stations. Raw biomass is not suitable for use in the pulverised coal mills as they are difficult to grind into fine powder due to caking problem. However 100% biomass can be fired after torrefaction in the pulverised coal mills for replacing imported coal. [31] Torrefied biomass plants can be integrated with existing pulverised coal-fired power stations using the available hot flue gas as heat source. Cofiring dry biomass up to 20% heat input with coal is also possible directly in pulverised coal-fired power stations without facing caking problem. [32] North west and southern regions can replace imported coal use with biomass where surplus agriculture/crop residue biomass is burnt in the fields causing pollution problems. [33] As traditional use of biomass is being replaced by LPG at a faster pace, biomass burning in agriculture fields would become major source for causing higher level air pollution. [34]

Biogas which is mainly methane/natural gas can also be used for generating protein-rich cattle, poultry and fish feed in villages economically by cultivating Methylococcus capsulatus bacteria culture with tiny land and water foot print. [35] [36] [37] The carbon dioxide gas produced as by product from these plants can be put to use in cheaper production of algae oil from algae particularly in tropical countries like India which can displace the prime position of crude oil in near future. [38] [39] Union government is implementing many schemes to utilise productively the agro waste or biomass in rural areas to uplift rural economy and job potential. [40] [41]

Biofuel

India imports 85% of petroleum products with an import cost of $55 billion in 2020-21, India has set a target of blending 20% ethanol in petrol by 2025 resulting in import substitution saving of US$4 billion or 30,000 crore and India provides financial assistance for manufacturing ethanol from rice, wheat, barley, corn, sorghum, sugarcane, sugar beet, etc. [42] In 2016, ethanol market penetration had reached 3.3% blend rate. [43]

Electricity

India electricity production India electricity production.svg
India electricity production

India was the third largest electricity producer in the world with 1,383 TWh generation in FY 2019–2020 and 99.99% of the population having access to power supply. [44] By 2013, India became the world's third largest producer of electricity with 4.8% global share, surpassing Japan and Russia. [45] [46] India ranks 6th globally in hydropower generation during the year 2019. [19]

India has 136 GW (38%) installed capacity of renewable energy. It is one of the world leaders in renewable energy investments and installations. [47]

India has set a target of 175 gigawatts (GW) of renewable energy capacity by 2022. [48] This would include 100 GW capacity from solar energy sources, 60 GW from wind power, 10 GW from biopower, and 5 GW from small hydropower. [49]

See also

Related Research Articles

<span class="mw-page-title-main">Gasification</span> Form of energy conversion

Gasification is a process that converts biomass- or fossil fuel-based carbonaceous materials into gases, including as the largest fractions: nitrogen (N2), carbon monoxide (CO), hydrogen (H2), and carbon dioxide (CO2). This is achieved by reacting the feedstock material at high temperatures (typically >700 °C), without combustion, via controlling the amount of oxygen and/or steam present in the reaction. The resulting gas mixture is called syngas (from synthesis gas) or producer gas and is itself a fuel due to the flammability of the H2 and CO of which the gas is largely composed. Power can be derived from the subsequent combustion of the resultant gas, and is considered to be a source of renewable energy if the gasified compounds were obtained from biomass feedstock.

India is the third largest producer of electricity in the world. During the fiscal year (FY) 2022–23, the total electricity generation in the country was 1,844 TWh, of which 1,618 TWh was generated by utilities.

Substitute natural gas (SNG), or synthetic natural gas, is a fuel gas (predominantly methane, CH4) that can be produced from fossil fuels such as lignite coal, oil shale, or from biofuels (when it is named bio-SNG) or using electricity with power-to-gas systems.

<span class="mw-page-title-main">Energy in Japan</span> Overview of the production, consumption, import and export of energy and electricity in Japan

Japan is a major consumer of energy, ranking fifth in the world by primary energy use. Fossil fuels accounted for 88% of Japan's primary energy in 2019. Japan imports most of its energy due to scarce domestic resources. As of 2022, the country imports 97% of its oil and is the larger LNG importer globally.

<span class="mw-page-title-main">Energy in the United Kingdom</span> Overview of the energy use of the United Kingdom

Energy in the United Kingdom came mostly from fossil fuels in 2021. Total energy consumption in the United Kingdom was 142.0 million tonnes of oil equivalent in 2019. In 2014, the UK had an energy consumption per capita of 2.78 tonnes of oil equivalent compared to a world average of 1.92 tonnes of oil equivalent. Demand for electricity in 2014 was 34.42 GW on average coming from a total electricity generation of 335.0 TWh.

The energy policy of India is to increase the locally produced energy in India and reduce energy poverty, with more focus on developing alternative sources of energy, particularly nuclear, solar and wind energy. Net energy import dependency was 40.9% in 2021-22.

<span class="mw-page-title-main">Energy in Denmark</span> Energy and electricity production, consumption, import and export in Denmark

Denmark has considerable sources of oil and natural gas in the North Sea and ranked as number 32 in the world among net exporters of crude oil in 2008. Denmark expects to be self-sufficient with oil until 2050. However, gas resources are expected to decline, and production may decline below consumption in 2020, making imports necessary. Denmark imports around 12% of its energy.

<span class="mw-page-title-main">Energy in Brazil</span> Overview of the production, consumption, import and export of energy and electricity in Brazil

Brazil is the 7th largest energy consumer in the world and the largest in South America. At the same time, it is an important oil and gas producer in the region and the world's second largest ethanol fuel producer. The government agencies responsible for energy policy are the Ministry of Mines and Energy (MME), the National Council for Energy Policy (CNPE), the National Agency of Petroleum, Natural Gas and Biofuels (ANP) and the National Agency of Electricity (ANEEL). State-owned companies Petrobras and Eletrobras are the major players in Brazil's energy sector, as well as Latin America's.

<span class="mw-page-title-main">Energy policy of China</span> Energy sources used and produced by China

China is both the world's largest energy consumer and the largest industrial country, and ensuring adequate energy supply to sustain economic growth has been a core concern of the Chinese Government since the founding of the People's Republic of China in 1949. Since the country's industrialization in the 1960s, China is currently the world's largest emitter of greenhouse gases, and coal in China is a major cause of global warming. However, from 2010 to 2015 China reduced energy consumption per unit of GDP by 18%, and CO2 emissions per unit of GDP by 20%. On a per-capita basis, China was only the world's 51st largest emitter of greenhouse gases in 2016. China is also the world's largest renewable energy producer, and the largest producer of hydroelectricity, solar power and wind power in the world. The energy policy of China is connected to its industrial policy, where the goals of China's industrial production dictate its energy demand managements.  

<span class="mw-page-title-main">Energy in Vietnam</span> Overview of the production, consumption, import and export of energy and electricity in Vietnam

Vietnam is a dynamic developing economy with a relatively high growth rate. The energy sector plays a key role in promoting the country's socio-economic development. Vietnam has a diverse energy fuel resource of various types such as coal, natural gas, petroleum, hydropower and renewables such as solar and wind energy. The country has recently been successful in renewable energy deployment, especially solar and wind power development. Coal has been the key power generation source since 2018. Coal accounted for about 30% of installed capacity and 47% of electricity generation in 2021 The high use of coal makes Vietnam an increasingly important emitter of carbon dioxide, contributing to climate change.

<span class="mw-page-title-main">Energy in Germany</span>

Energy in Germany is obtained for the vast majority from fossil sources, accounting for 77.6% of total energy consumption in 2023, followed by renewables at 19.6%, and 0.7% nuclear power. As of 2023, German primary energy consumption amounted to 10,791 Petajoule, making it the ninth largest global primary energy consumer. The total consumption has been steadily declining from its peak of 14,845 Petajoule in 2006. In 2023 Germany's gross electricity production reached 508.1 TWh, down from 569.2 TWh in 2022, and 631.4 TWh in 2013.

<span class="mw-page-title-main">Energy in Finland</span> Overview of the production, consumption, import and export of energy and electricity in Finland

Energy in Finland describes energy and electricity production, consumption and import in Finland. Energy policy of Finland describes the politics of Finland related to energy. Electricity sector in Finland is the main article regarding electricity in Finland.

<span class="mw-page-title-main">Renewable energy in India</span>

India is the world's 4th largest consumer of electricity and the world's 3rd largest renewable energy producer with 40% of energy capacity installed in the year 2022 coming from renewable sources. Ernst & Young's (EY) 2021 Renewable Energy Country Attractiveness Index (RECAI) ranked India 3rd behind USA and China. In FY2023-24, India is planning to issue 50 GW tenders for wind, solar and hybrid projects. India has committed for a goal of 500 GW renewable energy capacity by 2030. In line with this commitment, India's installed renewable energy capacity has been experiencing a steady upward trend. From 94.4 GW in 2021, the capacity has gone up to 119.1 GW in 2023 as of Q4.

<span class="mw-page-title-main">Energy in Austria</span> Overview of the production, consumption, import and export of energy and electricity in Austria

Energy in Austria describes energy and electricity production, consumption and import in Austria. Austria is very reliant on hydro as an energy source, supported by imported oil and natural gas supplies. It is planned by 2030 to become 100% electricity supplied by renewable sources, primarily hydro, wind and solar.

<span class="mw-page-title-main">Energy in Indonesia</span> Overview of the production, consumption, import and export of energy and electricity in Indonesia

In 2019, the total energy production in Indonesia is 450.79 Mtoe, with a total primary energy supply is 231.14 Mtoe and electricity final consumption is 263.32 TWh. Energy use in Indonesia has been long dominated by fossil resources. Once a major oil exporter in the world and joined OPEC in 1962, the country has since become a net oil importer despite still joined OPEC until 2016, making it the only net oil importer member in the organization. Indonesia is also the fourth-largest biggest coal producer and one of the biggest coal exporter in the world, with 24,910 million tons of proven coal reserves as of 2016, making it the 11th country with the most coal reserves in the world. In addition, Indonesia has abundant renewable energy potential, reaching almost 417,8 gigawatt (GW) which consisted of solar, wind, hydro, geothermal energy, ocean current, and bioenergy, although only 2,5% have been utilized. Furthermore, Indonesia along with Malaysia, have two-thirds of ASEAN's gas reserves with total annual gas production of more than 200 billion cubic meters in 2016.

<span class="mw-page-title-main">Energy in Sweden</span> Overview of energy use in Sweden

Energy in Sweden describes energy and electricity production, consumption and import in Sweden. Electricity sector in Sweden is the main article of electricity in Sweden. The Swedish climate bill of February 2017 aims to make Sweden carbon neutral by 2045. The Swedish target is to decline emission of climate gases 63% from 1990 to 2030 and international transportation excluding foreign flights 70%. By 2014 just over half of the country's total final energy consumption in electricity, heating and cooling and transport combined was provided by renewables, the highest share amongst the then 28 EU member countries. About a third of Sweden's electricity is generated by nuclear power. In generating a year's worth of this energy, Swedes generate about 4 tonnes of CO2 emissions each. Since 2010, sustainability measures have reduced total emissions even as the population has increased.

<span class="mw-page-title-main">Energy in Greece</span> Overview of the production, consumption, import and export of energy and electricity in Greece

Energy in Greece is dominated by fossil gas and oil. Electricity generation is dominated by the one third state owned Public Power Corporation. In 2009 DEI supplied for 85.6% of all electric energy demand in Greece, while the number fell to 77.3% in 2010. Almost half (48%) of DEI's power output in 2010 was generated using lignite. 12% of Greece's electricity comes from hydroelectric power plants and another 20% from natural gas. Between 2009 and 2010, independent companies' energy production increased by 56%, from 2,709 Gigawatt hour in 2009 to 4,232 GWh in 2010.

<span class="mw-page-title-main">Energy in Belarus</span> Overview of the production, consumption, import and export of energy and electricity in Belarus

Energy in Belarus describes energy and electricity production, consumption and import in Belarus. Belarus is a net energy importer. According to IEA, the energy import vastly exceeded the energy production in 2015, describing Belarus as one of the world's least energy sufficient countries in the world. Belarus is very dependent on Russia.

The petroleum industry in India dates back to 1889 when the first oil deposits in the country were discovered near the town of Digboi in the state of Assam. The natural gas industry in India began in the 1960s with the discovery of gas fields in Assam and Maharashtra. As on 31 March 2018, India had estimated crude oil reserves of 594.49 million metric tonnes (Mt) and natural gas reserves of 1339.57 billion cubic metres of natural gas (BCM).

<span class="mw-page-title-main">World energy supply and consumption</span> Global production and usage of energy

World energy supply and consumption refers to the global primary energy production, energy conversion and trade, and final consumption of energy. Energy can be used in various different forms, as processed fuels or electricity, or for various different purposes, like for transportation or electricity generation. Energy production and consumption are an important part of the economy. A serious problem concerning energy production and consumption is greenhouse gas emissions. Of about 50 billion tonnes worldwide annual total greenhouse gas emissions, 36 billion tonnes of carbon dioxide was emitted due to energy in 2021.

References

  1. 1 2 "India was the third-largest energy consumer in 2013" . Retrieved 29 July 2016.
  2. "World energy consumption clock". US debt clock org. Retrieved 6 August 2014.
  3. "India energy dashboard" . Retrieved 17 February 2022.
  4. "India - Energy Balance 2019, NITI Aayog" . Retrieved 31 May 2021.
  5. "Indian energy Statistics 2016" (PDF). Retrieved 18 November 2016.
  6. 1 2 "Energy Statistics_India 2024" (PDF). Ministry of Statistics and Programme Implementation, India. Retrieved 16 March 2024.
  7. "Statistical Review of World Energy 2023". The Energy Institute. Retrieved 16 March 2024.
  8. 1 2 3 "BP Statistical Review of world energy 2018" (PDF). Retrieved 17 June 2018.
  9. IEA Key World Energy Statistics Statistics 2015 Archived 4 March 2016 at the Wayback Machine , 2014 (2012R as in November 2015 Archived 5 April 2015 at the Wayback Machine + 2012 as in March 2014 is comparable to previous years statistical calculation criteria, 2013 Archived 2 September 2014 at the Wayback Machine , 2012 Archived 9 March 2013 at the Wayback Machine , 2011 Archived 27 October 2011 at the Wayback Machine , 2010 Archived 11 October 2010 at the Wayback Machine , 2009 Archived 7 October 2013 at the Wayback Machine , 2006 Archived 12 October 2009 at the Wayback Machine IEA October, crude oil p.11, coal p. 13 gas p. 15
  10. Energy in Sweden 2010 Archived 16 October 2013 at the Wayback Machine , Facts and figures, The Swedish Energy Agency, Table 8 Losses in nuclear power stations Table 9 Nuclear power brutto
  11. "Carbon omissions: India's coal gasification plans are ambitious but face an uphill task" . Retrieved 1 April 2024.
  12. "Koyala Darpan / Coal Dashboard" . Retrieved 17 February 2022.
  13. "Provisional Coal Statistics 2019-20" (PDF). Retrieved 27 January 2021.
  14. 1 2 "The True Cost of Coal" Archived 30 November 2008 at the Wayback Machine Greenpeace 27 November 2008 pp. 24–29
  15. 1 2 Gross, Rahul Tongia and Samantha (8 March 2019). "Coal in India". Brookings. Retrieved 26 October 2019.
  16. "Import of coal - Trends and issue of self reliance" (PDF). Retrieved 26 December 2022.
  17. "JSPL's 1.8 MTPA coal gasification based DRI plant resumes operations in Angul" . Retrieved 14 January 2020.
  18. "Coal Gasification based Production of Direct Reduced Iron" . Retrieved 25 January 2020.
  19. 1 2 "Statistical Review of World Energy 2020 (page 31)" (PDF). Retrieved 6 January 2021.
  20. "LPG Profile 2019" (PDF). Retrieved 3 December 2019.
  21. "LPG cylinder now used by 89% households" . Retrieved 5 December 2018.
  22. "India becomes world's second-largest LPG consumer" . Retrieved 5 February 2019.
  23. "India challenges China as world's biggest LPG importer". Archived from the original on 27 December 2017. Retrieved 27 December 2017.
  24. "PM Modi says 70% of India's population will have city gas facility in 2-3 years" . Retrieved 22 November 2018.
  25. "Map of GAIL's Natural Gas Pipelines" . Retrieved 22 November 2018.
  26. "Carbon Neutral Fuels and Chemicals from Standalone Biomass Refineries" (PDF). Retrieved 3 December 2023.
  27. "Nearly 80% of Indian households now have access to LPG gas" . Retrieved 9 March 2018.
  28. "NITI Aayog pitches for round-the-clock power for all-electric vehicles" . Retrieved 25 August 2017.
  29. "Renewable Methanol" (PDF). Retrieved 19 May 2021.
  30. "Maharashtra, Punjab top producers of green energy from farm waste". Archived from the original on 31 August 2015. Retrieved 31 August 2015.
  31. "The upgrading of solid biomasss by means of Torrefaction" (PDF). Archived from the original (PDF) on 3 March 2016. Retrieved 18 September 2014.
  32. "Cofiring of biomass in coal-fired power plants – European experience". Archived from the original on 12 October 2016. Retrieved 18 September 2014.
  33. "CEA has written to all States to use 5-10% of biomass pellets with coal for power generation in thermal power plants" . Retrieved 22 February 2018.
  34. "Air Pollution: Delhi sees hope as NTPC steps in to buy crop residue from farmers" . Retrieved 25 September 2017.
  35. "BioProtein Production" (PDF). Archived from the original (PDF) on 10 May 2017. Retrieved 31 January 2018.
  36. "Food made from natural gas will soon feed farm animals – and us" . Retrieved 31 January 2018.
  37. "New venture selects Cargill's Tennessee site to produce Calysta FeedKind® Protein" . Retrieved 31 January 2018.
  38. "Algenol and Reliance launch algae fuels demonstration project in India" . Retrieved 29 May 2017.
  39. "ExxonMobil Announces Breakthrough In Renewable Energy" . Retrieved 20 June 2017.
  40. "Indrapratha Gas, Mahindra & Mahindra join hands to stop stubble burning" . Retrieved 20 February 2018.
  41. "Modi govt plans Gobar-Dhan scheme to convert cattle dung into energy" . Retrieved 22 February 2018.
  42. India wants to use food grain stock for ethanol. That’s a problem in a hungry country, The Print, 1 July 2021.
  43. "USDA Foreign Agricultural Service, GAIN Report" (PDF).
  44. "Households electrification in India" . Retrieved 21 August 2018.
  45. IEA Key energy statistics 2010 Archived 11 October 2010 at the Wayback Machine p. 27
  46. Energy-efficient buildings – a business case for India? An analysis of incremental costs for four building projects of the Energy-Efficient Homes Programme, 2015
  47. Thomas, Maria (27 November 2018). "India is now a world leader in renewable energy". Quartz India. Retrieved 6 May 2019.
  48. "A target of installing 175 GW of renewable energy capacity by the year 2022 has been set". Public Information Bureau. 19 July 2018. Retrieved 6 May 2019.
  49. "India to install 54.7 GW wind energy capacity by 2022: Fitch Solutions - ET EnergyWorld". ETEnergyworld. 28 April 2019. Retrieved 6 May 2019.