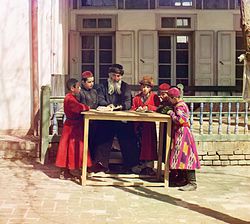
Demographics of Uzbekistan | |
---|---|
Population | 36,799,756 (January 1, 2024) [1] |
Growth rate | 0.83% (2022 est.) |
Birth rate | 26.2 births/1,000 population (2022) |
Death rate | 4.8 deaths/1,000 population (2022) |
Life expectancy | 75.29 years |
• male | 72.27 years |
• female | 78.5 years |
Fertility rate | 3.31 children born/woman (2022) |
Infant mortality rate | 18.98 deaths/1,000 live births |
Net migration rate | -1.78 migrant(s)/1,000 population (2022 est.) |
Age structure | |
0–14 years | 30.1% |
65 and over | 5.3% |
Sex ratio | |
Total | 1.01 male(s)/female (2022 est.) |
At birth | 1.06 male(s)/female |
Under 15 | 1.05 male(s)/female |
65 and over | 0.63 male(s)/female |
Nationality | |
Nationality | Uzbekstani |
Major ethnic | |
Minor ethnic |
|
Language | |
Official | Uzbek |
Spoken | Russian |
Demographic features of the population of Uzbekistan include population growth, population density, ethnicity, education level, health, economic status, religious affiliations, and other aspects of the population. The nationality of a person from Uzbekistan is Uzbekistani, [2] [3] [4] while the ethnic Uzbek majority call themselves Uzbeks. Much of the data is estimated because the last census was carried out in Soviet times in 1989.
Uzbekistan is Central Asia's most populous country. Its 36.8 million people (as of January 2024 [5] ) comprise nearly half the region's total population.
The population of Uzbekistan is very young: 30.1% of its people are younger than 14. [6] According to official sources, Uzbeks comprise a majority (84.4%) of the total population. Other ethnic groups, as of 1996 estimates, include Russians (2.1% of the population), Tajiks (4,8%), Kazakhs (3%), Karakalpaks (2.5%), and Tatars (1.5%). [7] Uzbekistan has an ethnic Korean population that was forcibly relocated to the region from the Soviet Far East in 1937–1938. There are also small groups of Armenians in Uzbekistan, mostly in Tashkent and Samarkand. The nation is 94% Muslim (mostly Sunni), 3% Eastern Orthodox and 3% other faiths (which include small communities of Korean Christians, other Christian denominations, Buddhists, Baha'is, and more). [8] The Bukharan Jews have lived in Central Asia, mostly in Uzbekistan, for thousands of years. There were 94,900 Jews in Uzbekistan in 1989 [9] (about 0.5% of the population according to the 1989 census), but now, since the collapse of the USSR, most Central Asian Jews left the region for the United States or Israel. More than 5,000 Jews remain in Uzbekistan. [10]
Much of Uzbekistan's population was engaged in cotton farming in large-scale collective farms when the country was part of the Soviet Union. The population continues to be heavily rural and dependent on farming for its livelihood, although the farm structure in Uzbekistan has largely shifted from collective to individual since 1990.
Period | Births per year | Deaths per year | Natural change per year | CBR1 | CDR1 | NC1 | TFR1 | IMR1 |
---|---|---|---|---|---|---|---|---|
1990–1995 | 32.7 | 7.5 | 25.2 | 3.95 | ||||
1995–2000 | 25.6 | 6.9 | 18.7 | 3.10 | ||||
2000–2005 | 21.3 | 6.4 | 14.9 | 2.51 | ||||
2005–2010 | 22.4 | 6.2 | 16.2 | 2.49 | ||||
2010–2015 | 22.9 | 6.2 | 16.7 | 2.43 | ||||
2015–2020 | 21.8 | 5.8 | 16.0 | 2.43 | ||||
2020–2025 | 18.6 | 5.9 | 12.7 | 2.31 | ||||
2025–2030 | 16.4 | 6.3 | 10.1 | 2.21 | ||||
2030–2035 | 15.7 | 6.9 | 8.8 | 2.12 | ||||
2035–2040 | 15.6 | 7.6 | 8.0 | 2.05 |
Source: United Nations, Department of Economic and Social Affairs website > World Population Prospects: The 2019 revision. [11]
Average population | Live births | Deaths | Natural change | Crude birth rate (per 1000) | Crude death rate (per 1000) | Natural change (per 1000) | Crude migration rate (per 1000) | TFR | |
---|---|---|---|---|---|---|---|---|---|
1950 | 6,314,000 | 192,188 | 54,612 | 137,576 | 30.4 | 8.6 | 21.8 | ||
1951 | 6,511,000 | 207,302 | 49,275 | 158,027 | 31.8 | 7.6 | 24.3 | 6.9 | |
1952 | 6,704,000 | 223,452 | 55,068 | 168,384 | 33.3 | 8.2 | 25.1 | 4.5 | |
1953 | 6,909,000 | 219,832 | 60,855 | 158,977 | 31.8 | 8.8 | 23.0 | 7.6 | |
1954 | 7,085,000 | 237,470 | 58,345 | 179,125 | 33.5 | 8.2 | 25.3 | 0.2 | |
1955 | 7,256,000 | 248,545 | 59,370 | 189,175 | 34.3 | 8.2 | 26.1 | -2.0 | |
1956 | 7,466,000 | 267,187 | 46,210 | 220,977 | 35.8 | 6.2 | 29.6 | -0.7 | |
1957 | 7,720,000 | 276,668 | 47,568 | 229,100 | 35.8 | 6.2 | 29.7 | 4.3 | |
1958 | 7,979,000 | 300,646 | 48,433 | 252,213 | 37.7 | 6.1 | 31.6 | 1.9 | |
1959 | 8,252,000 | 305,082 | 50,254 | 254,828 | 37.0 | 6.1 | 30.9 | 3.3 | |
1960 | 8,558,000 | 340,618 | 51,758 | 288,860 | 39.8 | 6.0 | 33.8 | 3.3 | |
1961 | 8,895,000 | 339,952 | 53,591 | 286,361 | 38.2 | 6.0 | 32.2 | 7.2 | |
1962 | 9,237,000 | 341,352 | 56,178 | 285,174 | 37.0 | 6.1 | 30.9 | 7.5 | |
1963 | 9,574,000 | 342,659 | 54,502 | 288,157 | 35.8 | 5.7 | 30.1 | 6.4 | |
1964 | 9,905,000 | 346,847 | 53,315 | 293,532 | 35.0 | 5.4 | 29.6 | 5.0 | |
1965 | 10,233,000 | 355,135 | 60,056 | 295,079 | 34.7 | 5.9 | 28.8 | 4.3 | |
1966 | 10,557,000 | 360,336 | 60,115 | 300,221 | 34.1 | 5.7 | 28.4 | 3.3 | |
1967 | 10,886,000 | 359,623 | 64,627 | 294,996 | 33.0 | 5.9 | 27.1 | 4.1 | |
1968 | 11,259,000 | 385,687 | 64,762 | 320,925 | 34.3 | 5.8 | 28.5 | 5.8 | |
1969 | 11,625,000 | 380,729 | 69,147 | 311,582 | 32.8 | 6.0 | 26.8 | 5.7 | |
1970 | 11,973,000 | 401,613 | 66,189 | 335,424 | 33.6 | 5.5 | 28.1 | 1.8 | |
1971 | 12,354,000 | 425,646 | 67,162 | 358,484 | 34.4 | 5.4 | 29.0 | 2.8 | |
1972 | 12,756,000 | 421,458 | 77,942 | 343,516 | 33.0 | 6.1 | 26.9 | 5.6 | |
1973 | 13,155,000 | 441,237 | 83,170 | 358,067 | 33.5 | 6.3 | 27.2 | 4.1 | |
1974 | 13,569,000 | 462,062 | 86,864 | 375,198 | 34.1 | 6.4 | 27.7 | 3.8 | |
1975 | 13,981,000 | 478,604 | 100,213 | 378,391 | 34.2 | 7.2 | 27.0 | 3.4 | |
1976 | 14,389,000 | 503,514 | 101,544 | 401,970 | 35.0 | 7.1 | 27.9 | 1.3 | |
1977 | 14,786,000 | 493,329 | 104,297 | 389,032 | 33.4 | 7.1 | 26.3 | 1.3 | |
1978 | 15,184,000 | 514,030 | 105,204 | 408,826 | 33.9 | 6.9 | 27.0 | -0.1 | |
1979 | 15,578,000 | 535,928 | 109,459 | 426,469 | 34.4 | 7.0 | 27.4 | -1.5 | |
1980 | 15,952,000 | 540,047 | 118,886 | 421,161 | 33.9 | 7.5 | 26.4 | -2.4 | |
1981 | 16,376,000 | 572,197 | 117,793 | 454,404 | 34.9 | 7.2 | 27.7 | -1.1 | |
1982 | 16,813,000 | 589,283 | 124,137 | 465,146 | 35.0 | 7.4 | 27.7 | -1.0 | |
1983 | 17,261,000 | 609,400 | 128,779 | 480,621 | 35.3 | 7.5 | 27.8 | -1.2 | |
1984 | 17,716,000 | 641,398 | 132,042 | 509,356 | 36.2 | 7.5 | 28.8 | -2.4 | 4.60 |
1985 | 18,174,000 | 679,057 | 131,686 | 547,371 | 37.4 | 7.2 | 30.1 | -4.2 | 4.68 |
1986 | 18,634,000 | 708,658 | 132,213 | 576,445 | 38.0 | 7.1 | 30.9 | -5.6 | 4.69 |
1987 | 19,095,000 | 714,454 | 133,781 | 580,673 | 37.4 | 7.0 | 30.4 | -5.7 | 4.57 |
1988 | 19,561,000 | 694,144 | 134,688 | 559,456 | 35.5 | 6.9 | 28.6 | -4.2 | 4.28 |
1989 | 20,108,000 | 668,807 | 126,862 | 541,945 | 33.3 | 6.3 | 27.0 | 1.0 | 4.02 |
1990 | 20,465,000 | 691,636 | 124,553 | 567,083 | 33.8 | 6.1 | 27.7 | -9.9 | 4.20 |
1991 | 20,857,000 | 723,420 | 130,294 | 593,126 | 34.7 | 6.2 | 28.4 | -9.2 | |
1992 | 21,354,000 | 680,459 | 140,092 | 540,367 | 31.9 | 6.6 | 25.3 | -1.5 | |
1993 | 21,847,000 | 692,324 | 145,294 | 547,030 | 31.7 | 6.7 | 25.0 | -1.9 | |
1994 | 22,277,000 | 657,725 | 148,423 | 509,302 | 29.5 | 6.7 | 22.9 | -3.2 | |
1995 | 22,684,000 | 677,999 | 145,439 | 532,560 | 29.9 | 6.4 | 23.5 | -5.2 | 3.60 |
1996 | 23,128,000 | 634,842 | 144,829 | 490,013 | 27.4 | 6.3 | 21.2 | -1.6 | |
1997 | 23,560,000 | 602,694 | 137,331 | 465,363 | 25.6 | 5.8 | 19.8 | -1.1 | |
1998 | 23,954,000 | 553,745 | 140,526 | 413,219 | 23.1 | 5.9 | 17.3 | -0.6 | |
1999 | 24,312,000 | 544,788 | 130,529 | 414,259 | 22.4 | 5.4 | 17.0 | -2.1 | |
2000 | 24,650,000 | 527,580 | 135,598 | 391,982 | 21.4 | 5.5 | 15.9 | -2.0 | 2.59 |
2001 | 24,965,000 | 512,950 | 132,542 | 380,408 | 20.5 | 5.3 | 15.2 | -2.4 | |
2002 | 25,272,000 | 532,511 | 137,028 | 395,483 | 21.1 | 5.4 | 15.6 | -3.3 | |
2003 | 25,568,000 | 508,457 | 135,933 | 372,524 | 19.9 | 5.3 | 14.6 | -2.9 | |
2004 | 25,864,000 | 540,381 | 130,357 | 410,024 | 20.9 | 5.0 | 15.9 | -4.3 | |
2005 | 26,167,000 | 533,530 | 140,585 | 392,945 | 20.4 | 5.4 | 15.0 | -3.3 | 2.36 |
2006 | 26,488,000 | 555,946 | 139,622 | 416,324 | 21.0 | 5.3 | 15.7 | -3.4 | |
2007 | 26,868,000 | 608,917 | 137,430 | 471,487 | 22.7 | 5.1 | 17.5 | -3.2 | 2.55 |
2008 | 27,303,000 | 646,096 | 138,792 | 507,304 | 23.7 | 5.1 | 18.6 | -2.4 | 2.64 |
2009 | 27,767,000 | 649,727 | 130,659 | 519,068 | 23.4 | 4.7 | 18.7 | -1.7 | 2.53 |
2010 | 28,562,000 | 634,810 | 138,411 | 496,399 | 22.2 | 4.8 | 17.4 | 11.2 | 2.34 |
2011 | 29,339,000 | 626,881 | 144,585 | 482,296 | 21.4 | 4.9 | 16.4 | 10.8 | 2.24 |
2012 | 29,774,000 | 625,106 | 145,988 | 479,118 | 21.0 | 4.9 | 16.1 | -1.3 | 2.19 |
2013 | 30,243,000 | 679,519 | 145,672 | 533,847 | 22.5 | 4.8 | 17.7 | -1.9 | 2.35 |
2014 | 30,759,000 | 718,036 | 149,761 | 568,998 | 23.3 | 4.9 | 18.4 | -1.3 | 2.46 |
2015 | 31,576,000 | 734,141 | 152,035 | 582,106 | 23.5 | 4.9 | 18.6 | 8.0 | 2.49 |
2016 | 32,121,000 | 726,170 | 154,791 | 571,379 | 22.8 | 4.8 | 18.0 | -0.7 | 2.46 |
2017 | 32,653,000 | 715,519 | 160,723 | 554,796 | 22.1 | 5.0 | 17.1 | -0.5 | 2.42 |
2018 | 33,254,000 | 768,520 | 154,913 | 613,607 | 23.3 | 4.7 | 18.6 | -0.2 | 2.60 |
2019 | 33,905,000 | 815,939 | 154,959 | 660,980 | 24.3 | 4.6 | 19.7 | -0.1 | 2.79 |
2020 | 34,558,900 | 841,814 | 175,637 | 666,177 | 24.6 | 5.1 | 19.5 | -0.2 | 2.90 |
2021 | 35,271,300 | 905,211 | 174,541 | 730,670 | 25.9 | 5.0 | 20.9 | -0.3 | 3.17 |
2022 | 36,024,900 | 932,192 | 172,075 | 760,117 | 26.2 | 4.8 | 21.4 | 0 | 3.31 |
2023 | 36,799,800 | 961,962 | 172,772 | 789,190 | 26.4 | 4.7 | 21.7 | -0.2 | 3.45 |
2024 | 37,543,200 | 926,422 | 174,413 | 752,009 | 24.9 | 4.7 | 20.2 |
Sources: [12] [13] [14] [15] [16] [17] [18] [19] [20]
Period | Live births | Deaths | Natural increase |
---|---|---|---|
January—September 2023 | 716,885 | 129,664 | 587,221 |
January—September 2024 | 693,897 | 131,674 | 562,223 |
Difference | -22,988 (-3.21%) | +2,010 (+1.54%) | -24,998 |
Total fertility rate (TFR) and crude birth rate (CBR): [23]
Year | Total | Urban | Rural | |||
---|---|---|---|---|---|---|
CBR | TFR | CBR | TFR | CBR | TFR | |
1996 | 27 | 3,34 (3,1) | 23 | 2,71 (2,5) | 29 | 3,74 (3,4) |
2002 | 24,4 | 2,92 | 19,8 | 2,48 | 27,5 | 3,21 |
In 2002, the estimated TFR was 2.92; Uzbeks 2.99, Russians 1.35, Karakalpak 2.69, Tajik 3.19, Kazakh 2.95, Tatar 2.05, others 2.53; Tashkent City 1.96, Karakalpakstan 2.90, Fergana 2.73; Eastern region 2.71, East Central 2.96, Central 3.43, Western 3.05. [24]
The high fertility rate during the Soviet Union and during its period of disintegration is partly due to the historical cultural preferences for large families, economic reliance upon agriculture, and the greater relative worth of Soviet child benefits in Uzbekistan. [25] Abortion was the preferred method of birth control. Legalized in 1955, the number of abortions increased by 231% from 1956 to 1973. [26] By 1991, the abortion ratio was 39 abortions per 1,000 women of reproductive age per year. [27]
However, in the past few decades, fertility control methods have shifted considerably from abortion to modern contraceptive methods, especially IUDs. By the mid-1980s IUDS became the main method of contraception through government and organizational policies that aimed to introduce women to modern contraceptives. According to a UHES report from 2002, 73% of married Uzbek woman had used the IUD, 14% male condom, and 13% the pill. [28]
The government supported the use of modern contraceptives to control fertility rates because of national economic difficulties that followed the disintegration of the Soviet Union. Thus the government has been influential in determining the popularity of the IUD. Despite family planning programs that educate women on different methods of contraception, the IUD has remained women's first choice of contraception. Word of mouth and social relations also account for the strong preference for the IUD. Nevertheless, factors such as class and level of education have been shown to give women more freedom in their choice of contraception methods.
As of 2022, the regions of Surxondaryo and Qashqadaryo have the highest birth rate in Uzbekistan. On the other hand, the Republic of Karakalpakstan and Buxoro have the lowest birth rate in the country. The highest death rate is in the city of Toshkent, while the lowest in the region of Navoiy.
Vital statistics by regions of the Republic of Uzbekistan [29] [30] | ||||||||||||||||||
---|---|---|---|---|---|---|---|---|---|---|---|---|---|---|---|---|---|---|
Division | Birth rate (‰) | Death rate (‰) | Natural growth rate (‰) | Total fertility rate | ||||||||||||||
Surxondaryo Region | 29.4 | 4.9 | +24.5 | 3.54 | ||||||||||||||
Qashqadaryo Region | 28.5 | 5.0 | +23.5 | 3.47 | ||||||||||||||
Jizzax Region | 27.9 | 4.6 | +23.3 | 3.38 | ||||||||||||||
Samarqand Region | 27.4 | 4.7 | +22.7 | 3.41 | ||||||||||||||
Namangan Region | 27.8 | 4.5 | +23.3 | 3.53 | ||||||||||||||
Andijon Region | 26.3 | 4.7 | +21.6 | 3.46 | ||||||||||||||
Navoiy Region | 25.1 | 4.0 | +21.1 | 3.21 | ||||||||||||||
Xorazm Region | 23.1 | 4.9 | +18.2 | 2.83 | ||||||||||||||
Fergana Region | 25.8 | 4.7 | +21.1 | 3.34 | ||||||||||||||
Republic of Karakalpakstan | 21.8 | 4.9 | +16.9 | 2.67 | ||||||||||||||
Sirdaryo Region | 26.3 | 4.8 | +21.5 | 3.10 | ||||||||||||||
Buxoro Region | 22.6 | 4.5 | +18.1 | 2.91 | ||||||||||||||
Toshkent Region | 24.8 | 5.0 | +19.8 | 3.26 | ||||||||||||||
Toshkent | 25.4 | 5.7 | +19.7 | 3.49 | ||||||||||||||
Republic of Uzbekistan | 26.2 | 4.8 | +21.4 | 3.31 |
2020 estimate:
Period | Life expectancy in Years | Period | Life expectancy in Years |
---|---|---|---|
1950–1955 | 56.1 | 1985–1990 | 66.6 |
1955–1960 | 57.9 | 1990–1995 | 66.3 |
1960–1965 | 59.8 | 1995–2000 | 66.7 |
1965–1970 | 61.6 | 2000–2005 | 67.7 |
1970–1975 | 63.0 | 2005–2010 | 69.1 |
1975–1980 | 64.0 | 2010–2015 | 70.8 |
1980–1985 | 65.3 | 2015-2020 | 75.2 |
Source: UN World Population Prospects 2017 [31]
Ethnic composition according to the 1989 population census (latest available): [32] [33] [34] [35]
Uzbek 71%, Russian 6%, Tajik 5% (believed to be much higher [36] [37] [38] ), Kazakh 4%, Tatar 3%, Karakalpak 2%, other 7%.
Estimates of ethnic composition in 1996 from CIA World Factbook: [39]
Uzbek 80%, Russian 5.5%, Tajik 5%, Kazakh 3%, Karakalpak 2.5%, Tatar 1.5%, other 2.5% (1996 est.)
The table shows the ethnic composition of Uzbekistan's population (in percent) according to four population censuses between 1926 and 1989 (no population census was carried out in 1999, and the next census is now being planned for 2010). [40] The increase in the percentage of Tajik from 3.9% of the population in 1979 to 4.7% in 1989 may be attributed, at least in part, to the change in census instructions: in the 1989 census for the first the nationality could be reported not according to the passport, but freely self-declared on the basis of the respondent's ethnic self-identification. [41]
Ethnic group | census 19261 | census 19392 | census 19593 | census 19704 | census 19795 | census 19896 | estimates 20177 | estimates 20218 | ||||||||
---|---|---|---|---|---|---|---|---|---|---|---|---|---|---|---|---|
Number | % | Number | % | Number | % | Number | % | Number | % | Number | % | Number | % | Number | % | |
Uzbeks | 3,467,226 | 73.0 | 4,804,096 | 65.1 | 5,038,273 | 62.2 | 7,733,541 | 64.7 | 10,569,007 | 68.7 | 14,142,475 | 71.4 | 26,917,700 | 83.8 | 29,194,071 | 84.5 |
Tajiks | 350,670 | 7.4 | 317,560 | 5.1 | 311,375 | 3.8 | 457,356 | 3.8 | 594,627 | 3.9 | 933,560 | 4.7 | 1,544,700 | 4.8 | 1,657,336 | 4.8 |
Kazakhs | 191,126 | 4.0 | 305,416 | 4.9 | 335,267 | 4.1 | 549,312 | 4.6 | 620,136 | 4.0 | 808,227 | 4.1 | 803,400 | 2.5 | 821,172 | 2.4 |
Karakalpaks | 142,688 | 3.0 | 181,420 | 2.9 | 168,274 | 2.1 | 230,273 | 1.9 | 297,788 | 1.9 | 411,878 | 2.1 | 708,800 | 2.2 | 752,646 | 2.2 |
Russians | 245,807 | 5.2 | 727,331 | 11.6 | 1,090,728 | 13.5 | 1,495,556 | 12.5 | 1,665,658 | 10.8 | 1,653,478 | 8.4 | 750,000 | 2.3 | 720,324 | 2.1 |
Kyrgyz | 79,610 | 1.7 | 89,044 | 1.4 | 92,725 | 1.1 | 110,864 | 1.0 | 142,182 | 0.7 | 174,907 | 0.8 | 274,400 | 0.9 | 291,628 | 0.8 |
Turkmens | 31,492 | 0.7 | 46,543 | 0.7 | 54,804 | 0.7 | 71,066 | 0.6 | 92,285 | 0.6 | 121,578 | 0.6 | 192,000 | 0.6 | 206,189 | 0.6 |
Tatars | 28,335 | 0.6 | 147,157 | 2.3 | 397,981 | 4.9 | 442,331 | 3.7 | 531,205 | 3.5 | 467,829 | 2.4 | 195,000 | 0.6 | 187,330 | 0.5 |
Koreans | 30 | 0.0 | 72,944 | 1.2 | 138,453 | 1.7 | 151,058 | 1.3 | 163,062 | 1.1 | 183,140 | 0.9 | 176,900 | 0.6 | 174,210 | 0.5 |
Ukrainians | 25,335 | 0.5 | 70,577 | 1.1 | 87,927 | 1.1 | 114,979 | 1.0 | 113,826 | 0.7 | 153,197 | 0.8 | 70,700 | 0.2 | 67,869 | 0.2 |
Crimean Tatars | 46,829 | 0.6 | 135,426 | 1.1 | 117,559 | 0.8 | 188,772 | 1.0 | ||||||||
Turks | 371 | 0.0 | 474 | 0.0 | 21,269 | 0.3 | 46,398 | 0.4 | 48,726 | 0.3 | 106,302 | 0.5 | ||||
Jews | 37,621 | 0.8 | 50,676 | 0.8 | 94,303 | 1.2 | 102,843 | 0.9 | 99,836 | 0.7 | 94,689 | 0.5 | 9,865 | 0.0 | ||
Armenians | 14,862 | 0.3 | 20,394 | 0.3 | 27,370 | 0.3 | 34,470 | 0.3 | 42,374 | 0.3 | 50,537 | 0.3 | 34,079 | 0.1 | ||
Azerbaijanis | 20,764 | 0.4 | 3,645 | 0.1 | 40,511 | 0.5 | 40,431 | 0.3 | 59,779 | 0.4 | 44,410 | 0.2 | 41,182 | 0.1 | ||
Uyghurs | 36,349 | 0.8 | 50,638 | 0.8 | 19,377 | 0.2 | 24,039 | 0.2 | 29,104 | 0.2 | 35,762 | 0.2 | ||||
Bashkirs | 624 | 0.0 | 7,516 | 0.1 | 13,500 | 0.2 | 21,069 | 0.2 | 25,879 | 0.2 | 34,771 | 0.2 | ||||
Others | 77,889 | 1.6 | 98,838 | 1.6 | 126,738 | 1.6 | 198,570 | 1.7 | 176,274 | 1.1 | 204,565 | 1.0 | 486,900 | 1.5 | 412,855 | 1.2 |
Total | 4,750,175 | 6,271,269 | 8,105,704 | 11,959,582 | 15,389,307 | 19,810,077 | 32,120,500 | 34,558,891 | ||||||||
1 Excluding the Tadzjik ASSR, but including the Kara-Kalpak Autonomous Oblast (in 1926 part of the Kazakh ASSR); source:. [42] 2 Source:. [43] 3 Source:. [44] 4 Source:. [45] 5 Source:. [46] 6 Source:. [47] 7 Source:. [48] 8 Source:. [49] |
According to the CIA factbook, the current language distribution is: Uzbek 82%, Russian 9%, Tajik 5% and Other 4%. [39] The Latin script replaced Cyrillic in the mid-1990s. Following independence, Uzbek was made the official state language. President Islam Karimov, the radical nationalist group Birlik (Unity), and the Uzbek Popular Front promoted this change. These parties believed that Uzbek would stimulate nationalism and the change itself was part of the process of derussification, which was meant to deprive Russian language and culture of any recognition. Birlik held campaigns in the late 1980s to achieve this goal, with one event in 1989 culminating in 12,000 people in Tashkent calling for official recognition of Uzbek as the state language. [50] In 1995, the government adopted the Law of the Republic of Uzbekistan on State Language, which mandates that Uzbek be used in all public spheres and official jobs. Scholars studying migration and ethnic minorities have since criticized the law as a source of discrimination toward minorities who do not speak Uzbek. Nevertheless, Russian remains the de facto language when it comes to science, inter-ethnic communication, business, and advertising. [51] Multiple sources suggest that the Persian-speaking Tajik population of Uzbekistan may be as large as 10%-15% of the total population. [52] The Tajik language is the dominant language spoken in the cities of Bukhara and Samarkand. The delineation of territory in 1924 and the process of "Uzbekisation" caused many Tajiks to identify as Uzbek. Thus there are many Tajiks who speak Tajik but are officially documented as Uzbek. [53]
Muslims constitute 94% of the population according to a 2013 US State Department release. [54] Approximately 3% of the population are Russian Orthodox Christians. [54]
There were 94,900 Jews in Uzbekistan in 1989 [9] (about 0.5% of the population according to the 1989 census), but fewer than 5,000 remained in 2007. [10]
A study showed that more than 50% of surveyed consider religion as "very important". [55]
As of 2011, Uzbekistan has a net migration rate of -2.74 migrant(s)/ 1,000 population. [7]
The process of migration changed after the fall of the Soviet Union. During the Soviet Union, passports facilitated movement throughout the fifteen republics and movement throughout the republics was relatively less expensive than it is today. [56] An application for a labor abroad permit from a special department of the Uzbek Agency of External Labor Migration in Uzbekistan is required since 2003. The permit was originally not affordable to many Uzbeks and the process was criticized for the bureaucratic red tape it required. The same departments and agencies involved in creating this permit are consequently working to substantially reduce the costs as well as simplifying the procedure. On July 4, 2007, the Russian First Deputy Prime Minister Sergey Ivanov signed three agreements that would address labor activity and protection of the rights of the working migrants (this includes Russian citizens in Uzbekistan and Uzbek citizens in Russia) as well as cooperation in fighting undocumented immigration and the deportation of undocumented workers. [57]
Economic difficulties have increased labor migration to Russia, Kazakhstan, the United Arab Emirates (UAE), Turkey, South Korea, and Europe over the past decade. [58] At least 10% of Uzbekistan's labor force works abroad. [59] Approximately 58% of the labor force that migrates, migrates to Russia. [57] High unemployment rates and low wages are responsible for labor migration.
Migrants typically are people from the village, farmers, blue-collar workers, and students who are seeking work abroad. However, many migrants are not aware of the legal procedures required to leave the country, causing many to end up unregistered in Uzbekistan or the host country. Without proper registration, undocumented migrants are susceptible to underpayment, no social guarantees and bad treatment by employers. According to data from the Russian Federal Immigration Service, there were 102,658 officially registered labor migrants versus 1.5 million unregistered immigrants from Uzbekistan in Russia in 2006. The total remittances for both groups combined was approximately US$1.3 billion that same year, eight percent of Uzbekistan's GDP. [57]
A significant number of ethnic and national minorities left Uzbekistan after the country became independent, but actual numbers are unknown. The primary reasons for migration by minorities include: few economic opportunities, a low standard of living, and a poor prospect for educational opportunities for future generations. Although Uzbekistan's language law has been cited as a source of discrimination toward those who do not speak Uzbek, this law has intertwined with social, economic, and political factors that have led to migration as a solution to a lack of opportunities in Uzbekistan.
Russians, who constituted a primarily urban population made up half of the population of Tashkent, the capital of Uzbekistan, until the 1980s. Since then, the population has been gradually diminishing as many Russians have migrated to Russia. Nevertheless, Russian registration permits (propiska) constrain migration. [60] The decision to migrate is complicated by the fact that many Russians or other minority groups who have a "homeland" may view Uzbekistan as the "motherland". It is also complicated by the fact that these groups might not speak the national language of their "homeland" or may be registered under another nationality on their passports. Nonetheless, "native" embassies facilitate this migration. Approximately 200 visas are given out to Jews from the Israel embassy weekly. [61]
According to data from the 1989 Soviet census, the population of the USSR was made up of 70% East Slavs and 17% Turkic peoples, with no other single ethnic group making up more than 2%.
Karelians are a Baltic Finnic ethnic group who are indigenous to the historical region of Karelia, which is today split between Finland and Russia. Karelians living in Russian Karelia are considered a distinct ethnic group closely related to Finnish Karelians, who are considered a subset of Finns. This distinction historically arose from Karelia having been fought over and eventually split between Sweden and Novgorod, resulting in Karelians being under different cultural spheres.
The history of the Jews in Armenia is one of the Jewish communities in the Caucasus region. There is evidence of Jewish settlement in the Armenian Highlands dating as early 1st century BC.
The Lom people, also known by non-Loms as Bosha or Posha or as Armenian Romani or Caucasian Romani, are an ethnic group originating from the Indian subcontinent. Their Lomavren language is a mixed language, combining an Indo-Aryan substrate with Armenian.
The following is a summary of censuses carried out in the Soviet Union:
The Elizavetpol Governorate, also known after 1918 as the Ganja Governorate, was a province (guberniya) of the Caucasus Viceroyalty of the Russian Empire, with its capital in Yelisavetpol. The area of the governorate stretched 38,922.43 square versts and was composed of 1,275,131 inhabitants in 1916. The Elizavetpol Governorate bordered the Erivan Governorate to the west, the Tiflis Governorate and Zakatal Okrug to the north, the Dagestan Oblast to the northeast, the Baku Governorate to the east, and Iran to the south.
The Black Sea Governorate was an administrative-territorial unit (guberniya) of the Caucasus Viceroyalty of the Russian Empire, established in 1896 on the territory of the Black Sea Okrug of the Kuban Oblast. The administrative center of the governorate was the Black Sea port of Novorossiysk. In 1905, the population of the governorate was approximately 70,000 and its area was 6,455 square versts, making it the smallest Russian governorate by both measures. The governorate ceased to exist when the Black Sea Soviet Republic was established on its territory in the spring of 1918—later the governorate was incorporated into the Kuban-Black Sea Oblast of the Russian SFSR in March 1920.
Moscow is the most populous city in Europe and Russia, population of which is mostly made up of ethnic Russians, but it also hosts a significant population of ethnic minorities. The last census of 2021 reported 69.7% of the population was Russian.
The Dagestan Oblast was a province (oblast) of the Caucasus Viceroyalty of the Russian Empire. It roughly corresponded to most of present-day southeastern Dagestan within the Russian Federation. The Dagestan oblast was created in 1860 out of the territories of the former Caucasian Imamate, bordering the Terek Oblast to the north, the Tiflis Governorate and Zakatal Okrug to the west, the Elizavetpol Governorate to the south, and Baku Governorate to the east. The administrative center of the oblast was Temir-Khan-Shura.
The Kuban oblast was a province (oblast) of the Caucasus Viceroyalty of the Russian Empire. It roughly corresponded to most of the Kuban and Circassia regions. It was created in 1860 out of Kuban Cossack territories that had once been part of the Crimean Khanate and the land of the Circassians. It was dissolved upon the assumption of supreme authority by the Kuban Rada in 1917 and the independence of the Kuban People's Republic in 1918. Its capital was the city of Yekaterinodar.
The Terek Oblast was a province (oblast) of the Caucasus Viceroyalty of the Russian Empire, roughly corresponding to the central part of Russia's North Caucasian Federal District. Тhe оblast was created out of the former territories of the North Caucasian Peoples, following their conquests by Russia throughout the 19th century. The Terek Oblast bordered the Astrakhan and Stavropol governorates to the north, the Kuban Oblast to the west, the Kutaisi and Tiflis governorates to the south, and the Dagestan Oblast to the east. The administrative center of the oblast was Vladikavkaz, the current capital of North Ossetia–Alania within Russia.
Russians in Uzbekistan comprised the country's second-largest ethnic group after Uzbeks, numbering 1,653,478, in 1989 representing 5.5% of the population. During the Soviet period, Russians constituted more than half the population of the capital city, Tashkent. Uzbekistan counted nearly 1.5 million Russians, 12.5% of the population, in the 1970 census.
The 1959 Soviet census conducted in January 1959 was the first post-World War II census held in the Soviet Union.
The Soviet census conducted in January 1970 was the first census held in Soviet Union (USSR) in eleven years.
In January 1979, the Soviet Union conducted its first census in nine years. Between 1970 and 1979, the total Soviet population increased from 241,720,134 to 262,084,654, an increase of 8.4%.
The census in Azerbaijan is a process of collecting, summarizing, analyzing and publishing the demographic, economic and social data of the population living in the territory of Azerbaijan. The next census in the Republic is expected to be held in 2029.
The Noyemberyan District was a raion (district) of the Armenian Soviet Socialist Republic from 1937 to 1991 and of the Republic of Armenia from 1991 to 1995. It now constitutes the northeastern part of the Tavush Province (marz) of Armenia. Its administrative center was the town of the same name.
Pink Ukraine is a region in Kuban with a significant Ukrainian population.
The Tajiks of Uzbekistan are ethnic Tajiks residing in the Republic of Uzbekistan. They constitute about 5% of the total population, though some estimates suggest the actual number is significantly higher. Samarkand, the third-largest city in Uzbekistan, and the ancient city of Bukhara both have Tajik majority populations.
{{cite web}}
: CS1 maint: archived copy as title (link){{cite web}}
: CS1 maint: archived copy as title (link)