The population of Iranian provinces and counties in 2021.
Iran's population increased dramatically in the late 20th century, reaching about 100 million by late 2012.[13][14]As of 2025[update], Iran's population is around 137.2 million.[15] In recent years, however, Iran's birth rate has dropped significantly. Studies project that Iran's rate of population growth will continue to slow until it stabilises above 140 million by 2027.[16][17] Half of Iran's population was under 35 years old in 2012.[18] In January 2025, the average age of the Iranian population is 32 years.[19]
In 2009, the number of households stood at 15.3 million, at 4.8 persons per household.[20] In 2012, the average family income was 11.8million rials (about $960) per month.[21]
Between 1990 to 2008 Iran's population grew by 17.6million, an increase of 32%.[22] The literacy rate was 80% in 2002,[23][24] and 85% in 2016.[25] The 2021 fertility rate was 1.44, below the natural replacement rate of 2.1.[26]
Population
Iran's population history
In the 2016 census Iran's population was 79.9million,[13] a fourfold increase since 1956. Between 1976 and 1986, an average annual population growth of almost 4% was reached. Due to decreasing fertility levels the growth decreased to 1.2% between 2011 and 2016.
Population Estimates by Sex and Age Group (01.VII.2020) Data refers to the Iranian Year which begins on 21 March and ends on 20 March of the following year.[28]
Age group
Male
Female
Total
%
Total
42,484,186
41,553,414
84,037,600
100
0–4
3,751,160
3,584,640
7,335,800
8.73
5–9
3,644,823
3,453,109
7,097,932
8.45
10–14
3,195,837
3,043,160
6,238,997
7.42
15–19
2,850,201
2,723,069
5,573,270
6.63
20–24
2,817,236
2,715,743
5,532,979
6.58
25–29
3,398,106
3,322,934
6,721,040
8.00
30–34
4,246,233
4,166,179
8,412,412
10.01
35–39
4,226,366
4,147,771
8,374,137
9.96
40–44
3,375,662
3,271,031
6,646,693
7.91
45–49
2,687,892
2,591,386
5,279,278
6.28
50–54
2,321,552
2,270,429
4,591,981
5.46
55–59
1,841,337
1,847,872
3,689,209
4.39
60–64
1,510,299
1,557,919
3,068,218
3.65
65–69
1,058,091
1,138,129
2,196,220
2.61
70–74
640 098
748 890
1,388,988
1.65
75–79
415 623
459 393
875 016
1.04
80+
503 670
511 760
1,015,430
1.21
Age group
Male
Female
Total
Percent
0–14
10,591,820
10,080,909
20,672,729
24.60
15–64
29,274,884
28,614,333
57,889,217
68.88
65+
2,617,482
2,858,172
5,475,654
6.52
Year
0–14
15–64
65+
1976
44.5
52
3.5
1985
45.5
51.5
3
1996
39.5
56.1
4.3
2006
25.1 (17,681,629)
69.7 (49,157,562)
5.2 (3,656,591)
2011
23.4 (17,561,778)
70.9 (53,297,122)
5.7 (4,290,769)
2016
24.0 (19,192,665)
69.9 (55,862,087)
6.1 (4,871,518)
Table 9 – Population and Average Annual Growth by Provinces: 2006 and 2011
Province
2006
2011
Average annual growth
Alborz
2,076,991
2,412,513
3.04
Ardabil
1,228,155
1,248,488
0.33
Bushehr
886,267
1,032,949
3.11
Chaharmahal and Bakhtiari
857,910
895,263
0.86
East Azerbaijan
3,603,456
3,724,620
0.66
Fars
4,336,878
4,596,658
1.17
Gilan
2,404,861
2,480,874
0.62
Golestan
1,617,087
1,777,014
1.90
Hamadan
1,703,267
1,758,268
0.64
Hormozgan
1,403,674
1,578,183
2.37
Ilam
545,787
557,599
0.43
Isfahan
4,559,256
4,879,312
1.37
Kerman
2,652,413
2,938,988
2.07
Kermanshah
1,879,385
1,945,227
0.69
Khuzestan
4,274,979
4,531,720
1.17
Kohgiluyeh and Boyer-Ahmad
634,299
658,629
0.76
Kurdistan
1,440,156
1,493,645
0.73
Lorestan
1,716,527
1,754,243
0.44
Markazi
1,351,257
1,413,959
0.91
Mazandaran
2,922,432
3,073,943
1.02
North Khorasan
811,572
867,727
1.35
Qazvin
1,143,200
1,201,565
1.00
Qom
1,046,737
1,151,672
1.93
Razavi Khorasan
5,593,079
5,994,402
1.40
Semnan
589,742
631,218
1.37
Sistan and Baluchestan
2,405,742
2,534,327
1.05
South Khorasan
636,420
662,534
0.81
Tehran
11,345,375
12,183,391
1.44
West Azerbaijan
2,873,459
3,080,576
1.40
Yazd
990,818
1,074,428
1.63
Zanjan
964,601
1,015,734
1.04
Total
70,495,782
75,149,669
1.29
1 The population of the provinces of Alborz and Tehran for 2006 and their average annual growth have been calculated based on the data of 2011.
Unofficial Translation 17
Table 10 – Population Percentages by Province: 2006 and 2011 (Percentage)
Iran's provinces by 2013 population density
Province
2006
2011
Alborz
2.95
3.21
Ardabil
1.74
1.66
Bushehr
1.26
1.37
Chaharmahal and Bakhtiari
1.22
1.19
East Azerbaijan
5.11
4.96
Fars
6.15
6.12
Gilan
3.41
3.30
Golestan
2.29
2.36
Hamadan
2.42
2.34
Hormozgan
1.99
2.10
Ilam
0.77
0.74
Isfahan
6.47
6.49
Kerman
3.76
3.91
Kermanshah
2.67
2.59
Khuzestan
6.06
6.03
Kohgiluyeh and Boyer-Ahmad
0.90
0.88
Kurdistan
2.04
1.99
Lorestan
2.43
2.33
Markazi
1.92
1.88
Mazandaran
4.15
4.09
North Khorasan
1.15
1.15
Qazvin
1.62
1.60
Qom
1.48
1.53
Razavi Khorasan
7.93
7.98
Semnan
0.84
0.84
Sistan and Baluchestan
3.41
3.37
South Khorasan
0.90
0.88
Tehran
16.09
16.21
West Azerbaijan
4.08
4.10
Yazd
1.41
1.43
Zanjan
1.37
1.35
Total
100
100
1 The population of the provinces of Alborz and Tehran for 2006 and their average annual growth have been calculated based on the data of 2011.
Iran has one of the steepest urban growth rates in the world. In 2015, approximately 73.4 per cent of Iran's population lived in urban areas, up from 27 per cent in 1950.[29]
The following is a list of the eight most populous cities in Iran:
1 per 1000 2 TFR = number of children per woman 3 per 1000 births
Registered births and deaths
[33][34][35] Note that registrations may be by year of registration and not by year of occurrence. This was especially the case in the beginning of the 1980s when there were many late registrations. This explains the high number of births during 1980-1986. Before 1980, the registrations were incomplete.
In 1960, Iran's fertility rate was 7.3 children per woman. In 2021, the rate had fallen to 1.7 children per woman.[39] According to a study through the Australian National University, there are both micro and macro factors affecting the fertility rate in Iran, including education, economics, and culture.[40] Micro-factors can include family income levels and individual choices, while macro-factors can include the country's economy, education, and shifting cultural values.[40]
The cross-sectional cohort study examined four provinces in Iran (Gilan, Sistan & Baluchistan, West Azerbaijan, and Yazd) and found that trends show that women in all four provinces are choosing to have fewer children compared to the women born in the earlier cohorts. The majority of women agreed with statements such as "having many children is an obstacle for the parents' interests" and "having many children creates financial pressure for the family", among others.[40]
Other sources also suggest that delayed marriage and a tendency to limit fertility are factors affecting the decline of TFR.[41] A decline in TFR can lead to population decrease, and an ageing population, which can negatively impact the country's economy.[42] In response, Iranian policymakers have attempted to limit these factors by restricting access to contraceptives and surgeries that reduce fertility.[43]
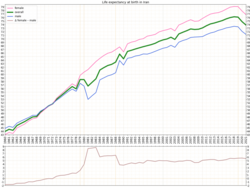
Life expectancy
Life expectancy in Iran since 1950Life expectancy in Iran since 1960 by gender
This section needs expansionwith: the table which can be expanded with the source provided. You can help by adding missing information. (December 2024)
Y-Chromosome DNA Y-DNA represents the male lineage, the Iranian Y-chromosome pool is as follows where haplogroups, R1 (25%), J2 (23%) G (14%), J1 (8%) E1b1b (5%), L (4%), Q (4%), comprise more than 85% of the total chromosomes.[47][48]
Mitochondrial DNA (mtDNA) represents the female lineage. West Eurasian mtDNA makes up over 90% of the Iranian population on average. (2013).[50]
Among them, U3b3 lineages appear to be restricted to populations of Iran and the Caucasus, while the sub-cluster U3b1a is common in the whole Near East region.[50]
In Iran outliers in the Y-chromosomes and Mitochondrial DNA gene pool are consisted of the north Iranian ethnicities, such as the Gilaks and Mazandarani's, whose genetic build up including chromosomal DNA are nearly identical to the major South Caucasian ethnicities, namely the Georgians, Armenians and Azerbaijani's. Other outliers are made by the Baloch people, representing a mere 1–2% of the total Iranian population, who have more patrilinial and mitochondrial DNA lines leaning towards northwest South Asian ethnic groups.
Levels of genetic variation in Iranian populations are comparable to the other groups from the Caucasus, Anatolia and Europe.[50]
Autosomal DNA
A large-scale genetic analyses on various ethnic groups of Iran, published in 2019, found that genetically speaking different Iranian ethnic groups, such as Persians, Kurds, Azerbaijanis, Lurs, Mazanderanis, Gilaks and Arabs, cluster tightly together, forming a single cluster known as the "CIC" (Central Iranian cluster). Compared with worldwide populations, Iranians (CIC) cluster in the center of the wider West Eurasian cluster, close to Europeans, Middle Easterners, and South-Central Asians. Iranian Arabs and Turkic-speaking Azeris genetically overlap with Iranian-speaking peoples such as Persians. The genetic substructure of Iranians was found to be low, compared with other "1000G" populations. Iranians display their highest genetic affinity with other Southwest and West Asian populations, followed by Europeans and Central Asian groups. Certain South Asians (specifically the Parsi minority) showed the highest affinity with Iranians, inline with their ethnic history. Overall, the study results suggest that the genetic makeup of the Iranian gene pool formed already about 5,000 years ago and shows high continuity since then, suggesting that they were largely unaffected by migration events from outside groups. On a global scale, Iranians display their highest affinity with other "West Eurasian" populations (such as Europeans or South Asians, but also Latin Americans), while Sub-Saharan Africans and East Asians showed large degrees of differentiation with Iranians.[51]
Jews have had a continuous presence in Iran since the time of Cyrus the Great of the Achaemenid Empire. In 1948, there were approximately 140,000–150,000 Jews living in Iran. According to the Tehran Jewish Committee, the Jewish population of Iran was (more recently) estimated at 25,000 to 35,000, of which approximately 15,000 are in Tehran with the rest residing in Hamadan, Shiraz, Isfahan, Kermanshah, Yazd, Kerman, Rafsanjan, Borujerd, Sanandaj, Tabriz, and Urmia. However, the official 2011 state census recorded only 8,756 Jews in Iran.[54]
According to anthropologist Brian Spooner, around half of Iran's population uses a language other than Persian at home and in informal public situations.[56]
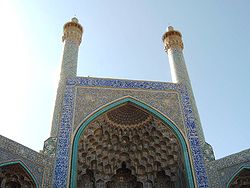
The entrance to Shah Mosque (aka Imam Mosque or Shah Jame' Mosque) in Isfahan. This mosque is a prominent example of Persian architecture during the Safavid dynasty.
About 99% of the Iranians are Muslims; 90% belong to the Shi'a branch of Islam, the official state religion, and about 9% belong to the Sunni branch, which predominates in neighbouring Muslim countries.[24] Less than 1% non-Muslim minorities include Christians, Zoroastrians, Jews, Baháʼís, Mandaeans, and Yarsan. By far the largest group of Christians in Iran are Armenians under the Armenian Apostolic Church which has 41,385 adherents as of 2016 census.[59] There are hundreds of Christian churches in Iran.[citation needed] The Baháʼí Faith, Iran's largest non-Muslim religious minority with a population around 300,000, is not officially recognised (and therefore not included in the census results), and has been persecuted since its inception in Iran. Since the 1979 revolution the persecution of Baháʼís has increased with executions, the denial of civil rights and liberties, and the denial of access to higher education and employment.[60][61] Unofficial estimates for the Assyrian Christian population range between 20,000,[62][63] and 70,000.[64][65] The number of Iranian Mandaeans is a matter of dispute. In 2009, there were an estimated 5,000 to 10,000 Mandaeans in Iran, according to the Associated Press.[66] Whereas Alarabiya has put the number of Iranian Mandaeans as high as 60,000 in 2011.[67]
Population of Iran according to religion 1956–2016[27][33][68]
In the 20th to 21st centuries, there has been limited immigration to Iran from Turkey, Iraq (especially huge numbers during the 1970s known as Moaveds), Afghanistan (mostly arriving as refugees in 1978), Lebanon (especially in Qom, though a Lebanese community has been present in the nation for centuries), India (mostly arriving temporarily during the 1950s to 1970s, typically working as doctors, engineers, and teachers), Korea (mostly in the 1970s as labour migrants), China (mostly since the 2000s working in engineering or business projects), and Pakistan, partly due to labour migrants and partly to Balochi ties across the Iranian-Pakistani border. About 200,000 Iraqis arrived as refugees in 2003,[citation needed] mostly living in refugee camps near the border; an unknown number of these has since returned to Iraq.
As of 2025, around 400,000 authorized foreigners were working in Iran, most of whom were Afghan nationals.[69]
Iran hosts one of the largest refugee population in the world, with more than one million refugees, mostly from Afghanistan (80%) and Iraq (10%). Since 2006, Iranian officials have been working with the UNHCR and Afghan officials for their repatriation.[70][71] Between 1979 and 1997, UNHCR spent more than US$1billion on Afghan refugees in Pakistan but only $150million on those in Iran. In 1999, the Iranian government estimated the cost of maintaining its refugee population at US$10million per day, compared with the US$18million UNHCR allocated for all of its operations in Iran in 1999.[71] As of 2016, some 300,000 work permits have been issued for foreign nationals in Iran.[72]
In mid-2025, Iran's government ordered the mass deportation of undocumented Afghans, targeting an estimated 4 million migrants and refugees residing in the country.[73] Iranian authorities expelled approximately 1.6 million undocumented Afghan migrants between January and October 2025.[74]
The term "Iranian citizens abroad" or " Iranian/Persian diaspora" refers to the Iranian people and their children born in Iran but living outside of Iran. Migrant Iranian workers abroad remitted less than two billion dollars home in 2006.[75]
The Parsis are the close-knit Zoroastrian community based primarily in India but also found in Pakistan. Parsis are descended from Persian Zoroastrians who emigrated to the Indian subcontinent over 1,000 years ago. Indian census data (2001) records 69,601 Parsis in India, with a concentration in and around the city of Mumbai. There are approximately 8,000 Parsis elsewhere on the subcontinent, with an estimated 2,500 Parsis in the city of Karachi and approximately 50 Parsi families in Sri Lanka. The number of Parsis worldwide is estimated to be fewer than 100,000.[88]
In Pakistan and India, the term "Irani" has come to denote IranianZoroastrians who have migrated to Pakistan and India within the last two centuries, as opposed to most Parsis who arrived in India over 1,000 years ago. Many of them moved during the Qajar era, when persecution of Iranian Zoroastrians was rampant. They are culturally and linguistically closer to the Zoroastrians of Iran. Unlike the Parsis, they speak a Dari dialect, the language spoken by the Iranian Zoroastrians in Yazd and Kerman.[89]
Their last names often resemble modern Iranian names. Irani is a common surname among them. In India they are mostly located in modern-day Mumbai while in Pakistan they are mostly located in modern-day Karachi. In both Pakistan and India, they are famous for their restaurants and tea-houses.[90] Some, such as Ardeshir Irani, have also become very famous in cinema.
The "Ajam" are an ethnic community of Bahrain, of Iranian origin. They have traditionally been merchants living in specific quarters of Manama and Muharraq. The Iranians who adhere to Shiite sect of Islam are Ajam, and they are different from the Huwala. Ajams are also a large percentage of the populace in UAE, Kuwait, Qatar and Oman.
In addition to this, many names of ancient villages in Bahrain are of Persian origin. It is believed that these names were given during the Safavid rule of Bahrain (1501–1722). i.e. Karbabad, Salmabad, Karzakan, Duraz, Barbar, which indicates that the history of Ajams is much older.
Huwala are the descendants of Persians and Arab-Persians who belong to the Sunni sect of Islam.[91] Huwala migrated from Ahvaz in Iran to the Persian Gulf in the seventeenth and eighteenth century.[91][92]
↑Regueiro, M.; Cadenas, A.M.; Gayden, T.; Underhill, P.A.; Herrera, R.J. (2006). "Iran: Tricontinental Nexus for Y-Chromosome Driven Migration". Human Heredity. 61 (3): 132–143. doi:10.1159/000093774. PMID16770078.
↑Nasidze, I.; Quinque, D.; Rahmani, M.; Alemohamad, S. A.; Stoneking, M. (March 2008). "Close Genetic Relationship Between Semitic-speaking and Indo-European-speaking Groups in Iran". Annals of Human Genetics. 72 (2): 241–252. doi:10.1111/j.1469-1809.2007.00413.x. PMID18205892.
↑Mehrjoo, Zohreh; Fattahi, Zohreh; Beheshtian, Maryam; Mohseni, Marzieh; Poustchi, Hossein; Ardalani, Fariba; Jalalvand, Khadijeh; Arzhangi, Sanaz; Mohammadi, Zahra; Khoshbakht, Shahrouz; Najafi, Farid (24 September 2019). "Distinct genetic variation and heterogeneity of the Iranian population". PLOS Genetics. 15 (9) e1008385. doi:10.1371/journal.pgen.1008385. PMC6759149. PMID31550250. Seven groups (Iranian Arabs, Azeris, Gilaks, Kurds, Mazanderanis, Lurs and Persians) strongly overlapped in their overall autosomal diversity in an MDS analysis (Fig 1B), suggesting the existence of a Central Iranian Cluster (CIC), notably also including Iranian Arabs and Azeris. On a global scale (Fig 2 including 'Old World' populations only; see S2 Fig for all 1000G populations), CIC Iranians closely clustered with Europeans, while Iranian Turkmen showed similar yet distinct degrees of admixture compared to other South Asians. A local comparison corroborated the distinct genetic diversity of CIC Iranians relative to other geographically close populations [2, 6, 44] (Fig 3 and S3 Fig). Still, genetic substructure was much smaller among Iranian groups than in relation to any of the 1000G populations, supporting the view that the CIC groups form a distinct genetic entity, despite internal heterogeneity. European (FST~0.0105–0.0294), South Asians (FST~0.0141–0.0338), but also some Latin American populations (Puerto Ricans: FST~0.0153–0.0228; Colombians: FST~0.0170–0.0261) were closest to Iranians, whereas Sub-Saharan Africans and admixed Afro-Americans (FST~0.0764–0.1424) as well as East Asians (FST ~ 0.0645–0.1055) showed large degrees of differentiation with Iranians.
↑See Iran in Encyclopedia of Islam, Leiden. C.E. Bosworth (editor)
↑Curtis, Glenn E.; Hooglund, Eric (May 2008). "Country Profile: Iran"(PDF). Library of Congress – Federal Research Division. p.5. Archived(PDF) from the original on 27 September 2015. Retrieved 2 December 2009.
↑Khanam, R. (2005). Encyclopaedic Ethnography of Middle-East and Central Asia. Global Vision Publishing House. p.746. ISBN978-81-8220-065-4. The contemporary Tats are the descendants of an Iranian-speaking population sent out of Persia by the dynasty of the Sasanids in the fifth to sixth centuries.
↑Masti︠u︡gina, T. M.; Perepelkin, Lev (1996). An Ethnic History of Russia: Pre-Revolutionary Times to the Present. Bloomsbury Academic. p.80. ISBN978-0-313-29315-3.
↑V. Minorsky, "Tat" in M. Th. Houtsma et al., eds., The Encyclopædia of Islam: A Dictionary of the Geography, Ethnography and Biography of the Muhammadan Peoples, 4 vols. and Suppl., Leiden: Late E.J. Brill and London: Luzac, 1913–38.
↑V. Minorsky, "Tat" in M. Th. Houtsma et al., eds., The Encyclopædia of Islam: A Dictionary of the Geography, Ethnography and Biography of the Muhammadan Peoples, 4 vols. and Suppl., Leiden: Late E.J. Brill and London: Luzac, 1913–38. Excerpt: Like most Persian dialects, Tati is not very regular in its characteristic features"
↑Kerslake, C. (January 2010). "Turkic-Iranian Contact Areas: Historical and Linguistic Aspects * Edited by LARS JOHANSON and CHRISTIANE BULUT". Journal of Islamic Studies. 21 (1): 147–151. doi:10.1093/jis/etp078. It is a comparison of the verbal systems of three varieties of Persian—standard Persian, tat, tajik
↑Borjian, Habib (2006). "Tabari Language Materials from Il'ya Berezin's Recherches sur les dialectes persans". Iran and the Caucasus. 10 (2): 243–258. doi:10.1163/157338406780346005. It embraces Gilani, Ta- lysh, Tabari, Kurdish, Gabri, and the Tati Persian of the Caucasus, all but the last belonging to the north-western group of Iranian language.
This page is based on this Wikipedia article Text is available under the CC BY-SA 4.0 license; additional terms may apply. Images, videos and audio are available under their respective licenses.