The specific ethnic and/or racial composition varies from country to country and diaspora community to diaspora community: many have a predominance of mixed indigenous and European descent or mestizo, population; in others, Indigenous Amerindians are a majority; some are mostly inhabited by people of European ancestry; others are primarily mulatto.[19][25] The largest single group are white Latin Americans.[19] Together with the people of part European ancestry, they combine for almost the totality of the population.[19]
Latin Americans and their descendants can be found almost everywhere in the world, particularly in densely populated urban areas. The most important migratory destinations for Latin Americans are found in the United States, Spain, France, Canada, Italy and Japan.
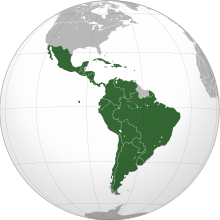
The population of Latin America comprises a variety of ancestries, ethnic groups and races, making the region one of the most diverse in the world. The specific composition varies from country to country: many have a predominance of mixed European and Amerindian, or mestizo, population; in others, Amerindians are a majority; some are dominated by inhabitants of European ancestry; and some countries' populations are primarily mulatto. White Latin Americans are the largest single group, accounting for more than one-third of the population. Black, Asian, and zambo (mixed black and Amerindian) minorities are also identified regularly.[19][32]
Mestizos: Intermixing between Europeans and Amerindians began early in the colonial period and was extensive. The resulting people, known as mestizos, make up the majority of the population in half of the countries of Latin America. Additionally, mestizos comprise large minorities in nearly all the other mainland countries.
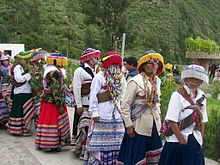
Amerindians: The indigenous population of Latin America arrived during the Lithic stage. In post-Columbian times, they experienced tremendous population decline, particularly in the early decades of colonization. They have since recovered in numbers, surpassing sixty million (by some estimates[32]), though, with the growth of the other groups, they now comprise a majority only in Bolivia. In Guatemala, Amerindians are a large minority that comprises 41% of the population.[36]Mexico's 21% (9.8% in the official 2005 census) is the next largest ratio, and one of the largest indigenous population in the Americas in absolute numbers. Most of the remaining countries have Amerindians minorities, in every case making up less than one-tenth of the respective country's population. In many countries, people of mixed indigenous and European ancestry, known as mestizos, make up the majority of the population.
Asians: People of Asian descent number several million in Latin America. The majority of Asian descendants in the country are either of West Asian (such as Lebanese or Syrian) or East Asian (like Chinese or Japanese) descent.[37] The first Asians to settle in the region were Filipino, as a result of Spain's trade involving Asia and the Americas. The Brazilian Institute of Geography and Statistics states that the country's largest Asian communities are from West Asia and East Asia.[38] It is estimated that 7 to 10 million Brazilians are of Lebanese descent.[39][40] Around 2 million Brazilians self-identify as being "Yellow" (amarela or of East Asian descent) according to the 2010 census.[41] The country is home to the largest ethnic Japanese community outside Japan itself, estimated as high as 1.5 million, and circa 200,000 ethnic Chinese and 100,000 ethnic Koreans.[42][43] Ethnic Koreans also number tens of thousands of individuals in Argentina and Mexico.[44] The 2017 census stated that under 40,000 Peruvians self-identified as having Chinese or Japanese ancestry.[45] Though other estimates claim as much as 1.47 million people of East Asian descent reside in the country.[46][47] Lebanese and Syrian descendants have also formed notable communities in countries like Mexico and Argentina.[48] The Martiniquais population includes a mixed African, European and Amerindian descent, and an East Indian (Asian Indian) population is also present in Martinique.[49] In Guadeloupe, an estimated 14% of the population is of East Asian descent.
Mulattoes: Mulattoes are people of mixed European and African ancestry, mostly descended from Spanish, Portuguese, or French settlers on one side and African slaves on the other, during the colonial period. Brazil is home to Latin America's largest mulatto population. Mulattoes form a majority in the Dominican Republic and are also numerous in Cuba, Puerto Rico, Nicaragua, Panama, Peru, Colombia, and Ecuador. Smaller populations of mulattoes are found in other Latin American countries.[32]
Blacks: Millions of African slaves were brought to Latin America from the 16th century onward, most of whom were sent to the Caribbean region and Brazil. Today, people identified as "black" are most numerous in Brazil (more than 20 million).[50] Significant populations are also found in Cuba, Dominican Republic, Puerto Rico, Panama and Colombia. Latin Americans of mixed black and white ancestry, called mulattoes, are far more numerous than blacks.
Zambos: Intermixing between blacks and Amerindians was especially prevalent in Colombia and Brazil, often due to slaves running away (becoming cimarrones: maroons) and being taken in by indigenous villagers. In Spanish-speaking nations, people of this mixed ancestry are known as zambos,[51] and they are also known as cafuzos in Brazil.
The Latinobarómetro surveys have asked respondents in 18 Latin American countries what race they considered themselves to belong to. The figures shown below are averages for 2007 through 2011.[54]
1Don't know/No response. 2Weighted using 2011 population.
Language
Linguistic map of Latin America. Spanish in green, Portuguese in orange, and French in blue.
Spanish and Portuguese are the predominant languages of Latin America. Spanish is the official language of most of the countries on the Latin American mainland, as well as in Puerto Rico (where it is co-official with English), Cuba and the Dominican Republic. Portuguese is spoken only in Brazil, the biggest and most populous country in the region. French is spoken in Haiti, as well as in the French overseas departments of French Guiana in South America and Guadeloupe and Martinique in the Caribbean. Dutch is the official language of some Caribbean islands and in Suriname on the continent; however, as Dutch is a Germanic language, these territories are not considered part of Latin America.
In Peru, Quechua is an official language, alongside Spanish and any other indigenous language in the areas where they predominate. In Ecuador, while holding no official status, the closely related Quichua is a recognized language of the indigenous people under the country's constitution; however, it is only spoken by a few groups in the country's highlands. In Bolivia, Aymara, Quechua and Guaraní hold official status alongside Spanish. Guarani is, along with Spanish, an official language of Paraguay, and is spoken by a majority of the population (who are, for the most part, bilingual), and it is co-official with Spanish in the Argentine province of Corrientes. In Nicaragua, Spanish is the official language, but, on the country's Caribbean coast English and indigenous languages such as Miskito, Sumo, and Rama also hold official status. Colombia recognizes all indigenous languages spoken within its territory as official, though fewer than 1% of its population are native speakers of these. Nahuatl is one of the 62 native languages spoken by indigenous people in Mexico that are officially recognized by the government as "national languages" along with Spanish.
Other European languages spoken in Latin America include: English, by some groups in Argentina, Chile, Costa Rica, Nicaragua, Panama and Puerto Rico, as well as in nearby countries that may or may not be considered Latin American, such as Belize and Guyana; English is also used as a major foreign language in Latin American commerce and education. Other languages spoken in parts of Latin America include German in southern Brazil, southern Chile, Argentina, portions of northern Venezuela and Paraguay; Italian in Brazil, Argentina, Uruguay and Venezuela; Polish, Ukrainian and Russian in southern Brazil; and Welsh[55][56][57][58][59][60] in southern Argentina. Hebrew and Yiddish are used by Jewish diasporas in Argentina and Brazil.
In several nations, especially in the Caribbean region, creole languages are spoken. The most widely spoken creole language in the Caribbean in general is Haitian Creole, the predominant language of Haiti; it is derived primarily from French and certain West African tongues with indigenous, English, Portuguese and Spanish influences as well. The other most spoken Creole is Antillean Creole French that is primarily spoken in the Lesser Antilles. It is a French-based creole, that is the local language spoken among the natives of the Caribbean islands of Saint Lucia and Dominica and also in Martinique and Guadeloupe. Creole languages of mainland Latin America, similarly, are derived from European languages and various African tongues.
According to the 2005 Colombian census or DANE, about 3,331,107 Colombians currently live abroad.[71] The number of Brazilians living overseas is estimated at 2 million people.[72] An estimated 1.5 to two million Salvadorians reside in the United States.[73] At least 1.5 million Ecuadorians have gone abroad, mainly to the United States and Spain.[74] Approximately 1.5 million Dominicans live abroad, mostly in the United States.[75] More than 1.3 million Cubans live abroad, most of them in the United States.[76] It is estimated that over 800,000 Chileans live abroad, mainly in Argentina, Canada, United States and Spain. Other Chilean nationals may be located in countries like Costa Rica, Mexico and Sweden.[77] An estimated 700,000 Bolivians were living in Argentina as of 2006 and another 33,000 in the United States.[78] Central Americans living abroad in 2005 were 3,314,300,[79] of which 1,128,701 were Salvadorans,[80] 685,713 were Guatemalans,[81] 683,520 were Nicaraguans,[82] 414,955 were Hondurans,[83] 215,240 were Panamanians[84] and 127,061 were Costa Rica.[85]
As of 2006, Costa Rica and Chile were the only two countries with global positive migration rates.[86]
↑ Pozzetta, George E., Bruno Ramirez and Robert F. Harney. The Italian Diaspora: Migration across the Globe. Toronto: Multicultural History Society of Ontario, 1992.
↑ King, Russell (1978-01-01). "Report: The Italian Diaspora". Area. 10 (5): 386. JSTOR20001401.
↑ Wilhelm Bleek (2003). "Auslandsdeutsche"[Germans abroad] (in German). German Federal Agency for Civic Education. Archived from the original on 2011-03-10.
↑ Rangel, Carlos (1977). The Latin Americans: Their Love-Hate Relationship with the United States. New York: Harcourt Brace Jovanovich. pp.3–5. ISBN0-15-148795-2.Skidmore, Thomas E.; Peter H. Smith (2005). Modern Latin America (6ed.). Oxford and New York: Oxford University Press. pp.1–10. ISBN0-19-517013-X.
↑ Departamento de Derecho y Ciencias Políticas de la Universidad Nacional de La Matanza (14 November 2011). "Historias de inmigrantes italianos en Argentina" (in Spanish). infouniversidades.siu.edu.ar. Se estima que en la actualidad, el 90% de la población argentina tiene alguna ascendencia europea y que al menos 25 millones están relacionados con algún inmigrante de Italia.
↑ Lizcano Fernández, Francisco. "Composición Étnica de las Tres Áreas Culturales del Continente Americano al Comienzo del Siglo XXI"[Ethnic Composition of the Three Cultural Areas of the American Continent at the Beginning of the 21st Century](PDF). Convergencia. Revista de Ciencias Sociales (in Spanish). Toluca, México: Universidad Autónoma del Estado de México: 194–195. Archived from the original(PDF) on 26 June 2013. En principio, se pueden distinguir dos grupos muy distintos al interior de esta etnia: el que procede de Asia occidental (sobre todo árabes cristianos llegados desde Siria y Líbano) y el que salió de Asia oriental (chinos y japoneses principalmente).
↑ "Cor ou Raça"(PDF). Censo Demográfico 2010: Características gerais da população, religião e pessoas com deficiência. Instituto Brasileiro de Geografia e Estatística. 2010. Retrieved 5 October 2013.
This page is based on this Wikipedia article Text is available under the CC BY-SA 4.0 license; additional terms may apply. Images, videos and audio are available under their respective licenses.