| Country or entity | Christians [a] | % Christian [b] | % Catholic [b] | % Protestant / Orthodox / Other Christian [b] |
|---|
 Afghanistan (details) Afghanistan (details) | 6,250/8,000 [22] – 30,000 [23] | 0.02% [23] | | |
 Albania (details) Albania (details) | 384,833 [24] | 19.0% | 10.0% | 9.0% |
 Algeria (details) Algeria (details) | 20,000 – 200,000 [25] or 71,000 (estimate for 2010) [26] | 0.01% | 0.01% | 1.0%
[ figures disagree ] |
 American Samoa (details) American Samoa (details) | 70,000 | 98.3% | 20.0% | |
 Andorra (details) Andorra (details) | 78,000 | 89.5% | 88.2% [27] | 1.3% |
 Angola (details) Angola (details) | 27,285,828 [28] | 79.1% | 44.2% [28] | 34.9% [28] |
 Anguilla (details) Anguilla (details) | 15,000 | 90.5% | 3.0% | 87.0% |
 Antigua and Barbuda (details) Antigua and Barbuda (details) | 70,183 | 87.6% [29] | 8.6% | 79.0% |
 Argentina (details) Argentina (details) | 34,940,108 | 77.0% [30] | 66.0% [30] | 11.0% [30] |
 Armenia (details) Armenia (details) | 2,645,110 [31] | 98.6% | 0.6% | 98.0% |
 Aruba (details) Aruba (details) | 83,128 [32] | 82.3% | 75.7% | 6.6% |
 Australia (details) Australia (details) | 11,148,814 [33] | 43.9% [33] | 20% [33] | 24% [33] |
 Austria (details) Austria (details) | 6,093,700 [34] | 68.2% [34] | 50% [35] [36] - 55.2% [34] | 3.0% – 7.0% [37] [38] |
 Azerbaijan (details) Azerbaijan (details) | 280,000 [39] | 3.1% | | 3.1% |
 Bahamas (details) Bahamas (details) | 335,975 | 95.0% [40] | 12.0% | 83.0% |
 Bahrain (details) Bahrain (details) | 185,000 | 15.0% [41] | | 9.0% |
 Bangladesh (details) Bangladesh (details) | 488,583 [42] | 0.3% | | |
 Barbados (details) Barbados (details) | 244,000 | 74.0% [43] [44] | 4.2% | 70.0% |
 Belarus (details) Belarus (details) | 5,265,000 | 55.4% [45] | 7.1% | 48.3% |
 Belgium (details) Belgium (details) | 4,021,000 – 5,795,000 | 34% [46] [47] – 49% [48] | 31% [46] [47] – 44% [48] | 3% [46] [47] – 5% [48] |
 Belize (details) Belize (details) | 244,859 [49] | 62.2% | 32.2% | 30.0% |
 Benin (details) Benin (details) | 5,570,000 | 48.5% [50] [51] | 25.5% | 23.0% |
 Bermuda (details) Bermuda (details) | 37,688 [52] | 61.1% | 15.1% | 46.0% |
 Bhutan (details) Bhutan (details) | 7,000 | 1.0% | 0.1% | 0.9% |
 Bolivia (details) Bolivia (details) | 9,730,000 | 89.0% | 76.0% | 13.0% |
 Bosnia and Herzegovina (details) Bosnia and Herzegovina (details) | 1,622,093 [53] | 45.94% [53] | 15.19% [53] | 30.75% [53] |
 Botswana (details) Botswana (details) | 1,416,000 | 71.6% | 5.0% | 66.0% |
 Brazil (details) Brazil (details) | 147,634,177 [54] | 83.7% | 56.8% | 26.9% |
 British Virgin Islands (details) British Virgin Islands (details) | 22,951 [55] | 83.9% | 9.0% | 74.9% |
 Brunei (details) Brunei (details) | 29,462 | 6.7% [56] | | |
 Bulgaria (details) Bulgaria (details) | 4,219,270 [57] | 81.6% | 0.7% | 80.9% |
 Burkina Faso (details) Burkina Faso (details) | 4,787,272 [58] | 26.3% [59] | 20.1% | 6.2% |
 Burundi (details) Burundi (details) | 7,662,000 | 75.0% | 60.0% | 15.0% |
 Cambodia (details) Cambodia (details) | 50,000 | 0.3% [60] | | |
 Cameroon (details) Cameroon (details) | 15,390,000 | 73.0% [61] | 44.4% | 29.3% |
 Canada (details) Canada (details) | 19,373,325 [62] [63] | 53.3% [62] | 29.9% [62] | 23.4% [64] |
 Cape Verde (details) Cape Verde (details) | 287,640 [65] | 81.9% | 72.0% | 9.9% |
 Cayman Islands (details) Cayman Islands (details) | 52,600 | 66.9% [66] | 13.6% | 53.3% |
 Central African Republic (details) Central African Republic (details) | 2,302,000 | 80.0% | 29.0% | 51.0% |
 Chad (details) Chad (details) | 4,150,000 [23] | 35.0% | 20.0% | 15.0% |
 Chile (details) Chile (details) | 11,061,994 | 73.2% [67] [68] | 54.6% | 18.6% |
 People's Republic of China (details) People's Republic of China (details) | 31,220,000 [69] – 49,170,000 [70] | 2.5% – 3.5% [70] | 0.46% – 0.69% [70] | 2.0% – 2.89% [70] |
 Colombia (details) Colombia (details) | 43,560,000 | 92.0% [71] | 79.0% | 13.0% |
 Comoros (details) Comoros (details) | 15,000 | 2.1% | | |
 Cook Islands (details) Cook Islands (details) | 11,980 [72] | 79.9% | 16.7% | 63.2% |
 Congo, Republic of (details) Congo, Republic of (details) | 3,409,000 | 90.7% | 50.0% | 40.0% |
 Congo, Democratic Republic of (details) Congo, Democratic Republic of (details) | 92,400,000 [73] | 93.1% (n.i. 2.8% Kimbanguist) [74] – 95.8% [75] – 96.3% [73] | 29.9% [74] – 47.3% [75] | 48.5% [75] – 63.2% (n.i. Kimbanguist) [74] |
 Costa Rica (details) Costa Rica (details) | 4,000,000 | 82.0% | 57.0% | 25.0% |
 Côte d'Ivoire (details) Côte d'Ivoire (details) | 11,701,583 [76] | 40.7% | | |
 Croatia (details) Croatia (details) | 3,383,046 [77] | 89.6% [78] | 80.7% | 8.5% |
 Cuba (details) Cuba (details) | 6,670,000 [23] | 65.0% [79] | 52.7% | 7.5% |
 Curaçao (details) Curaçao (details) | 130,585 [80] | 86.1% | 70.1% | 16.0% |
 Cyprus (details) Cyprus (details) | 718,067 [81] | 94.0% | 1.8% | 92.2% |
 Czech Republic (details) Czech Republic (details) | 1,725,963 [82] | 16.4% | 13.4% | 3.0% |
 Denmark (details) Denmark (details) | 4,480,000 [83] | 76.9% | 0.8% | 76.1% |
 Djibouti (details) Djibouti (details) | 4,455 [84] | 0.4% | | |
 Dominica (details) Dominica (details) | 58,089 [85] | 85.0% | 54.3% | 30.7% |
 Dominican Republic (details) Dominican Republic (details) | 9,734,000 | 83.0% | 65.0% | 18.0% |
 Ecuador (details) Ecuador (details) | 14,099,000 | 94.0% | 74.0% | 20.0% |
 Egypt (details) Egypt (details) | 9,029,000 | 10.0% [86] | | |
 El Salvador (details) El Salvador (details) | 5,073,000 | 81.9% | 52.6% | 29.3% |
 Equatorial Guinea (details) Equatorial Guinea (details) | 683,000 | 88.7% [23] | 80.7% | 8.0% |
 Eritrea (details) Eritrea (details) | 3,577,000 | 67.0% [87] | 4.0% | 54.0% |
 Estonia (details) Estonia (details) | 408,847 | 30.7% [88] | 0.9% | 29.8% |
 Eswatini (details) Eswatini (details) | 975,757 [89] | 91.3% | 3.4% | 87.9% |
 Ethiopia (details) Ethiopia (details) | 73,230,000 [73] | 61.6% [73] - 62.8% [90] [91] - 67.3% [92] | 0.7% [92] [90] [91] | 62% [91] - 62.1% [90] - 66.6% [92] |
 Falkland Islands (details) Falkland Islands (details) | 3,000 | 94.3% | | 94.0% |
 Faroe Islands (details) Faroe Islands (details) | 33,018 [93] | 95.4% | | 94.0% |
 Fiji (details) Fiji (details) | 612,415 [94] | 69.2% | | |
 Finland (details) Finland (details) | 3,619,666 [95] | 64.2% [95] | 0.3% | 63.9% |
 France (details) France (details) | 25,744,860–33,874,816 | 38.0% (2020 est.) [96] [c]
50% (2021 est.)
60.6% [97] | 29.0% – 47% [98] - 57.5% | 9.0% [96] - 3% [98] - 3.1% |
 Gabon (details) Gabon (details) | 1,081,000 | 88.0% [99] | 41.9% | 46.1% |
 Gambia (details) Gambia (details) | 79,000 | 4.2% [100] | | |
 Georgia (details) Georgia (details) | 3,240,724 [101] [102] | 88.3% | 0.5% | 87.8% |
 Germany (details) Germany (details) | 39,800,000 | 47.7% [103] | 23.7% [103] | 24.0% [103] |
 Ghana (details) Ghana (details) | 21,932,708 [104] | 71.3% | 10.0% | 61.3% |
 Gibraltar (details) Gibraltar (details) | 26,935 [105] | 83.7% | 72.1% | 11.5% |
 Greece (details) Greece (details) | 10,000,000 | 93.0% [106] | <1.0% [106] | |
 Greenland (details) Greenland (details) | 55,000 | 96.6% | | 96.6% |
 Grenada (details) Grenada (details) | 90,632 [107] | 90.1% | 33.9% | 56.2% |
 Guatemala (details) Guatemala (details) | 14,018,000 | 87.0% | 47.0% | 40.0% |
 Guinea (details) Guinea (details) | 1,032,000 | 8.9% [108] | 5.0% | 5.0% |
 Guinea-Bissau (details) Guinea-Bissau (details) | 318,021 [109] | 26.2% | | |
 Guyana (details) Guyana (details) | 477,284 [110] | 63.9% | 7.1% | 56.8% |
 Haiti (details) Haiti (details) | 9,597,000 | 96.0% | 80.0% | 16.0% |
 Honduras (details) Honduras (details) | 6,660,000 | 88.0% [111] | 47.0% | 41.0% |
 Hong Kong (details) Hong Kong (details) | 1,301,000 [112] [113] | 17.6% | 5.4% | 12.2% |
 Hungary (details) Hungary (details) | 5,254,179 [114] | 52.87% [114] | 38.96% [114] | 13.91% [114] |
 Iceland (details) Iceland (details) | 266,000 [115] | 68.3% [115] | 3.9% [115] | 64.4% [115] |
 India (details) India (details) | 30,000,000 | 2.3% [116] | 1.3% | 1.0% |
 Indonesia (details) Indonesia (details) | 29,149,241 [117] | 10.49% [118] | 3.06% | 7.43% |
 Iran (details) Iran (details) | 380,000 – 1,500,000 [119] | 0.4% –1.5% | | 0.4% –1.5% |
 Iraq (details) Iraq (details) | 500,000 | 1.2% | | 1.2% |
 Ireland (details) Ireland (details) | 3,888,839 [120] | 81.0% [120] | 73.8% [120] | 5.6% [120] |
 Isle of Man (details) Isle of Man (details) | 40,725 [121] | 54.6% | | |
 Israel (details) Israel (details) | 266,000 | 3.5% | | 3.5% |
 Italy (details) Italy (details) | 48,210,000 [73] - 53,230,000 [122] | 80.5% [73] - 83.0% | 81.2% | 2.0% |
 Jamaica (details) Jamaica (details) | 1,848,607 [123] | 70.5% | 2.2% | 68.3% |
 Japan (details) Japan (details) | 1,872,320 [124] | 1.1% [124] | 0.5% | 0.6% |
 Jordan (details) Jordan (details) | 388,000 | 6.0% [125] | | |
 Kazakhstan (details) Kazakhstan (details) | 3,300,000 | 17.2% [126] | | |
 Kenya (details) Kenya (details) | 37,086,506 [127] | 78.7% | 20.6% | 58.1% |
 Kiribati (details) Kiribati (details) | 116,474 [128] | 97.6% | 59.0% | 38.7% |
 Korea, North (details) Korea, North (details) | 406,000 | 1.7% | | |
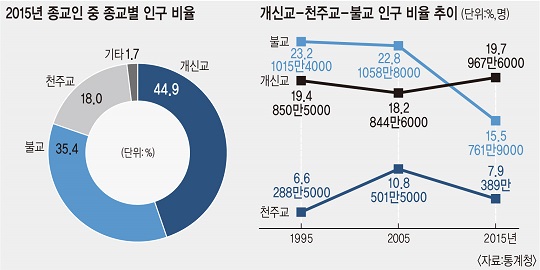
 Korea, South (details) Korea, South (details) | 13,566,000 | 27.6% [129] | 7.9% | 19.7% |
 Kuwait (details) Kuwait (details) | 458,000 | 15.0% | 3.2% | 12.8% |
 Kyrgyzstan (details) Kyrgyzstan (details) | 610,000 [23] – 944,000 | 11.4% [23] – 17.0% [130] | | |
 Laos (details) Laos (details) | 112,230 [131] | 1.7% | | |
 Latvia (details) Latvia (details) | 1,570,000 | 70.0% [132] – 80.0% [133] | 24.1% [132] – 25.1% [133] [134] | 46.8% [132] – 54.9% [133] |
 Lebanon (details) Lebanon (details) | 1,600,000 –1,800,000 [135] [136] | 38.0% – 41.0% | 26.0% | 15.0% |
 Lesotho (details) Lesotho (details) | 1,876,000 | 90.0% | 45.0% | 45.0% |
 Liberia (details) Liberia (details) | 4,458,286 [137] | 84.9% | | |
 Libya (details) Libya (details) | 170,000 [23] | 2.7% [23] | 0.5% | 1.5% |
 Liechtenstein (details) Liechtenstein (details) | 30,912 [138] | 82.4% | 72.5% | 10.0% |
 Lithuania (details) Lithuania (details) | 2,236,185 [139] | 92.2% | 86.0% | 6.2% |
 Luxembourg (details) Luxembourg (details) | 360,000 | 72.4% [140] | 68.7% | 3.7% |
 Madagascar (details) Madagascar (details) | 22,322,966 | 85.0% [141] | | |
 Malawi (details) Malawi (details) | 13,581,623 [142] | 77.3% | 17.2% | 60.1% |
 Malaysia (details) Malaysia (details) | 2,941,049 [143] | 9.0% | | |
 Maldives (details) Maldives (details) | 300 - 1,400 [144] | 0.08% | | |
 Mali (details) Mali (details) | 484,857 [145] | 2.3% | | |
 Malta (details) Malta (details) | 399,983 [146] | 88.5% | 82.6% | 5.9% |
 Marshall Islands (details) Marshall Islands (details) | 40,003 [147] | 96.2% | 9.3% | 86.9% |
 Mauritania (details) Mauritania (details) | 5,000 | 0.14% | | |
 Mauritius (details) Mauritius (details) | 398,212 [148] | 32.3% | 25.0% | 7.3% |
 Mexico (details) Mexico (details) | 111,959,525 [149] | 89.1% | 78.0% | 11.2% |
 Micronesia, Federated States of (details) Micronesia, Federated States of (details) | 101,468 [150] | 98.7% | 54.7% | 44.0% |
 Moldova (details) Moldova (details) | 2,602,368 | 99.6% [151] | 0.1% | 99.5% |
 Monaco (details) Monaco (details) | 30,000 | 82.6% [152] | 77.0 [152] | |
 Mongolia (details) Mongolia (details) | 42,859 | 1.3% [153] | | |
 Montenegro (details) Montenegro (details) | 467,349 [154] | 76.5% | 3.3% | 73.2% |
 Montserrat (details) Montserrat (details) | 3,586 [155] | 84.1% | 10.6% | 73.5% |
 Morocco (details) Morocco (details) | 336,000 | 1.0% [156] | | |
 Mozambique (details) Mozambique (details) | 12,287,678 [157] | 46.2% | 27.6% | 18.6% |
 Myanmar (details) Myanmar (details) | 3,790,000 | 6.2% | 1.0% | 5.2% |
 Namibia (details) Namibia (details) | 1,991,000 | 90.0% | 13.7% | 76.3% |
 Nauru (details) Nauru (details) | 10,975 [158] | 94.4% | 34.0% | 60.4% |
 Nepal (details) Nepal (details) | 512,313 [159] | 1.8% | | |
 Netherlands (details) Netherlands (details) | 5,382,883 | 30.0% (2023) [160] | 17.0% (registered, 2023) [160] | 14.0% (2023) [160] |
 New Zealand (details) New Zealand (details) | 1,738,638 (2018) [161] | 37.0% (2018) [161] | 10.0% (2018) [161] | 27.0% (2018) [161] |
 Nicaragua (details) Nicaragua (details) | 5,217,000 | 84.6% | 58.8% | 25.8% |
 Niger (details) Niger (details) | 56,856 [162] | 0.3% | | 5.0% |
 Nigeria (details) Nigeria (details) | 74,400,000 –92,770,000 [73] – 107,000,000 | 43.4% [73] – 45.9% [163] | 10.6% [163] | 35.3% [163] |
 North Macedonia (details) North Macedonia (details) | 1,100,732 [164] [165] | 64.6% | 0.4% | 64.2% |
 Norway (details) Norway (details) | 3,844,000 [166] | 76.7% (2018) [167] [168] | 2.4% [169] | 73.8% (2018) [167] [168] |
 Oman (details) Oman (details) | 180,000 [23] | 6.5% [23] | | |
 Pakistan (details) Pakistan (details) | 3,300,788 [170] | 1.4% | | |
 Palau (details) Palau (details) | 14,148 [171] [d] | 80.3% | 46.4% | 33.9% |
 Panama (details) Panama (details) | 3,057,000 | 92.0% | 80.0% | 12.0% |
 Papua New Guinea (details) Papua New Guinea (details) | 6,800,000 | 97.0% | 27.0% | 70.0% |
 Paraguay (details) Paraguay (details) | 6,260,000 | 96.0% [111] | 88.0% | 8.0% |
 Peru (details) Peru (details) | 29,519,000 | 94.5% [172] | 76.0% | 18.5% |
 Philippines (details) Philippines (details) | 92,746,021 [173] | 85.3% | 78.8% | 6.5% |
 Pitcairn Islands (details) Pitcairn Islands (details) | 50 | 100.0% | | 100.0% |
 Poland (details) Poland (details) | 27,550,861 [174] | 72.4% | 71.4% | 1% |
 Portugal (details) Portugal (details) | 7,445,000 | 84.8% [175] | 80.2% | 4.6% |
 Puerto Rico (details) Puerto Rico (details) | 3,878,000 | 89.0% [176] [177] | 56.0% | 33.0% |
 Qatar (details) Qatar (details) | 263,000 | 13.8% | | |
 Romania (details) Romania (details) | 16,155,689 [178] | 98.5% | 5.2% | 93.3% |
 Russia (details) Russia (details) | 102,400,000 [20] | 69.9% [20] | | |
 Rwanda (details) Rwanda (details) | 12,201,213 [179] | 92.2% | 40.0% | 52.3% |
 Saint Helena (details) Saint Helena (details) | 3,436 [180] | 86.4% | 2.4% | 84.0% |
 Saint Kitts and Nevis (details) Saint Kitts and Nevis (details) | 39,206 [181] | 83.2% | 5.9% | 77.2% |
 Saint Lucia (details) Saint Lucia (details) | 133,001 [182] | 80.7% | 52.8% | 27.9% |
 Saint Vincent and the Grenadines (details) Saint Vincent and the Grenadines (details) | 89,891 [183] | 86.4% | 6.6% | 79.8% |
 Samoa (details) Samoa (details) | 183,559 [184] | 89.3% | 18.0% | 71.3% |
 San Marino (details) San Marino (details) | 31,000 | 91.6% [23] | 90.5% | 1.1% |
 São Tomé and Príncipe (details) São Tomé and Príncipe (details) | 127,938 [185] | 72.3% | 56.3% | 16.0% |
 Saudi Arabia (details) Saudi Arabia (details) | 1,500,000 | 5.0% [186] | | |
 Senegal (details) Senegal (details) | 570,000 | 4.2% [187] | | |
 Serbia (details) Serbia (details) | 5,758,719 | 86.68% [188] | 3.87% | 82.81% |
 Seychelles (details) Seychelles (details) | 76,937 [189] | 84.7% | 69.3% | 15.4% |
 Sierra Leone (details) Sierra Leone (details) | 619,000 – 1,294,000 | 10.0% [190] –20.9% [191] | | |
 Singapore (details) Singapore (details) | 654,355 [192] | 18.9% | 7.0% | 11.9% |
 Slovakia (details) Slovakia (details) | 3,748,000 | 68.8% [193] | 59.8% | 9.0% |
 Slovenia (details) Slovenia (details) | 1,610,000 | 68.0% [132] | 64.0% [132] | 4.0% [132] |
 Solomon Islands (details) Solomon Islands (details) | 696,324 [194] | 96.6% | 20.0% | 76.6% |
 Somalia (details) Somalia (details) | 178,869 [195] | 1.0% | | |
 South Africa (details) South Africa (details) | 51,630,000 [73] - 52,886,000 | 85.3% [196] [73] | 5.0% | 75.0% |
 South Sudan (details) South Sudan (details) | 6,010,000 [197] | 60.5% [198] | 30.0% | 30.0% |
 Spain (details) Spain (details) | 28,000,000 | 59.2% [199] | 58.2% [199] | 1.0% [199] |
 Sri Lanka (details) Sri Lanka (details) | 1,552,161 [200] | 7.6% | 6.2% | 1.4% |
 Sudan (details) Sudan (details) | 525,000 | 1.5% [201] | | |
 Suriname (details) Suriname (details) | 262,000 | 48.4% – 51.6% [202] [203] | 21.6% | 26.8% |
 Sweden (details) Sweden (details) | 6,577,478 | 64.3% [204] | 1.2% | 63.1% |
 Switzerland (details) Switzerland (details) | 5,700,000 | 66.9% [205] – 69.1% [206] | 36.5% [205] – 37.9% [206] | 30.4% [205] – 31.2% [206] |
 Syria (details) Syria (details) | 1,800,000 [207] | 10.0% [23] | 2.0% | 8.0% |
 Tajikistan (details) Tajikistan (details) | 110,000 [23] | 1.4% | 0.1% | 1.3% |
 Tanzania (details) Tanzania (details) | 31,342,000 | 61.4% [208] | | |
 Thailand (details) Thailand (details) | 768,000 | 1.1% [209] | | |
 Timor-Leste (details) Timor-Leste (details) | 1,242,668 [210] | 99.5% | 97.5% | 2.0% |
 Togo (details) Togo (details) | 1,966,000 | 29.0% | | |
 Tonga (details) Tonga (details) | 97,075 [211] | 97.8% | 13.7% | 84.0% |
 Trinidad and Tobago (details) Trinidad and Tobago (details) | 743,105 [212] | 63.2% | 24.3% | 38.9% |
 Tunisia (details) Tunisia (details) | 30,000 [213] [e] | | | |
 Turkey (details) Turkey (details) | 120,000 [214] – 310,000 [215] | 0.2% | | |
 Turkmenistan (details) Turkmenistan (details) | 466,000 | 9.0% [216] | | 9.0% |
 Turks and Caicos Islands (details) Turks and Caicos Islands (details) | 6,442 [217] | 87.6% | 5.7% | 82.0% |
 Tuvalu (details) Tuvalu (details) | 10,040 [218] | 95.7% | 0.5% | 95.2% |
 Uganda (details) Uganda (details) | 37,489,984 [219] | 84.5% | 37.4% | 47.0% |
 Ukraine (details) Ukraine (details) | 34,830,000 [220] | 81.9% [220] | 7.5% | 74.4% |
 United Arab Emirates (details) United Arab Emirates (details) | 940,000 | 9.0% [221] | 7.0% | 2.0% |
 United Kingdom (details) United Kingdom (details) | 25,585,000 [222] – 31,889,000 | 38.0% [223] – 47.7% [224] [225] | 7.0% [226] | 31.0% [226] |
 United States (details) United States (details) | 217,270,000 [73] | 62% [227] – 69% [228] | 19% [227] – 21.8% [228] | 43% [227] – 47.2% [228] |
 Uruguay (details) Uruguay (details) | 1,510,000 [73] | 44.5% [73] - 68% [229] | 55% [229] | 13% [229] |
 Uzbekistan (details) Uzbekistan (details) | 710,000 [23] | 2.6% [23] | | 2.6% [23] |
 Vanuatu (details) Vanuatu (details) | 245,163 [230] | 83.5% | 12.1% | 71.4% |
 Venezuela (details) Venezuela (details) | 28,340,000 | 88.0% [231] | 71.0% | 17.0% |
 Vietnam (details) Vietnam (details) | 6,831,000 | 7.1% [232] | 6.1% | 1.0% |
 Yemen (details) Yemen (details) | 25,000 [233] – 41,000 [234] | 0.01% | 0.01% | |
 Zambia (details) Zambia (details) | 19,300,000 | 98.0% [235] | 17.9% | 80.0% |
 Zimbabwe (details) Zimbabwe (details) | 12,937,804 [236] | 85.2% | 6.4% | 78.8% |
| Europe | 565,560,000 [237] | 76.2% [237] | 35.0% [238] | 41.2% [237] |
|---|
| Latin America and the Caribbean | 531,280,000 [237] | 90.0% [237] | 70.0% [239] | 20.0% [240] |
|---|
| Africa | 526,016,926 [237] | 62.7% [237] | 21.0% [238] | 41.7% [237] |
|---|
| Asia | 285,120,000 [237] –375,905,000 [241] | 7.0% [237] –12.0% [241] | 3.0% [238] –5.1% [241] | 4.0% [237] –6.8% [241] |
|---|
| North America | 266,630,000 [237] | 77.4% [237] | 22.0% [238] | 55.4% |
|---|
| Oceania | 25,754,000 [242] | 73.3% [242] | 38.9% [242] | 34.4% [242] |
|---|
| Middle East-North Africa | 12,000,000 –16,000,000 [243] | 3.8% [237] –5.0% [244] | 2.0% [238] –2.6% | 1.8% [237] – 2.3% |
|---|
| Total | 2,431,209,718 [241] | 33.4% [241] | 16.9% [241] | 16.5% [241] |
|---|

