Kyrgyzstan is one of the few post-Soviet countries in which the rural population's share of 58.29% exceeds the urban population's share of 41.71% as of 2024.[3]
Overview
Kyrgyzstan's population increased from 2.1 million to 4.8 million between the censuses of 1959 and 1999.[4] Official estimates set the population at 6,389,500 in 2019.[1] Of those, 34.4% are under the age of 15 and 6.2% are over the age of 65. The country is rural: only about one-third of Kyrgyzstan's population live in urban areas. The average population density is 27.4 inhabitants per square kilometre (71/sqmi).
The nation's largest ethnic group are the Kyrgyz, a Turkic people, which comprise 73.2% of the population (2018 census). Other ethnic groups include Russians (5.8%) concentrated in the north and Uzbeks (14.5%) living in the south. Small but noticeable minorities include Dungans (1.1%), Uyghurs (1.1%), Tajiks (0.9%), Kazakhs (0.7%) and Ukrainians (0.5%), and other smaller ethnic minorities (1.7%). Of the formerly sizable Volga German community, exiled here by Joseph Stalin from their earlier homes in the Volga German Republic, most have returned to Germany, and only a few small groups remain. A small percentage of the population are also Koreans, who are the descendants of the Koreans deported in 1937 from the Soviet Far East to Central Asia.
Kyrgyzstan has undergone a pronounced change in its ethnic composition since independence.[5][6] The percentage of ethnic Kyrgyz increased from around 50% in 1979 to nearly 73% in 2018, while the percentage of Slavic ethnic groups (Russians, Ukrainians) dropped from 35% to about 6%.[1][4]
The Kyrgyz have historically been semi-nomadic herders, living in round tents called yurts and tending sheep, horses and yaks. This nomadic tradition continues to function seasonally (see transhumance) as herding families return to the high mountain pasture (or jailoo) in the summer. The retention of this nomadic heritage and the freedoms that it implies continue to affect the political atmosphere in the country.
Population size and structure
Population density of Kyrgyzstan, 2015
Population Estimates by Sex and Age Group (01.VII.2020) (Data refer to annual average population.):[8]
Statistics are taken from the United Nations Demographic Yearbook, the National Statistical Committee of the Republic of Kyrgyzstan, the Demographic Annual of the Kyrgyz Republic, and Demoskop Weekly.[9][10][11][12][13][14]
During the Soviet era, fertility in Kyrgyzstan was high (TFR 4 or higher). After independence there was a rapid decrease to 2.4 at the beginning of the 21st century, but the TFR had increased to 3 or higher as of 2010. Since 2020, there is a decrease to 2.8 in 2022.
The differences between nationalities in the number of children are significant:[5][6]Uzbeks (3.0 children), Tajiks (3.0 children), Turks (2.9), Kyrgyz (2.9), Dungans (2.8), Russians (1.7), Koreans (1.7), Germans (1.8), Ukrainians (2.1), Tatars (2.1), Kazakhs (2.3) and Uyghurs (2.5).[4] The TFR for Russians, Ukrainians, Germans, and Koreans in Kyrgyzstan are considerably higher than in their home countries.[citation needed]
Life expectancy
Life expectancy in Kyrgyzstan since 1950Life expectancy in Kyrgyzstan since 1960 by gender
Ethnic groups
According to the 2022 census,[16] the ethnic composition of the population was as follows: Kyrgyz 77.8%, Uzbeks 14.2%, Russians 3.8%, Dungans 1.0%, Uyghurs 0.5%, other 2.7%, including Tajiks 0.9%, Kazakhs 0.4% and Turks 0.3%. Most Russians, Ukrainians, Tatars, Germans, and Koreans lived in northeast, especially around the city of Karakol. Most of the Dungans and Uyghurs are found along the Chinese border. Most of the Tajiks and Uzbeks live in and around Fergana valley.
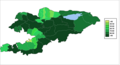
Percentage of Kyrgyz in Kyrgyzstan by region
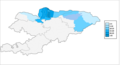
Percentage of Russians in Kyrgyzstan by region
Percentage of Uzbeks in Kyrgyzstan by region
The table shows the ethnic composition of Kyrgyzstan's population according to all population censuses between 1926 and 2022. Due to emigration (and low fertility rates), there has been a sharp decline in the European ethnic groups (Russians, Ukrainians, Germans) and also Tatars since independence (as captured in the 1989, 1999, 2009 and 2022 censuses).
Sunni Islam is the predominant religious denomination in Kyrgyzstan. The country has a significant Christian minority which Russian Orthodox is the main denomination.
↑5.01.00.16 Справочные данные по населению[Table 5.01.00.16 Population reference data](XLS). National Statistical Committee of the Republic of Kyrgyzstan (in Russian). 2015. Retrieved 31 January 2016. "Table 5.01.00.05 Number of live births"(XLS). National Statistical Committee of the Republic of Kyrgyzstan. 2015. Retrieved 31 January 2016.
This page is based on this Wikipedia article Text is available under the CC BY-SA 4.0 license; additional terms may apply. Images, videos and audio are available under their respective licenses.