Armenian, English, Russian, French, Greek, Kurdish, and others
After registering steady increases during the Soviet period, the population of Armenia declined from its peak value of 3.633 million in 1992 to 3.075 million in 2025.[1]
Whilst the country's population increased steadily during the Soviet Union as a result of periods of repatriation and low emigration rates, it has declined in recent times due to the exodus of peoples following the Soviet break-up. The rates of emigration and population decline, however, have decreased in recent years, and there has been a moderate influx of Armenians returning to Armenia.
Citing Armenia's conquest and occupation by the Seljuks (11th century) and Mongols (13th–15th centuries), historians Edmund Herzig and Marina Kurkchiyan write "the combination of progressive Turkish (and Kurdish) immigration and Armenian decline, through massacre, famine and emigration, changed the demographic balance in a way that Arab immigration had never done".[11]
As a result of "deliberate relocation policies employed by both the Ottomans and Safavids" during the Ottoman–Safavid War, there was a large-scale displacement of Armenians; Armenians also emigrated "to escape the insecurity and hardship of life in war-torn Armenia". Whilst Shah Abbas Irelocated Armenians to Isfahan and "Armenian colonies in other parts of Iran" in 1604–1605, "the Ottomans also removed Armenian artisans to their capital".[12]
Following the Russian annexation, 45,000 Armenians from Persia and 100,000 from the Ottoman Empire migrated to Eastern Armenia, with another 25,000 migrating following the 1878 Russo-Turkish war. As a result of the repatriation, Armenians had regained a majority in their homeland "for the first time in several hundred years".[13] As a result of persecution and massacres in the Ottoman Empire, some 100,000 Armenians immigrated to Eastern Armenia between 1870 and 1910.[14] The areas with Armenian-majorities would later "form the nucleus in the twentieth century of an independent Armenian state".[13]
Historian Sen Hovhannisian writes that during the 80 years of peace during which Eastern Armenia was part of Russia, there was "unprecedented" population growth: it tripled from 161,700 to 496,100 between 1831 and 1873, and doubled in the following forty years until it reached 1,000,100 in 1913. The population between 1831 and 1913 increased 6.18 times, yielding an average annual growth rate of 10,200 people. Following the outbreak of World War I, the population, which was 1,014,300 in 1914, fell by 20,500 in 1916 due to the Christian population being drafted. As a result of "wars and civil clashes, hunger and diseases" of 1918–1920, 432,000 people (35.8 percent of the population) were "exterminated".[15]
Upon its sovietisation, the territory of modern-day Armenia had a population of some 720,000, a decline of nearly 30 percent—"almost half" consisted of refugees.[5] American historian Richard Pipes states that "according to Soviet estimates, the Armenian population of Transcaucasia declined between 1914 and 1920 by one half million: 200,000 in consequence of Turkish, and, presumably, Communist, massacres, and 300,000 from other causes, mostly famine and disease".[16]
The drastic decline of the population was addressed by the Soviet Armenian government by repatriating displaced Azerbaijanis to districts where they had formed a significant population in Armenia. The Azerbaijani population of Armenia which numbered some 10,000 in 1920 (attributed to the ARF government's expulsion of at least 200,000 Turks and Kurds) rose to 72,596 in 1922 as a result of the return of 60,000 refugees.[17][bettersourceneeded] In addition to this, the Soviet government welcomed 44,000 Armenian refugees from Greece, Iraq, Turkey, and elsewhere throughout the 1920s and 1930s.[18] In 1946–1948, 86,000 Armenians were repatriated to Soviet Armenia to offset the country's wartime losses.[19] At the same time, by agreement of Armenian and Azerbaijani Soviet leaderships, tens of thousands of Azerbaijanis in Armenia were resettled to Azerbaijan to make room for the repatriates.[20]
Population growth rates in Armenia in years 1980–2016. Data from World Bank.
highest percentage of men and highest percentage of women with at least some secondary education,
highest share of seats in parliament held by women,
highest share of women who reported to feel safe,
highest GDP growth rate.
Since 1990, Armenia recorded steady growth of average annual HDI scores in every reported period (1990–2000, 2000–2010, 2010–2017).[21]
According to the 2016 Sustainable Society Index, Armenia has a higher rank of Human Wellbeing than all its neighbours. At the same time its Economic Wellbeing rank is below neighbouring countries.[22]
The 2011 census counted 539,394 persons (19.4 percent of the population above 6 years of age) with higher professional education.[23]
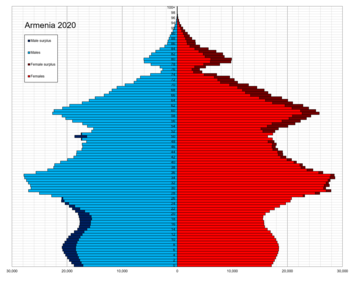
Structure of the population
The median age in 2020 was 36.6 years (male: 35.1, female: 38.3).[24]
36.3 percent of women who gave birth in 2016 had higher education.[1]
Population by Sex and Age Group (Census 12.10.2011):[25]
Age Group
Male
Female
Total
%
Total
1,398,052
1,620,802
3,018,854
100
0–4
105 565
102 007
207 572
6.88
5–9
91 429
88 500
179 929
5.96
10–14
90 458
88 179
178 637
5.92
15–19
107 938
125 137
233 075
7.72
20–24
133 897
158 337
292 234
9.68
25–29
122 109
149 820
271 929
9.01
30–34
103 114
119 891
223 005
7.39
35–39
89 073
98 348
187 421
6.21
40–44
82 502
94 462
176 964
5.86
45–49
98 064
112 996
211 060
6.99
50–54
109 294
125 238
234 532
7.77
55–59
80 989
96 769
177 758
5.89
60–64
56 189
71 410
127 599
4.23
65–69
28 020
37 353
65 373
2.17
70–74
44 041
63 637
107 678
3.57
75–79
30 734
44 643
75 377
2.50
80–84
18 662
30 244
48 906
1.62
85+
5 974
13 831
19 805
0.66
Age Group
Male
Female
Total
%
0–14
287 452
278 686
566 138
18.75
15–64
983 169
1 152 408
2 135 577
70.74
65+
127 431
189 708
317 139
10.51
Population Estimates by Sex and Age Group (01.VII.2019):[26]
Age Group
Male
Female
Total
%
Total
1 399 368
1 563 114
2 962 482
100
0–4
102 588
92 078
194 666
6.57
5–9
111 879
98 348
210 227
7.10
10–14
103 991
90 955
194 946
6.58
15–19
88 582
77 838
166 420
5.62
20–24
90 776
88 311
179 087
6.05
25–29
115 826
127 910
243 736
8.23
30–34
124 127
138 753
262 880
8.87
35–39
111 345
123 527
234 872
7.93
40–44
87 619
100 891
188 510
6.36
45–49
74 528
90 316
164 844
5.56
50–54
73 562
93 943
167 505
5.65
55–59
91 952
116 734
208 686
7.04
60–64
81 199
105 827
187 026
6.31
65–69
55 578
76 627
132 205
4.46
70–74
29 945
46 812
76 757
2.59
75–79
23 192
37 510
60 702
2.05
80–84
21 287
37 958
59 245
2.00
85+
11 392
18 776
30 168
1.02
Age group
Male
Female
Total
Percent
0–14
318 458
281 381
599 839
20.25
15–64
939 516
1 064 050
2 003 566
67.63
65+
141 394
217 683
359 077
12.12
|- |} In 2016, households with up to four members prevailed in urban areas throughout Armenia, with the share of such households coming to 70.2 percent in urban communities compared to 60.1 percent in rural communities.[27]
Vital statistics
Life expectancy
Life expectancy in Armenia since 1950Life expectancy in Armenia since 1960 by gender
According to the 2018 HDI statistical update, compared to all its neighbouring countries Armenia has the highest health expenditures as percentage of its GDP and the highest healthy life expectancy at birth.[21]
In 2016, the average life expectancy at birth for males was 71.6 years and for females was 78.3 years, with the average at 75.0 years.[1]
After a setback during 1986–1996, mostly due to the Spitak earthquake, and the First Nagorno-Karabakh War, Armenia regained its position and was consistently among the top three former Soviet republics during 1997–2016, topping the list in 2007.[28]
During the Soviet period, life expectancy was traditionally high in Armenia and topped all other republics of the USSR, and most other countries in Eastern Europe between 1978 and 1980.[29][30]
In 2016, natural increase of population comprised 12,366 persons and the crude rate of natural increase reached 4.1%, per 1000 population, decreasing by 0.4 percent compared to the previous year.[1]
After double-digit crude natural increase rates between 1982 and 1992, rates did not exceed 5.5 after 1998. At a regional level, slightly better rates were recorded in the capital Yerevan, where the value of 5.5 is consistently being surpassed since 2009. Particularly weak is natural increase in Tavush and Syunik provinces, not much better off are Lori and Vayots Dzor provinces.[1]
Armenia's Total Fertility Rate at 1.6 was lowest in the Caucasus region in 2017.[33] TFR is expected to stay at 1.6 between 2015 and 2020, less from 1.7 in years 2010–2015.[21]
The mean age of mothers at birth was 26.8 years and at first birth it was 24.7 years in 2016.[1] Adolescent birth rate, as well as, share of women married aged 18 was lowest in Armenia compared to its neighbouring countries.[21]
In 2016, infant mortality rate (in the first year of their life) was 8.6%, per 1,000 live births.[1]
A study revealed that population growth rate changes were more favourable in Armenia than in its surrounding countries between 2005 and 2015.
Since the 1960s, Armenia has the highest share of urban population among South Caucasus countries.[34]
Vital statistics summary data
Graphs are unavailable due to technical issues. Updates on reimplementing the Graph extension, which will be known as the Chart extension, can be found on Phabricator and on MediaWiki.org.
Graphs are unavailable due to technical issues. Updates on reimplementing the Graph extension, which will be known as the Chart extension, can be found on Phabricator and on MediaWiki.org.
Graphs are unavailable due to technical issues. Updates on reimplementing the Graph extension, which will be known as the Chart extension, can be found on Phabricator and on MediaWiki.org.
1 The numbers of life births and deaths until 1959 were calculated from the birth rate and death rate, respectively
2 The high number of deaths in 1988 is related to the Spitak earthquake, while in the rest of the 20th century the death rate was equal to the rate of other European countries (excluding England).[40]
3 The population estimate for 2012 has been recalculated on the basis of the 2011 Census.
Most Armenians are Christians, primarily of the Apostolic Church rite. Armenia is considered the first nation to officially adopt Christianity, which was first preached in Armenia by two Apostles of Jesus, St. Bartholomew and St. Thaddeus in the 1st century. The Armenian Apostolic Church can trace its roots back to the 3rd and 4th centuries. The country formally adopted the Christian faith in 301 A.D. Over 90 percent of Armenians belong to the Armenian Apostolic Church. Armenia also has a population of Catholics and Evangelical Protestants.
Annual net migration rate (per 1000 population). Source data and projections (2019) from UN.
Compared to its neighbouring countries, Armenia has the highest share of immigrants (6.5 percent of total population, 2017 data).[21]
The estimated number of population net migration is −24.8 thousand persons, according to the Integrated living conditions survey of households of 2016; for urban population −13.8 thousand and for rural population −11.0 thousand persons.[1]
24.9% of households were involved in external and internal migration processes over the period of 2013– 2016. Migration directions were distributed as follows: 12% – internal, 10.5% – Republic of Artsakh, rest (76.4%) – international (of which 89.8% – Russia). Among household members of age 15 and above, who left their permanent residence in 2013–2016 for 3 months and longer and had not returned as of 2016, 11.9% were in Armenia, 13.0% in Artsakh, and 75.1% in other countries, predominantly in Russia. More than 54% of migrant household members of the age 15 years and above sent money and/ or goods to their families/relatives/friends within 12 months preceding the survey.[52]
According to 2019 UN data, the emigration rate averaged annually around 1.7 per 1000 inhabitants in years 2015–2020 and is expected to remain the same until year 2045. These are below average emigration rate of 11.5 per 1000 in years 2000–2010 and even below the emigration rate of 3.2 per 1000 in years 1980–1985.[53]
Migration during post-Soviet period
It is estimated that 740,000-1,300,000 people left Armenia between 1988 and 2005.[54]
Economically recessed situation in Armenia during the 1990s enhanced the emigration of 125,000 refugees and displaced persons. Human and natural disasters also caused approximately 192,000 individuals to become internally displaced persons in Armenia. Among the disasters, the major impact was the 1988 Spitak earthquake.[54]
After the collapse of the Soviet Union, borders that were once formal, now assumed real significance. Nonetheless, increased political, inter-ethnic, and social tensions prompted more and more people to migrate between Armenia and its neighbouring countries. As a result, approximately 100,000 persons or 3 percent of the country's population emigrated during the beginning of 1990s.[54]
Refugees and forcibly displaced persons started arriving to Armenia in spring 1988 and continued coming until late 1991. During this time, Armenia gave shelter to approximately 419,000 refugees and displaced persons, 360,000 of whom migrated from Azerbaijan. The rest immigrated from other regions of the former Soviet Union.[54]
419.000 people migrated to Armenia during the post-Soviet period
Refugees from Azerbaijan (86%)
Refugees from Nagorno-Karabakh (7%)
Persons Forcibly displaced (3%)
Refugees from Shahumyan (bordering Nagorno-Karabakh) (4%)
Migration flows during the post-soviet period can be divided into 3 stages:
The first stage, prior to 1995, was characterized by mass emigration due to economic reasons, a drop in living standards, and a rapid deterioration in the delivery and quality of public utilities. It is estimated that over 800,000 people emigrated from Armenia during this period and that only 400,000 of them have returned since then.
During the second stage, from 1995 to 2001, emigration decreased, with most of those leaving to be labour migrants in search of better economic and social opportunities. 180,000 people (6 per cent of the population) emigrated from Armenia during these six years These emigrants tended to resettle abroad permanently and were later joined by relatives through family reunification.
The third stage, from 2002 to the present, is marked by a constant yearly increase in the number of persons travelling to and from Armenia. This stage was also characterized by a shift to a positive migration balance.[54]
According to government records, over 55 per cent of all emigrants are unmarried and 60 per cent are males between the ages of 20 and 44 (very few are children and even fewer are elderly people). Most have an educational level far higher than the national average and have no intention of returning to Armenia. Although no hard data exists, emigrant families appear to be even less likely to return.[54]
The emigration of the major part of the Armenian population has brought about important changes. For example, a decrease in the number of people of reproductive age in Armenia has led to a progressive drop in marriages and birth rates. There has also been a considerable change in the ethnic composition of the population in Armenia due to a higher rate of emigration among ethnic minorities.[54]
According to Global Wealth Report, prepared by Credit Suisse, mean wealth per adult in Armenia in 2019 is estimated at $19,517 (rising 9 times from estimated $2,177 in year 2000). Mean wealth per adult in Armenia surpasses corresponding values for neighboring countries Georgia and Azerbaijan by over 50%, all CIS countries except Russia and Kazakhstan, and neighboring Iran. Growth rate of mean wealth per adult between 2000 and 2019 with the value of 9 times beats all neighboring countries, most of CIS countries as well as Estonia, Latvia and Lithuania.[57][58]
Median wealth per adult is reported at $8,309 in 2019, above the world average, rising 9.6 times from $862 in year 2000.[57][58]
Between 2000 and 2019, average debts per adult grew 28.7 times to $1,261, or 6.5% of wealth per adult (below the 11.9% world average).[57][58]
55% of adults own less than $10,000, 42.7% — $10,000–$100,000, 2.2% — $100,000–$1million and 0.1% — over $1million. The share of adults owning less than $10,000 with the value of 55% is less than corresponding value in each of CIS countries, neighboring Iran and Turkey, as well as the world average. Gini coefficient for wealth is reported at 66.3%, less than 82.4% the European average and 88.5% the world average.[57][58]
As much as 53.5% of the country's population was officially considered poor in 2004. Poverty fell significantly in the following years amid double-digit economic growth that came to an end with the onset of the global financial crisis in late 2008. It soared to almost 36% in 2010, one year after Armenia's Gross Domestic Product shrunk by over 14%. Afterwards, there was a decreasing trend throughout the last years reaching 23.5% in 2018, down from 25.7% in 2017.[59]
The poverty indicators in Shirak, Lori, Kotayk, Tavush and Armavir provinces are higher than the country average. The highest poverty rate in the country has been recorded in Shirak province, where 46% of the population is below the poverty line. To overcome poverty, Armenia would need AMD 63.2billion, or an amount equal to 1.2% of GDP, in addition to the resources already allocated for social assistance, assuming that such assistance would be efficiently targeted to the poor.[27]
In terms of the international poverty line corresponding to US$1.25 in 2005 PPP, poverty in Armenia went down from 19.3% in the year 2001 to 1.5% in the year 2008 and remained nearly unchanged until the year 2015 moving in the range of 1.5% – 2.7%.[27]
↑ "PART 8: POPULATION CENSUS"(PDF). Statistical Committee of the Republic of Armenia. Archived(PDF) from the original on 5 July 2016. Retrieved 7 August 2022.
Allerton Kilbourne Matossian, Mary (1962). The Impact of Soviet Policies in Armenia. E.J. Brill.
Bloxham, Donald (2005). The Great Game of Genocide: Imperialism, Nationalism, and the Destruction of the Ottoman Armenians. Oxford: Oxford University Press. ISBN0-19-927356-1. OCLC57483924.
Herzig, Edmund; Kurkchiyan, Marina (2005). The Armenians: Past and Present in the Making of National Identity. London: RoutledgeCurzon. pp.66 & 115–117. ISBN0-203-00493-0. OCLC229988654.
Pipes, Richard (1959). "Demographic and Ethnographic Changes in Transcaucasia, 1897-1956". Middle East Journal. 13 (1). Middle East Institute: 41–63. JSTOR4323084.
This page is based on this Wikipedia article Text is available under the CC BY-SA 4.0 license; additional terms may apply. Images, videos and audio are available under their respective licenses.


