| Demographics of Montenegro | |
|---|---|
 Population pyramid of Montenegro in 2020 | |
| Population | 623,633 (2023 census) |
| Growth rate | +0.05% (2023 census) |
| Birth rate | 11.19 births/1,000 population (2022 est.) |
| Death rate | 10.33 deaths/1,000 population (2022 est.) |
| Life expectancy | 77.75 years |
| • male | 75.32 years |
| • female | 80.27 years (2022 est.) |
| Fertility rate | 1.81 children born/woman (2022 est.) |
| Infant mortality rate | 3.24 deaths/1,000 live births |
| Net migration rate | -4.97 migrant(s)/1,000 population (2022 est.) |
| Age structure | |
| 0–14 years | 18.14% |
| 65 and over | 16.02% |
| Sex ratio | |
| Total | 0.97 male(s)/female (2022 est.) |
| At birth | 1.04 male(s)/female |
| Under 15 | 1.07 male(s)/female |
| 65 and over | 0.69 male(s)/female |
| Nationality | |
| Nationality | Montenegrin |
| Major ethnic | Montenegrin (41.12%) |
| Minor ethnic | Serb (32.93%) |
| Language | |
| Official | Montenegrin (34.52%) |
| Spoken | Serbian (43.18%) |
| Year | Pop. | ±% p.a. |
|---|---|---|
| 1921 | 311,341 | — |
| 1931 | 360,044 | +1.46% |
| 1948 | 377,189 | +0.27% |
| 1953 | 419,873 | +2.17% |
| 1961 | 471,894 | +1.47% |
| 1971 | 529,604 | +1.16% |
| 1981 | 584,310 | +0.99% |
| 1991 | 615,035 | +0.51% |
| 2003 | 620,145 | +0.07% |
| 2011 | 620,029 | −0.00% |
| 2023 | 623,633 | +0.05% |
| Source: [1] [2] | ||
Demographic features of the population of Montenegro include population density, ethnicity, education level, health of the populace, economic status, religious affiliations and other aspects.
Contents
- Population size and structure
- Population censuses
- Structure of the population
- Vital statistics
- Current vital statistics
- Marriages and divorces
- Nationality/Ethnicity
- Ethnic population 1909–20231
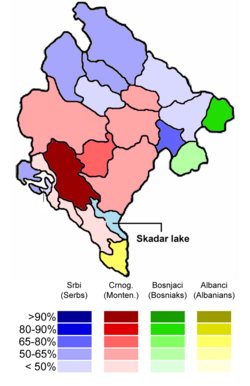
- Ethnic structure by region
- Refugees from Kosovo
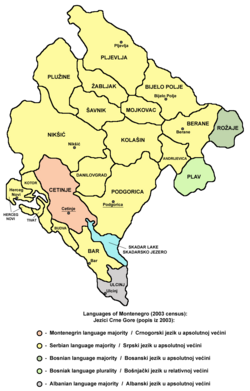
- Linguistic structure
- Religious structure
- See also
- References