Demographics of Germany

Last updated

Demographics of Germany
Germany population pyramid.svg
Population pyramid as of 31 December 2020
PopulationIncrease2.svg 84,607,016 (30 September 2023) [1]
Growth rateIncrease2.svg 0.1 (2021)
Birth rate9.3 births/1,000 population (2020) [2]
Death rate11.8 deaths/1,000 population (2020) [2]
Life expectancy81.2 years (2018–2020) [3]
  male78.64 years
  female83.40 years
Fertility rateDecrease2.svg 1.46 children born/woman (2022)
Infant mortality rate3.46 deaths/1,000 live births (2014)
Net migration rate1.06 migrant(s)/1,000 population (2014)
Sex ratio
Total0.97 male(s)/female (2015)
At birth1.06 male(s)/female
Under 151.05 male(s)/female
15–64 years1.02 male(s)/female
65 and over0.76 male(s)/female
Nationality
Nationalitynoun: German(s) adjective: German
Major ethnic Germans
Language
Spoken German, others
Population between 1800 and 2000 Population of German territories 1800 - 2000.JPG
Population between 1800 and 2000
Population density in Germany, by kreis/district Population density in Germany.png
Population density in Germany, by kreis/district
Population density in 1925 Population density in Germany by district, 1925.svg
Population density in 1925
Historical population
YearPop.±% p.a.
1500 9,200,000    
1550 12,900,000+0.68%
1600 16,200,000+0.46%
1650 10,000,000−0.96%
1700 14,100,000+0.69%
1750 18,300,000+0.52%
1800 22,700,000+0.43%
1850 35,303,000+0.89%
1870 40,804,000+0.73%
1900 56,046,000+1.06%
1910 64,568,000+1.43%
1920 61,974,000−0.41%
1930 64,294,000+0.37%
1940 69,838,000+0.83%
1950 69,346,000−0.07%
1960 73,147,000+0.54%
1970 78,069,000+0.65%
1980 78,397,000+0.04%
1990 79,753,227+0.17%
2000 82,259,540+0.31%
2010 81,751,602−0.06%
2020 83,155,031+0.17%
Source: DESTATIS (after 1950), Histat (1850−1940 Reich Boundaries), [4] Max Planck Society (1500−1840 Reich Boundaries (incl .Als.-Lor.)) [5]

The demography of Germany is monitored by the Statistisches Bundesamt (Federal Statistical Office of Germany). According to the most recent data, Germany's population is 84,607,016 (30 September 2023) [1] making it the most populous country in the European Union and the nineteenth-most populous country in the world. The total fertility rate was rated at 1.58 in 2021, [6] significantly below the replacement rate of 2.1. For a long time Germany had one of the world's lowest fertility rates of around 1.3 to 1.4, however there has been a small increase in recent years. [7] Due to the low birth rate Germany has recorded more deaths than births every year since 1972, [8] which means 2021 was the 50th consecutive year the German population would have decreased without immigration. However, due to immigration the population has actually increased during the last half-century. In 2019 the number of people with a foreign background was 26%; [9] this category includes foreigners, naturalized citizens, ethnic German repatriates from Eastern Europe and the children of all of the above.

Contents

Until the early 20th century Germany was also a large emigrant nation; in the 19th century more than 5 million citizens of the German Empire emigrated to the US alone, and in the early 20th century Germany lost another two million to the US as well as significant numbers to Latin America, Canada and Eastern Europe. However, after World War II immigration began to outweigh emigration, as around 14 million ethnic Germans were expelled from the former eastern provinces of the Reich and other areas in Eastern Europe. Of these, roughly 12 million made their way to present-day Germany and several hundred thousand settled in Austria and other countries, while several hundred thousand died. Some additional 4.5 million ethnic Germans from Eastern Europe repatriated after 1950, especially around the end of the Eastern Bloc and mostly from the former Soviet Union, Poland and Romania. [10] [11]

Large-scale immigration to West Germany began during the time of the Wirtschaftswunder from the 1950s to early 1970s when Germany had a shortage of workers and let in Southern Europeans from countries like Turkey, Italy and Spain on a temporary basis as guest workers. The liberalisation of guest worker legislation allowed many to stay and build a life in West Germany. Germany saw another large wave of immigration towards the end of the 20th century, driven by German reunification, refugee inflows from the Yugoslav Wars and large numbers of Turkish nationals seeking asylum. The next large immigration wave began after eastern expansion of the European Union in 2011 as Eastern Europeans were now allowed to live and work in Germany without a visa. During the European migrant crisis of the mid 2010s Germany took in a large number of refugees, both in absolute terms and relative to other EU member states; the country recorded 476,649 asylum seekers in 2015, 745,545 in 2016 and declining numbers thereafter. [12]

Germany has one of the world's highest levels of education, technological development, and economic productivity. Since the end of World War II, the number of students entering university has more than tripled, and the trade and technical schools are among the world's best. With a per capita income of about €40,883 in 2018, [13] Germany is a broadly middle-class society. However, there has been a strong increase in the number of children living in poverty. In 1965, one in 75 children was on the welfare rolls; but by 2007 this had increased to one child in six. These children live in relative poverty, but not necessarily in absolute poverty. [14] Millions of Germans travel overseas each year. The social welfare system provides for universal health care, unemployment compensation, child benefits and other social programmes. Germany's aging population and struggling economy strained the welfare system in the 1990s, so the government adopted a wide-ranging programme of – still controversial – belt-tightening reforms, Agenda 2010, including the labour-market reforms known as Hartz concept.

History

1945–1990

Population evolution of Germany, since 1950 Population evolution Germany.svg
Population evolution of Germany, since 1950

After the World War II border shifts and expulsions, the Germans from Central and Eastern Europe and the former eastern territories moved westward to post-war Germany. During the partition of Germany, many Germans from East Germany fled to West Germany for political and economic reasons. Since Germany's reunification, there are ongoing migrations from the eastern New Länder to the western Old Länder for economic reasons.

The Federal Republic of Germany and the German Democratic Republic followed different paths when it came to demographics. The politics of the German Democratic Republic was pronatalistic [15] while that of the Federal Republic was compensatory.

Fertility in the GDR was higher than that in the FRG. Demographic politics was only one of the reasons. Women in the GDR had fewer "biographic options", young motherhood was expected of them. State funded costfree childcare was available to all mothers. [16]

Mother's mean age at first birth in East and West Germany

Note: Berlin is included into East Germany for the year 2002 and 2008. Source: Kreyenfeld (2002); Kreyenfeld et al. (2010); HFD Germany (2010) [17]

Year196019701980198520022008
West Germany24.923.825.026.227.628.7
East Germany23.022.522.322.326.427.5

1990–today

About 1.7 million people have left the new federal states (the East) since the fall of the Berlin Wall, or 12% of the population; [18] a disproportionately high number of them were women under 35. [19]

After 1990, the total fertility rate (TFR) in the East dropped to 0.772 in 1994. This has been attributed to a "demographic shock": people not only had fewer children, they were also less likely to marry or divorce after the end of the GDR; the biographic options of the citizens of the former GDR had increased. Young motherhood seemed to be less attractive and the age of the first birth rose sharply. [16]

In the following years, the TFR in the East started to rise again, surpassing 1.0 in 1997 and 1.3 in 2004, and reaching the West's TFR (1.37) in 2007. In 2010, the East's fertility rate (1.459) clearly exceeded that of the West (1.385), while Germany's overall TFR had risen to 1.393, the highest value since 1990, [20] [21] which was still far below the natural replacement rate of 2.1 and the birth rates seen under communism. In 2016, the TFR was 1.64 in the East and 1.60 in the West. [22]

Between 1989 and 2009, about 2,000 schools closed because there were fewer children. [18]

In some regions the number of women between the ages of 20 and 30 has dropped by more than 30%. [18] In 2004, in the age group 18–29 (statistically important for starting families) there were only 90 women for every 100 men in the new federal states (the East, including Berlin).

Until 2007 family politics in the federal republic was compensatory, which means that poor families received more family benefits (such as the Erziehungsgeld) than rich ones. In 2007 the so-called Elterngeld was introduced. According to Christoph Butterwegge the Elterngeld was meant to "motivate highly educated women to have more children"; the poor on the other hand were disadvantaged by the Elterngeld, and now received lower child benefits than the middle classes. [23] The very well-off (who earn more than 250.000 Euro per annum) and those on welfare receive no Elterngeld payments. [24]

In 2013 the following most recent developments were noticed: [25]

In the new federal states the fertility rate of college-educated women is now higher than that of those without college degrees. Differences in value priorities and the better availability of childcare in the eastern states are discussed as possible reasons. [26]

In 2019, the non-profit Austrian Institute of Economic Research and the Bertelsmann Stiftung published a study about the economic impact of demographics. The researchers assume a reduction in the per capita income of 3,700 until 2040. [27]

Population

Historical population of Germany Historical population of Germany.svg
Historical population of Germany

The contemporary demographics of Germany used to also be measured by a series of full censuses mandated by the state, with the most recent held in 1987. Since reunification, German authorities rely on a micro census. Demographic statistics according to the World Population Review. [28] Due to the privacy concerns of the German population after reunification, Germany did not hold a regular census until the EU-mandated 2011 German Census. The requirement was met with large disapproval. As required by the EU, Germany now continues to hold censuses every 10 years. [29]

[30]

Population growth

Population growth rate
–0.17% (2018 est.) Country comparison to the world: 208th

Fertility

Fertility rate in Germany by district, average of 2017-2019 Karte Fertalitatsrate 2017 - 2019.svg
Fertility rate in Germany by district, average of 2017–2019

The total fertility rate is the number of children born per woman. It is based on fairly good data for the entire period. Sources: Our World In Data and Gapminder Foundation. [31]

Total fertility rate in Germany [31]
Years18001801180218031804180518061807180818091810
5.45.405.395.395.385.385.375.375.365.365.35
Years1811181218131814181518161817181818191820
5.355.345.345.335.335.325.325.335.355.37
Years1821182218231824182518261827182818291830
5.355.335.315.285.265.175.074.974.884.78
Years1831183218331834183518361837183818391840
4.804.834.854.884.94.94.94.94.94.9
Years1841184218431844184518461847184818491850
4.94.954.975.005.025.025.025.015.015.01
Years1851185218531854185518561857185818591860
4.874.744.604.474.334.454.564.674.794.90
Years1861186218631864186518661867186818691870
4.934.965.005.035.065.095.115.135.165.18
Years1871187218731874187518761877187818791880
5.245.305.355.415.465.385.305.225.145.06
Years1881188218831884188518861887188818891890
5.145.215.295.285.265.255.235.225.215.20
Years189118921893189418951896189718981899
5.185.175.165.145.115.095.065.044.99
Mother's mean age at first birth
29.4 years (2015 est.)

Life expectancy

Sources: Our World In Data and the United Nations.

Life expectancy in Germany since 1875 Life expectancy in Germany.svg
Life expectancy in Germany since 1875
Life expectancy in Germany since 1960 by gender Life expectancy by WBG -Germany -diff.png
Life expectancy in Germany since 1960 by gender

1875–1950

Years187518851895190519111915192519351946 [32]
Life expectancy in Germany38.539.542.845.549.040.557.461.560.5

1950–2015

PeriodLife expectancy in
Years
PeriodLife expectancy in
Years
1950–195567.51985–199075.0
1955–196068.91990–199576.0
1960–196570.01995–200077.3
1965–197070.72000–200578.6
1970–197571.22005–201079.7
1975–198072.32010–201580.4
1980–198573.72015–202081.1

Source: UN World Population Prospects [33]

Life expectancy at birth
total population: 80.8 years. Country comparison to the world: 34th
male: 78.5 years
female: 83.3 years (2017 est.)

Age structure

0–14 years: 12.83% (male 5,299,798 /female 5,024,184)
15–24 years: 9.98% (male 4,092,901 /female 3,933,997)
25–54 years: 39.87% (male 16,181,931 /female 15,896,528)
55–64 years: 14.96% (male 5,989,111 /female 6,047,449)
65 years and over: 22.36% (male 7,930,590 /female 10,061,248) (2018 est.)
Median age:
total: 47.4 years. Country comparison to the world: 3rd
male: 46.2 years
female: 48.5 years (2018 est.)
Animated population pyramid Gemany population pyramid.gif
Animated population pyramid
Three population pyramids of Germany: in 1889, 1989 and 2000 DBP 1989 1426 Gesetzliche Rentenversicherung.jpg
Three population pyramids of Germany: in 1889, 1989 and 2000

Vital statistics

Statistics since 1817

Population statistics since 1817. [34] [35] Territorial changes of Germany occurred in 1866 (establishment of North German Confederation, 1871) (German unification and annexation of Alsace-Lorraine), 1918/1919, 1921/1922, 1945/1946 and in 1990. Death data is incomplete for both world wars, especially WWII.

Average population (June 30)Live birthsDeathsNatural changeCrude birth rate (per 1000)Crude death rate (per 1000)Natural change (per 1000)Crude migration change (per 1000) Total Fertility Rates [fn 1] [31] [36] [37] [38] [39]
All of
Germany
FRG (Former)
GDR
181725,009,000987,856675,243312,61339.527.012.5
181825,369,0001,002,076687,500314,57639.527.112.42.0
181925,733,0001,067,920717,951349,96941.527.913.60.7
182026,101,0001,041,430636,864404,56639.924.415.5-1.2
182126,473,0001,080,098606,232473,86740.822.917.9-3.6
182226,851,0001,065,985660,535405,45039.724.615.1-0.8
182327,217,0001,056,020666,817389,20338.824.514.3-0.7
182427,571,0001,064,241667,218397,02238.624.214.4-1.4
182527,930,0001,092,063684,285407,77839.124.514.6-1.6
182628,259,0001,099,275737,560361,71538.926.112.8-1.0
182728,558,0001,030,944753,931277,01336.126.49.70.9
182828,863,0001,041,954767,756274,19936.126.69.51.2
182929,143,0001,028,748810,175218,57335.327.87.52.2
183029,392,0001,043,416805,341238,07535.527.48.10.4
183129,642,0001,037,047901,117136,35335.030.44.63.9
183229,906,0001,019,795864,283155,51134.128.95.23.7
183330,185,0001,107,790860,273247,51736.728.28.21.1
183430,467,0001,145,559895,730249,82937.629.48.21.1
183530,802,0001,121,193807,012314,18036.426.210.20.8
183631,129,0001,142,434806,241336,19336.725.910.8-0.2
183731,455,0001,141,817915,341226,47636.329.17.23.3
183831,824,0001,155,211827,424327,78736.326.010.31.4
183932,223,0001,172,917876,466296,45236.427.29.23.3
184032,621,0001,187,404864,457322,94836.426.59.92.5
184132,979,0001,201,587864,075337,51236.426.210.20.8
184233,298,0001,251,102902,529348,57337.627.110.5-0.8
184333,605,0001,209,762905,608304,15436.026.99.10.1
184433,922,0001,216,429830,345386,08435.924.511.4-2.0
184534,284,0001,278,286867,729410,55737.325.312.0-1.3
184634,610,0001,244,369939,436304,93336.027.18.80.7
184734,784,0001,156,820983,981172,83933.328.35.00
184834,839,0001,160,5331,011,954148,57933.329.04.3-2.7
184935,004,0001,333,379947,476385,90338.127.111.0-6.3
185035,303,0001,311,726903,521408,20337.225.611.6-3.1
185135,620,0001,306,877889,601417,27636.725.011.7-2.7
185235,858,0001,271,4461,018,135253,31135.528.47.1-0.4
185335,989,0001,244,192978,650265,54234.627.27.4-3.7
185435,923,0001,226,769972,726254,04334.027.06.9-8.7
185536,136,0001,162,9451,016,284146,66132.228.14.11.8
185636,257,0001,215,390913,913301,47733.525.28.3-5.0
185736,524,0001,315,034991,753323,28136.027.28.9-1.5
185836,828,0001,354,817985,176368,64136.826.810.0-1.7
185937,188,0001,393,339956,924436,41537.525.711.7-1.9
186037,609,0001,367,012873,364493,64836.323.213.1-1.8
186138,001,0001,357,355972,989384,36635.725.610.10.3
186238,360,0001,358,896945,530413,36635.424.610.8-1.4
186338,763,0001,454,340996,193458,14737.525.711.8-1.3
186439,187,0001,481,7781,027,756454,02237.826.211.6-0.7
186539,545,0001,488,6201,091,419397,20137.627.610.0-0.9
186639,765,0001,505,2871,217,591287,69637.830.67.2-1.6
186740,031,0001,471,7471,045,534426,21336.826.110.6-3.9
186840,223,0001,481,7271,110,620371,10736.827.69.2-4.4
186940,493,0001,529,3871,089,503439,88437.826.910.9-4.2
187040,804,0001,569,2061,117,875451,33138.527.411.1-3.4
187140,997,0001,414,2481,212,869201,37934.529.64.9-0.24.47
187241,230,0001,626,0371,194,732431,30539.529.010.5-4.85.11
187341,564,0001,648,1171,174,293473,82439.728.311.4-3.35.17
187442,004,0001,683,4401,122,396561,04440.126.713.4-2.85.24
187542,518,0001,724,4121,172,393552,01940.627.613.0-0.85.34
187643,059,0001,761,0461,134,452626,59440.926.314.6-1.95.42
187743,610,0001,744,6591,152,023592,63640.026.413.6-0.85.34
187844,135,0001,716,8521,156,337560,51535.528.412.7-0.75.20
187944,655,0001,737,0801,143,168593,91238.926.212.5-0.75.22
188045,095,0001,696,1751,173,205522,97037.626.011.6-1.75.05
188145,426,0001,682,6491,156,391525,75837.025.511.5-4.24.98
188245,717,0001,702,3481,176,853525,49537.225.711.5-5.15.01
188346,014,0001,683,6991,190,002493,69736.625.910.7-4.24.92
188446,335,0001,725,5831,203,500522,08337.226.011.3-4.35.02
188546,705,0001,729,9271,199,742530,18537.025.711.4-3.44.99
188647,103,0001,746,1331,233,737512,39637.126.210.9-2.44.99
188747,540,0001,757,0791,151,924605,15536.924.212.7-3.44.96
188848,020,0001,761,4071,142,826618,58136.623.712.9-2.84.92
188948,512,0001,772,5701,153,087619,48336.423.712.8-2.64.88
189049,239,0001,759,2531,199,006560,24735.724.411.43.64.78
189149,767,0001,840,1721,164,421675,75137.023.413.6-2.94.92
189250,279,0001,795,9711,211,402584,56935.724.111.6-1.34.73
189350,778,0001,865,7151,248,201617,51436.824.612.2-2.34.83
189451,339,0001,841,2051,144,331696,87435.922.313.6-2.64.70
189552,001,0001,877,2781,151,488725,79036.122.114.0-1.14.71
189652,753,0001,914,7491,098,966815,78336.320.815.5-1.04.72
189753,549,0001,926,6901,142,056784,63436.121.314.70.44.67
189854,406,0001,964,7311,117,860846,87136.120.515.60.44.69
189955,248,0001,980,3041,185,197795,10735.921.514.41.14.66
190056,046,0001,996,1391,236,382759,75735.622.113.60.84.63
190156,874,0002,032,3131,174,489857,82435.720.715.0-0.24.65
190257,767,0002,024,7351,122,492902,24335.119.415.704.56
190358,629,0001,983,0781,170,905812,17333.820.013.81.14.40
190459,475,0002,025,8471,163,183862,66434.019.614.5-0.14.42
190560,314,0001,987,1531,194,314792,83933.019.813.11.04.27
190661,153,0002,022,4771,112,202910,27533.118.214.9-1.04.28
190762,013,0001,999,9331,117,309882,62432.318.014.2-0.14.18
190862,863,0002,015,0521,135,490879,56232.118.114.0-0.34.15
190963,857,0001,978,2781,094,217884,06131.017.213.91.94.01
191064,568,0001,924,7781,045,665879,11329.816.213.6-2.53.85
191165,359,0001,870,7291,130,784739,94528.617.311.31.03.69
191266,146,0001,869,6361,029,749839,88728.315.612.7-0.73.64
191366,978,0001,838,7501,004,950833,80027.515.012.40.23.53
191467,790,0001,818,5961,291,310527,28626.819.07.84.33.44
191567,883,0001,382,5461,450,420–67,87420.421.4–1.02.42.58
191667,715,0001,029,4841,298,054–268,57015.219.2–4.11.61.90
191767,368,000912,1091,345,424–433,31513.920.6–6.41.31.66
191866,811,000926,8131,606,475–679,66214.324.8–10.21.91.67
191962,897,0001,260,500978,380282,12020.015.64.5-63.12.37
192061,794,0001,599,287932,929666,35825.915.110.8-28.33.06
192162,473,0001,581,130869,555711,57525.313.911.4-0.42.98
192261,890,0001,424,804890,181534,62323.014.48.6-17.92.69
192362,250,0001,318,489866,754451,73521.213.97.2-1.42.45
192462,740,0001,290,763766,957523,80620.612.28.3-0.42.37
192563,110,0001,311,259753,017558,24220.811.98.8-2.92.38
192663,510,0001,245,471742,955502,51619.611.77.9-1.62.23
192763,940,0001,178,892765,331413,56118.412.06.50.32.09
192864,470,0001,199,998747,444452,55418.611.67.01.32.11
192964,670,0001,164,062814,545349,51718.012.65.4-2.32.02
193065,130,0001,144,151718,807425,34417.611.06.50.61.98
193165,510,0001,047,775734,165313,61016.011.24.81.01.80
193265,716,000993,126707,642285,48415.110.84.3-1.21.70
193366,027,000971,174737,877233,29714.711.23.51.21.67
193466,409,0001,198,350725,000473,00018.010.97.1-1.32.07
193566,871,0001,263,976792,018471,95818.911.87.1-0.12.20
193667,349,0001,278,583795,793482,79019.011.87.2-0.12.25
193767,831,0001,277,046794,367482,67918.811.77.10.12.28
193868,424,0001,348,534799,220549,31419.711.78.00.72.45
193969,314,0001,413,230854,348558,88220.412.38.14.92.59
194069,838,0001,402,258885,591516,66720.112.77.40.22.59
194170,244,0001,308,232844,435463,79718.612.06.6-0.82.43
194270,834,0001,055,915847,861208,05414.912.02.95.51.97
194370,411,0001,124,718853,246271,47216.012.13.9-9.92.10
194469,000,0001,090,000(e)915,000175,00015.813.32.5-22.52.05
194566,000,000820,000(e)1,210,000–390,00012.418.3–5.9-37.61.56
194664,260,000921,9981,001,331–79,33314.315.6–1.2-25.21.76
194765,842,0001,028,421932,62895,79315.614.21.523.11.922.011.75
194867,365,0001,049,074804,839244,23515.611.93.619.51.962.071.76
194968,080,0001,106,803770,852335,95116.311.34.95.72.112.142.03
195068,374,0001,116,701748,329368,37216.310.95.4-1.12.142.102.35
195168,882,0001,106,380752,697353,68316.110.95.12.32.162.062.46
195269,171,0001,105,084767,639337,44516.011.14.9-0.72.162.082.42
195369,564,0001,095,029790,654304,37515.711.44.41.32.152.072.40
195469,934,0001,109,743775,291334,45215.911.14.80.52.182.122.38
195570,307,0001,113,408795,938317,47015.811.34.50.82.182.112.38
195670,711,0001,137,169812,111325,05816.111.54.61.12.222.192.30
195771,166,0001,165,555840,195325,36016.411.84.61.82.282.282.24
195871,637,0001,175,870818,418357,45216.411.45.01.62.292.292.22
195972,180,0001,243,922835,402408,52017.211.65.71.92.362.342.37
196072,664,0001,261,614876,721384,89317.412.15.31.42.372.372.35
196173,352,0001,313,505850,300463,20517.911.66.33.22.452.472.42
196274,049,0001,316,534878,814437,72017.811.95.93.62.442.452.42
196375,019,0001,355,595895,070460,52518.111.96.17.02.512.522.47
196475,273,0001,357,304870,319486,98518.011.66.5-3.12.542.552.48
196576,061,0001,325,386907,882417,50417.411.95.55.02.502.512.48
196676,734,0001,318,303911,984406,31917.211.95.33.52.512.542.43
196776,954,0001,272,276914,417357,85916.511.94.7-1.82.482.542.34
196877,249,0001,214,968976,521238,44715.712.63.10.72.382.392.30
196977,918,0001,142,366988,092154,27414.712.72.06.72.212.202.24
197077,772,0001,047,737975,66472,07313.512.50.9-2.82.031.992.19
197178,355,0001,013,396965,62347,77312.912.30.66.91.961.922.13
197278,717,000901,657965,689−64,03211.512.3−0.85.41.731.721.79
197378,951,000815,969962,988−147,01910.312.2−1.94.91.561.541.58
197478,966,000805,500956,573−151,07310.212.1−1.92.11.531.511.54
197578,862,000782,310989,649−207,3399.912.5−2.61.31.481.451.54
197678,299,000798,334966,873−168,53910.212.3−2.2-4.91.511.461.64
197778,161,000805,496931,155−125,65910.311.9−1.6-0.21.511.401.85
197878,066,000808,619955,550−146,93110.412.2−1.90.71.501.381.90
197978,082,000817,217944,474−127,25710.512.1−1.61.81.501.391.90
198078,295,000865,789952,371−86,58211.112.2−1.13.81.561.441.94
198178,399,000862,100954,436−92,33611.012.2−1.22.51.531.431.85
198278,293,000861,275943,832−82,55711.012.1−1.1-0.31.511.411.86
198378,082,000827,933941,032−113,09910.612.1−1.4-1.31.431.331.79
198477,797,000812,292917,299−105,00710.411.8−1.3-2.41.391.291.74
198577,619,000813,803929,649−115,84610.512.0−1.5-0.81.371.281.73
198677,635,000848,232925,426−77,19410.911.9−1.01.21.411.341.70
198777,718,000867,969901,291−33,32211.211.6−0.41.51.431.371.74
198878,116,000892,993900,627−7,63411.411.5−0.15.21.461.411.67
198978,677,000880,459903,441−22,98211.211.5−0.37.51.421.391.56
199079,753,227 [40] 905,675921,445-15,77011.411.6−0.213.91.451.451.52
199180,274,564830,019911,245−81,22610.411.4−1.07.51.331.420.98
199280,974,632809,114885,443−76,32910.111.0−1.09.71.291.400.83
199381,338,093798,447897,270−98,8239.911.1−1.25.71.281.390.78
199481,538,603769,603884,661−115,0589.510.9−1.43.91.241.350.77
199581,817,499765,221884,588−119,3679.410.8−1.54.91.251.340.84
199682,012,162796,013882,843−86,8309.710.8−1.13.51.321.400.95
199782,057,379812,173860,389−48,2169.910.5−0.61.21.371.441.04
199882,037,011785,034852,382−67,3489.610.4−0.80.61.361.411.09
199982,163,475770,744846,330−75,5869.410.3−0.92.41.361.411.15
200082,259,540766,999838,797−71,7989.310.2−0.92.11.381.411.21
200182,440,309734,475828,541−94,0668.910.1−1.13.31.351.381.23
200282,536,680719,250841,686−122,4368.710.2−1.52.71.341.371.24
200382,531,671706,721853,946−147,2258.610.3−1.81.71.341.361.26
200482,500,849705,622818,271−112,6498.59.9−1.41.01.361.371.31
200582,437,995685,795830,227−144,4328.310.1−1.81.01.341.361.30
200682,314,906672,724821,627−148,9038.210.0−1.80.31.331.341.30
200782,217,837684,862827,155−142,2938.310.0−1.70.51.371.381.37
200881,802,257682,514844,439−161,9258.310.3−2.0-3.11.381.371.40
200981,802,257665,126854,544−189,4188.110.4−2.32.31.361.351.40
201081,751,602677,947858,768−180,8218.310.5−2.21.61.391.391.46
201180,233,100 [41] 662,685852,328−189,6438.110.4−2.3-16.31.391.381.46
201280,399,300673,544869,582−196,0388.410.8−2.44.51.411.401.48
201380,585,700682,069893,825−211,7568.511.1−2.65.01.421.411.49
201480,925,000714,927868,356−153,4298.910.8−1.96.11.471.471.54
201581,459,000737,575925,200−187,6259.111.4−2.38.91.501.501.56
201682,349,400792,141910,902−118,7619.611.1−1.412.41.591.601.64
201782,665,600784,901932,272−147,3719.511.3−1.85.61.571.581.61
201882,887,000787,523954,874−167,3519.511.5−2.04.71.571.581.60
201983,073,062778,090939,520−161,4309.411.3−1.94.21.541.561.56
202083,122,889773,144985,572−212,4289.311.8−2.63.21.531.551.54
202183,129,285795,4921,023,687−228,1959.612.3−2.72.81.581.601.54
202284,079,811738,8191,066,341–327,5228.812.7–3.915.41.461.481.43
202384,482,267693,455(e)1,020,907-327 4528.2(e)12.2–41.37(e)

In 2022, 547,254 (74.07%) children were born to mothers with German citizenship, while 97,345 (13.18%) children were born to mothers with European citizenship (excluding Turkey) and 94,220 (12.75%) children were born to mothers with other citizenship.

Current vital statistics

PeriodLive birthsDeathsNatural increase
January—November 2022681,902951,284-269,382
January—November 2023630,995923,279-292,284
DifferenceDecrease2.svg -50,907 (−7.46%)Decrease Positive.svg -28,005 (-2.94%)Increase Negative.svg +22,902

[42] [43] [44]

Structure of the population

Population by Sex and Age Group (Census 09.V.2011): [45]
Age GroupMaleFemaleTotal%
Total39 145 94141 073 75480 219 695100
0–41 714 8721 624 0233 338 8954.16
5–91 809 0241 716 8063 525 8304.40
10–142 021 3051 919 2613 940 5664.91
15–192 057 1551 956 7254 013 8805.00
20–242 463 9322 371 7074 835 6396.03
25–292 455 8852 416 6484 872 5336.07
30–342 385 3052 366 6064 751 9115.92
35–392 378 0552 364 8384 742 8935.91
40–443 209 4813 141 7086 351 1897.92
45–493 547 2543 452 4256 999 6798.73
50–543 113 4633 092 8316 206 2947.74
55–592 668 9762 750 4745 419 4506.76
60–642 298 9032 403 9124 702 8155.86
65-691 999 2872 174 0644 173 3515.20
70-742 247 1962 614 0434 861 2396.06
75-791 413 8811 856 4023 270 2834.08
80-84878 7971 449 2862 328 0832.90
85-89369 029966 0471 335 0761.66
90-9495 074335 526430 6000.54
95-9917 38888 656106 0440.13
100+1 67911 76613 4450.02
Age groupMaleFemaleTotalPercent
0–145 545 2015 260 09010 805 29113.47
15–6426 578 40926 317 87452 896 28365.94
65+7 022 3319 495 79016 518 12120.59
Population Estimates by Sex and Age Group (01.I.2021) (Based on the results of the 2011 Population Census.): [45]
Age GroupMaleFemaleTotal%
Total41 026 51942 128 51283 155 031100
0–42 036 0841 933 0543 969 1384.77
5–91 944 1711 839 3973 783 5684.55
10–141 916 1101 808 9843 725 0944.48
15–191 991 4871 865 2873 856 7744.64
20–242 394 2212 176 2704 570 4915.50
25–292 552 8062 360 1334 912 9395.91
30–342 876 9382 704 1505 581 0886.71
35–392 688 8732 602 0035 290 8766.36
40–442 531 2082 503 6805 034 8886.05
45–492 526 2782 509 5825 035 8606.06
50–543 265 1313 222 0936 487 2247.80
55–593 414 1243 403 1946 817 3188.20
60–642 866 5612 951 5765 818 1377.00
65-692 333 7882 565 3164 899 1045.89
70-741 854 5142 113 5563 968 0704.77
75-791 551 0301 916 9983 468 0284.17
80-841 432 3181 998 1843 430 5024.13
85-89615 6081 046 6331 662 2412.00
90-94200 432471 151671 5830.81
95-9930 826120 817151 6430.18
100-1043 12213 58716 7090.02
105-1097032 4173 120<0.01
110+186450636<0.01
Age groupMaleFemaleTotalPercent
0–145 896 3655 581 43511 477 80013.80
15–6427 107 62726 297 96853 405 59564.22
65+8 022 52710 249 10918 271 63621.97

Social issues

Most childbirths in Germany happen within marriage. Out of 778,080 births in 2019, 258,835 were to unmarried parents, [46] which means that around 33% or one third of the children are born out of wedlock, while two thirds are within. This percentage of unmarried birth has long been growing and reached 33% in 2010, more than twice of what it was in 1990. [47] However in recent years it has started to stagnate or even decrease. [48]

The Mikrozensus done in 2008 revealed that the number of children a German woman aged 40 to 75 had, was closely linked to her educational achievement. [49] In Western Germany the most educated women were the most likely to be childless. 26% of those groups stated they were childless, while 16% of those having an intermediate education, and 11% of those having compulsory education, stated the same. In Eastern Germany however, 9% of the most educated women of that age group and 7% of those who had an intermediary education were childless, while 12% of those having only compulsory education were childless.

The reason for that east-western difference is that the GDR had an "educated mother scheme" and actively tried to encourage first births among the more educated. It did so by propagandizing the opinion that every educated woman should "present at least one child to socialism" and also by financially rewarding its more educated citizen to become parents. The government especially tried to persuade students to become parents while still in college and it was quite successful in doing so. In 1986 38% of all women, who were about to graduate from college, were mothers of at least one child and additional 14% were pregnant and 43% of all men, who were about to graduate from college, were fathers of at least one child. There was a sharp decline in the birth rate and especially in the birth rate of the educated after the fall of the Berlin wall. Nowadays,[ when? ] 5% of those about to graduate from college are parents.

The more educated a Western German mother aged 40 to 75 was in 2008, the less likely she was to have a big family.

Percent of Western German mothers having 1, 2 and 3 or more children by educational attainment
number of childrencompulsory educationintermediary educationhighest education
one child223031
two children394848
three or more children392221
[50]

The same was true for a mother living in Eastern Germany in 2008.

Percent of Eastern German mothers having 1, 2 and 3 and more children by educational attainment
number of childrencompulsory educationintermediary educationhighest education
one child233333
two children374651
three or more children402116
[50]

In 2011, this trend was reversed in Eastern Germany, where more highly educated women now had a somewhat higher fertility rate than the rest of the population. [51]

Persons who said they had no religion tend to have fewer children than those who identify as Christians, and studies also found that conservative-leaning Christians had more children compared to liberal-leaning Christians. [52] [53]

A study done in 2005 in the western German state of Nordrhein-Westfalen by the HDZ revealed that childlessness was especially widespread among scientists. It showed that 78% of the women scientists and 71% of the male scientists working in that state were childless. [54]

Homelessness

Homelessness in Germany is a significant social issue, one that is estimated to affect around 678,000 people. [55] This figure includes about 372,000 people that are accommodated (in refugee shelters, etc.) by public services, e.g. by the municipalities. [56] Since 2014, there has been a 150% increase in the homeless population within the country. [57] Reportedly, around 22,000 of the homeless population are children. [55] [ citation needed ]

In addition, the country has yet to publish statistics on homelessness at a Federal Level [58] despite it being an ongoing and widespread matter.

Ethnic minorities and migrant background (Migrationshintergrund)

Germany does not collect data on the ethnic and racial identifications of its citizens, but does collect data on the background group by birth of an individual. [59] The Federal Statistical Office defines persons with a migrant background as all persons who migrated to the present area of the Federal Republic of Germany after 1949, plus all foreign nationals born in Germany and all persons born in Germany as German nationals with at least one parent who migrated to Germany or was born in Germany as a foreign national. The figures presented here are based on this definition only.

In 2010, 2.3 million families with children under 18 years were living in Germany, in which at least one parent had foreign roots. They represented 29% of the total of 8.1 million families with minor children. Compared with 2005 – the year when the microcensus started to collect detailed information on the population with a migrant background – the proportion of migrant families has risen by 2 percentage points. [60] In 2019, 40% children under 5 years old had migrant background. [61]

Most of the families with a migrant background live in the western part of Germany. In 2010, the proportion of migrant families in all families was 32% in the former territory of the Federal Republic. This figure was more than double that in the new Länder (incl. Berlin) where it stood at 15%. [60] Eastern Germany has a much lower proportion of immigrants than the West, as the GDR did not let in that many guest workers and Eastern Germany's economy is not doing as well as West Germany's and had a higher percentage of jobless persons until recently. However in recent years the number of people with an immigrant background in East Germany has been growing as refugees (as well as German Repatriates) are distributed with the Königssteiner Schlüssel, so every German state has to take the same number of them compared to its population and economy. In 2019 19.036 million people or 89,6% of people with an immigrant background live in Western Germany (excluding Berlin), being 28,7% of its population, while 1.016 million people with immigrant background 4,8% live in Eastern States, being 8,2% of population, and 1.194 million people with an immigrant background 5,6% live in Berlin, being 33,1% of its population. [61]

In 2019, 26% of Germans of any age group (up from 18,4% in 2008) and 39% of German children (up from 30% in 2008) had at least one parent born abroad. Average age for Germans with at least one parent born abroad was 35.6 years (up from 33.8 years in 2008), while that for Germans, who had two parents born in Germany was 47.3 years (up from 44.6 in 2008). [61] [62]

In 2022, 41 percent of the under-15 age group had a migrant background, 36 percent of the 15 to 49-year-old age group had a migrant background and 19 percent of the age group above (50+). [63]

The largest groups of people with an immigrant background in Germany are people that have Turkey, Poland and Russia as their ancestral homelands.

As of 2022, the population by background was as follows:

Major groups which reside in Germany by ancestry as of 2019 Major Nationalities in Germany by ancestry.png
Major groups which reside in Germany by ancestry as of 2019

Population of Germany in 2022

  Germans [64] (71.3%)
  Turkish (3.4%)
  Polish (2.6%)
  Russian (1.6%)
  Kazakh (1.6%)
  Syrian (1.5%)
  Romanian (1.3%)
  Italian (1.1%)
  European (Other) (7.7%)
  Asian (Other) (3.7%)
  American (North & South) (0.8%)
  Sub-Saharan African (0.8%)
  Maghreb countries (0.6%)
  Other/unspecified/mixed (2%)
Background groupYear
2005 [65] [66] 2011 [67] [66] 2016 [68] [66] 2022 [66] 2023 [66]
Number%Number%Number%Number%Number%
European (excluding people with European background from Africa, America, Oceania and Asia)72,625,00089.2%71,111,00085.5%71,407,00085.1%
Flag of Europe.svg EU-27 States 69,315,00085.1%66,849,00080.4%66,533,00079.3%
     Without migrant background66,413,00081.3%64,551,00081.4%62,989,00077.4%59,278,00071.3%58,968,00070.3%
      Official flag of Poland.png Polish 1,046,0001,424,0001,868,0002,3%2,201,0002.6%2,199,0002.6%
      Flag of Romania.svg Romanian 406,000472,000788,0001%1,096,0001.3%1,146,0001.4%
      Flag of Italy.svg Italian 794,000701,000861,0001,1%905,0001.1%876,0001.0%
      Flag of Greece.svg Greek 386,000349,000443,0000,5%434,0000.5%432,0000.5%
      Flag of Croatia.svg Croat 410,000325,000441,0000,5%419,0000.5%400,0000.5%
      Flag of Austria.svg Austrian 309,000254,000280,0000,3%353,0000.4%341,0000.4%
      Flag of Bulgaria.svg Bulgarian 49,00077,000238,0000,3%340,0000.4%376,0000.4%
      Flag of Spain.svg Spanish 173,000142,000209,0000,3%233,0000.3%233,0000.3%
      Flag of the Netherlands.svg Dutch 190,000203,000206,0000,3%233,0000.3%218,0000.3%
      Flag of France.svg French 157,000153,000168,0000,2%228,0000.3%222,0000.3%
     Other EU member states (primarily Hungarian, Czech, and Portuguese)824,0001%1,129,0001.4%1,122,0001.3%
European Other 3,310,0004,1%4,262,0005.1%4,874,0005.8%
      Flag of Russia.svg Russian 1,290,0001,189,0001,223,0001,5%1,354,0001.6%1,353,0001.6%
      Flag of Ukraine.svg Ukrainian 246,000272,0000,3%583,0000.7%1,034,0001.2%
      Kosovar Albanian 270,000356,0000,4%542,0000.7%594,0000.7%
      Flag of Bosnia and Herzegovina.svg Bosnian 329,000202,000248,0000,3%538,0000.6%556,0000.7%
      Flag of Serbia.svg Serb 263,065252,000288,0000,4%382,0000.5%387,0000.5%
     Others (primarily Macedonian, Swiss and British)923,0001.1%863,0001%950,0001.1%
Asians 6,218,0007,6%8,495,00010.3%8,842,00010.5%
      Flag of Turkey.svg Turkish 2,766,0002,643,0002,797,0003,4%2,835,0003.4%2,926,0003.5%
      Flag of Kazakhstan.svg Kazakh 917,000969,0001,2%1,325,0001.6%1,311,0001.6%
      Flag of Syria.svg Syrian 53,000521,0000,6%1,225,0001.5%1,281,0001.5%
      Flag of Afghanistan.svg Afghan 88,000131,000231,0000,3%435,0000.5%476,0000.6%
      Flag of Iraq.svg Iraqi 113,000106,000206,0000,3%393,0000.5%399,0000.5%
      Flag of Iran.svg Iranian 150,000130,000164,0000,2%304,0000.4%336,0000.4%
      Flag of the People's Republic of China.svg Chinese 80,00093,000157,0000,2%217,0000.3%217,0000.3%
      Flag of Vietnam.svg Vietnamese 150,000146,000167,0000,2%236,0000.2%215,0000.2%
     Others (primarily Indian, ethnic German repatriates from other post-Soviet Asian states and Arabs from other countries)1,006,0001,2%1,554,0001.9%1,662,0002.0%
African 477,000508,000744,0000.9%1,159,0001.4%1,270,0001.5%
      Sub-Saharan African 222,000246,000395,0000,5%660,0000.8%711,0000.8%
      Flag of Morocco.svg Moroccan 147,000141,000191,0000,2%257,0000.3%278,0000.3%
     Other Maghreb countries:108,000121,000158,0000,2%242,0000.3%281,0000.3%
Americas 331,000324,000421,0000,5%682,0000.8%714,0000.8%
      Flag of the United States.svg American140,000123,000154,0000,2%216,0000.3%215,0000.3%
     Other peoples from the American continent191,000201,000267,0000,3%466,0000.5%499,0000.6%
Australia/Oceania 40,0000,05%26,0000.03%29,0000.03%
Other/unspecified/mixed2,536,0001,310,0001,381,0001,7%1,628,0001.9%1,613,0001.9%
Total: Foreign background15,227,00014,796,00018,443,00022,6%23,825,00028.7%24,907,00029.7%
Total81,640,00079,347,00081,432,000100%83,103,000100%83,875,000100%

Four other sizable groups of people are referred to as "national minorities" (nationale Minderheiten) because they have lived in their respective regions for centuries: Danes, Frisians, Roma and Sinti, and Sorbs. There is a Danish minority (about 50,000, according to government sources) in the northernmost state of Schleswig-Holstein. Eastern and Northern Frisians live at Schleswig-Holstein's western coast, and in the north-western part of Lower Saxony. They are part of a wider community (Frisia) stretching from Germany to the northern Netherlands. The Sorbs, a Slavic people with about 60,000 members (according to government sources), are in the Lusatia region of Saxony and Brandenburg. They are the last remnants of the Slavs that lived in central and eastern Germany since the 7th century to have kept their traditions and not been completely integrated into the wider German nation.

Until World War II the Poles were recognized as one of the national minorities. In 1924 the Union of Poles in Germany had initiated cooperation between all national minorities in Germany under the umbrella organization Association of National Minorities in Germany. Some of the union members wanted the Polish communities in easternmost Germany (now Poland) to join the newly established Polish nation after World War I. [69] Even before the German invasion of Poland, leading anti-Nazi members of the Polish minority were deported to concentration camps; some were executed at the Piaśnica murder site. Minority rights for Poles in Germany were revoked by Hermann Göring's World War II decree of 27 February 1940, and their property was confiscated.

After the war ended, the German government did not re-implement national minority rights for ethnic Poles. The reason for this is that the areas of Germany which formerly had a native Polish minority were annexed to Poland and the Soviet Union, while almost all of the native German populations (formerly the ethnic majority) in these areas subsequently fled or were expelled by force. With the mixed German-Polish territories now lost, the German government subsequently regarded ethnic Poles residing in what remained of Germany as immigrants, just like any other ethnic population with a recent history of arrival. In contrast, Germans living in Poland are recognized as national minority and have granted seats in Polish Parliament. It must be said, however, that an overwhelming number of Germans in Poland have centuries-old historical ties to the lands they now inhabit, whether from living in territory that once belonged to the German state, or from centuries-old communities. In contrast, most Poles in present-day Germany are recent immigrants, though there are some communities which have been present since the 19th and perhaps even the 18th centuries. Despite protests by some in the older Polish-German communities, and despite Germany being now a signatory to the Framework Convention for the Protection of National Minorities, Germany has so far refused to re-implement minority rights for ethnic Poles, based on the fact that almost all areas of historically mixed German-Polish heritage (where the minority rights formerly existed) are no longer part of Germany and because the vast majority of ethnic Poles now residing in Germany are recent immigrants.

Roma people have been in Germany since the Middle Ages. They were persecuted by the Nazis, and thousands of Roma living in Germany were killed by the Nazi regime. Nowadays, they are spread all over Germany, mostly living in major cities. It is difficult to estimate their exact number, as the German government counts them as "persons without migrant background" in their statistics. There are also many assimilated Sinti and Roma. A vague figure given by the German Department of the Interior is about 70,000. In contrast to the old-established Roma population, the majority of them do not have German citizenship, and are classified as immigrants or refugees.

A family of so-called "Spataussiedler" (repatriates of ethnic German origin), because the parents were born abroad they will be counted as "persons with immigrant background" Bundesarchiv B 145 Bild-F079037-0017, Lager Friedland, Familie aus Sibirien.jpg
A family of so-called "Spätaussiedler" (repatriates of ethnic German origin), because the parents were born abroad they will be counted as "persons with immigrant background"

After World War II, 14 million ethnic Germans were expelled from the eastern territories of Germany and homelands outside the former German Empire. The accommodation and integration of these Heimatvertriebene in the remaining part of Germany, in which many cities and millions of apartments had been destroyed, was a major effort in the post-war occupation zones and later states of Germany.

Since the 1960s, ethnic Germans from the People's Republic of Poland and Soviet Union (especially from Kazakhstan, Russia, and Ukraine), have come to Germany. During the time of Perestroika, and after the dissolution of the Soviet Union, the number of immigrants increased heavily. Some of these immigrants are of mixed ancestry. During the 10-year period between 1987 and 2001, a total of 1,981,732 ethnic Germans from the FSU immigrated to Germany, along with more than a million of their non-German relatives. After 1997, however ethnic Slavs or those belonging to Slavic-Germanic mixed origins outnumbered those with only Germanic descent amongst the immigrants. The total number of people currently living in Germany having FSU connection is around 4 to 4.5 million (Including Germans, Slavs, Jews, and those of mixed origins), out of that more than 50% are of German descent. [70] [71]

Germany now has Europe's third-largest Jewish population. In 2004, twice as many Jews from former Soviet republics settled in Germany as in Israel, bringing the total inflow to more than 100,000 since 1991. [72] Jews have a voice in German public life through the Central Council of Jews in Germany (Zentralrat der Juden in Deutschland). Some Jews from the former Soviet Union are of mixed heritage. Today, less than 0.1% of the total population of Germany is Jewish.

In 2019 there were also a growing number of at least 529,000 black Afro-Germans defined as people with an African migrant background. [61] Out of them more than 400 thousand have a citizenship of a Subsahara-African country, [73] with others being German citizens. Most of them live in Berlin and Hamburg. Numerous persons from northern African Tunisia and Morocco live in Germany. While they are considered members of a minority group, for the most part, they do not considers themselves "Afro-Germans", nor are most of them perceived as such by the German people. However, Germany does not keep any statistics regarding ethnicity or race. Hence, the exact number of Germans of African descent is unknown.

Germany's biggest East Asian minorities are the Chinese people in Germany, numbering 189,000 [61] and Vietnamese people in Germany, numbering 188,000, [61] many of whom living in Berlin and eastern Germany. Also there are about 35,000 Japanese citizens residing in Germany. [74] There are also groups of South Asian and Southeast Asian immigrants. Around 163,000 Indians and 124,000 Pakistanis live in Germany. [61] Additionally some 30,000 Filipino citizens and more than 20,000 Indonesian citizens reside in Germany. [74]

Numerous descendants of the so-called Gastarbeiter live in Germany. The Gastarbeiter mostly came from Turkey, Italy, Greece, Spain, Morocco, Portugal, the former Yugoslavia, Tunisia and Chile. Also included were Vietnam, Mongolia, North Korea, Angola, Mozambique and Cuba when the former East Germany existed until reunification in 1990. [75] The (socialist) German Democratic Republic (East Germany) however had their guest-workers stay in single-sex dormitories. [76] Female guest workers had to sign contracts saying that they were not allowed to fall pregnant during their stay. If they fell pregnant nevertheless they faced forced abortion or deportation. [77] This is one of the reasons why the vast majority of ethnic minorities today lives in western Germany and also one of the reasons why minorities such as the Vietnamese have the most unusual population pyramid, with nearly all second-generation Vietnamese Germans born after 1989.

Proportion of Germans without a migrant background (2016) Germans without a migrant background (2016).svg
Proportion of Germans without a migrant background (2016)
Germany is home to the second-largest number of international migrants worldwide. In 2016, around 23% of Germany's population do not hold a German passport or are descendants of immigrants. Map foreign nationals germany 2016.png
Germany is home to the second-largest number of international migrants worldwide. In 2016, around 23% of Germany's population do not hold a German passport or are descendants of immigrants.

Foreign nationals in Germany

German and foreign national population pyramid of Germany in 2021 German and foreign national population pyramid of Germany in 2021.svg
German and foreign national population pyramid of Germany in 2021

As the end of 2022, the most common groups of resident foreign nationals in Germany were as follows: [81]

This list does not include non-ethnic Germans with German nationality and foreign nationals without resident status.

RankNationalityPopulation (31.12.2022)
Total13,383,910
1Flag of Turkey.svg  Turkey 1,487,110
2Flag of Ukraine.svg  Ukraine 1,164,200
3Flag of Syria.svg  Syria 923,805
4 Flag of Europe.svg Flag of Romania.svg  Romania 883,670
5 Flag of Europe.svg Flag of Poland.svg  Poland 880,780
6 Flag of Europe.svg Flag of Italy.svg  Italy 644,970
7 Flag of Europe.svg Flag of Croatia.svg  Croatia 436,325
8 Flag of Europe.svg Flag of Bulgaria.svg  Bulgaria 429,665
9Flag of the Taliban.svg  Afghanistan 377,240
10 Flag of Europe.svg Flag of Greece.svg  Greece 361,270
11Flag of Russia.svg  Russia 290,615
12Flag of Iraq.svg  Iraq 284,595
13Flag of Kosovo.svg  Kosovo 280,850
14Flag of Serbia.svg  Serbia 251,365
15Flag of Bosnia and Herzegovina.svg  Bosnia and Herzegovina 233,775
16 Flag of Europe.svg Flag of Hungary.svg  Hungary 214,695
17Flag of India.svg  India 210,385
18 Flag of Europe.svg Flag of Spain.svg  Spain 193,460
19 Flag of Europe.svg Flag of Austria.svg  Austria 185,755
20 Flag of Europe.svg Flag of the Netherlands.svg  Netherlands 150,295
21Flag of the People's Republic of China.svg  China 149,550
22Flag of North Macedonia.svg  North Macedonia 146,380
23Flag of Iran.svg  Iran 143,555
24 Flag of Europe.svg Flag of France.svg  France 140,320
25 Flag of Europe.svg Flag of Portugal.svg  Portugal 139,435
26Flag of the United States.svg  United States 121,420
27Flag of Vietnam.svg  Vietnam 120,535
28Flag of Albania.svg  Albania 108,555
29Flag of Morocco.svg  Morocco 95,095
30Flag of the United Kingdom.svg  United Kingdom 84,605

Population density and distribution

Population density by municipality Population density of Germany by municipality.svg
Population density by municipality

With an estimated 83.2 million inhabitants in December 2020, [82] Germany is the second-most populous country in Europe after Russia, and ranks as the 19th largest country in the world in terms of population. Its population density stands at 233 inhabitants per square kilometer.

States

Germany comprises sixteen states that are collectively referred to as Länder. [83] Due to differences in size and population the subdivision of these states varies, especially between city-states (Stadtstaaten) and states with larger territories (Flächenländer). For regional administrative purposes four states, namely Baden-Württemberg, Bavaria, Hesse and North Rhine-Westphalia, consist of a total of 19 Government Districts (Regierungsbezirke). As of 2019 Germany is divided into 400 districts (Kreise) on municipal level, these consist of 294 rural districts and 106 urban districts.

Germany states by foreigners as percentage of population as of November 2020 Germany foreigners as percentage of population.png
Germany states by foreigners as percentage of population as of November 2020
State CapitalArea
(km2)
Population [84]
(31 December 2022)
ForeignersPopulation density
(per km2)
North Rhine-Westphalia Düsseldorf 34,11218,139,116 Increase2.svg2,828,367 Increase2.svg532
Bavaria Munich 70,54113,369,116 Increase2.svg2,073,494 Increase2.svg190
Baden-Württemberg Stuttgart 35,74811,280,257 Increase2.svg2,012,237 Increase2.svg316
Lower Saxony Hanover 47,7098,140,242 Increase2.svg959,786 Increase2.svg171
Hesse Wiesbaden 21,1166,391,360 Increase2.svg1,199,775 Increase2.svg303
Rhineland-Palatinate Mainz 19,8584,159,150 Increase2.svg566,026 Increase2.svg209
Saxony Dresden 18,4504,086,152 Increase2.svg300,164 Increase2.svg221
Berlin Berlin 8913,755,251 Increase2.svg834,349 Increase2.svg4,215
Schleswig-Holstein Kiel 15,8042,953,270 Increase2.svg299,787 Increase2.svg187
Brandenburg Potsdam 29,6542,573,135 Increase2.svg179,872 Increase2.svg87
Saxony-Anhalt Magdeburg 20,4542,186,643 Increase2.svg160,990 Increase2.svg107
Thuringia Erfurt 16,2022,126,846 Increase2.svg161,291 Increase2.svg131
Hamburg Hamburg 7551,892,122 Increase2.svg363,283 Increase2.svg2,506
Mecklenburg-Vorpommern Schwerin 23,2951,628,378 Increase2.svg105,437 Increase2.svg70
Saarland Saarbrücken 2,571992,666 Increase2.svg139,189 Increase2.svg386
Bremen Bremen 419684,864 Increase2.svg144,148 Increase2.svg1,634
Germany Berlin 357,58284,358,845 Increase2.svg12,324,195 Increase2.svg236

Urbanization

Germany officially has eleven metropolitan regions. In 2005, Germany had 82 cities with more than 100,000 inhabitants.

Metropolitan regionLocationDescriptionPopulationLarge Minority Groups
Rhine-Ruhr Rhein-Ruhr-Region-LEP.png The metropolitan area is part of the pan-European Blue Banana mega region and is a significant industrial and commercial hub, home to many of Germany's biggest corporations and contributing as much as 15% to the German GDP. Included in the rather polycentric conurbation are the cities of Cologne, Düsseldorf, Bonn, Dortmund and Essen served by two of the country's largest airports Düsseldorf Airport and the Cologne Bonn Airport. Particularly among young Germans, Cologne and Düsseldorf are known for their nightlife and open-minded atmosphere.approx. 10 million Turks, Poles, Italians, Romanians, Africans, Arabs, Greeks, Dutch, Russians, Serbs, Bulgarians and Spaniards
Berlin/Brandenburg Metropolregion-BerlinBrandenburg.png 
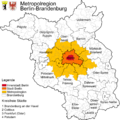
Berlin is the capital and largest city. It lies in the eastern part of the country, completely surrounded by the rather sparsely populated state of Brandenburg. Berlin is regarded as one of Europe's most open, vibrant and ever changing capitals. The city is arguably the most diverse city in Germany regarding culture and ethnicity. Regarded as an economically weak region of Germany for a long time, it is now transforming itself into the entrepreneurial center of Europe. Dubbed the "Silicon Allee" by insiders of the tech industry, Berlin is home to countless startup companies and one of Germany's densest knowledge hubs with 4 public universities and countless research centers.approx. 6 million Turks, Russians, Poles, Africans, Italians, Americans, Vietnamese, Serbs, Arabs, Bulgarians, Romanians, French and Spaniards
Munich Landkreise Bayern Metropolregion Munchen.svg The metropolitan area in and around Munich has one of Germany's highest standard of living. Housing some of the countries largest car and machine companies, it is known for its economic strength mixed with the uniqueness of Bavarian culture, taking up almost the entirety of southern Bavaria. It is the closest metropolitan area to the Alps.approx. 5.7 million Turks, Albanians, Croats, Italians, Poles, Greeks, Austrians, Romanians, Arabs, Africans and Serbs
Rhine-Main Metropolregion Frankfurt-Rhein-Main.svg Frankfurt is the financial and commercial center both for Germany and continental Europe. Almost all of Germany's big banks and the ECB have their HQ located inside the city of Frankfurt. Despite not having a population of over a million, it is Germany's only city with a large, visible cluster of skyscrapers. The city is one of Europe's biggest transit hubs with Europe's 6th busiest airport (Frankfurt airport), Germany's second busiest railway stations and one of the EU's most heavily used interchanges.approx. 5.5 million Turks, Poles, Italians, African, Croats, Romanians, Greeks, Serbs, Spaniards, Americans, Chinese, Arabs and Indians
Hamburg Metropolregion Hamburg 2017.png Hamburg is the country's second largest city and the biggest Hanseatic city in Europe. It is Europe's 3rd busiest container port with just under 9 million TEUs annually. The city is proud of its diverse nightlife and music scene centered in and around the famous St. Pauli district.approx. 5.3 million Turks, Albanians, Poles, African, Portuguese, Romanians, Russians, Italians and Spaniards
Stuttgart Metropolregion Stuttgart.png Stuttgart has a reputation for research, inventions and industry. The German headquarters of many international enterprises are in Stuttgart. This contrasts with the strong rural, down-to-earth attitude of the Stuttgarters throughout the classes. A popular slogan is "We are good at everything. Except speaking High (standard) German."approx. 5.2 million Turks, Albanians, Greeks, Dutch, Italians, Croats, Serbs, French, Chinese, Romanians, Americans and Spaniards.[ citation needed ]
Hannover–Braunschweig–Göttingen–Wolfsburg Metropolregionhabsgo.jpg The relatively urban south of Lower Saxony, located on route between the Ruhr area and Berlin, and the route form Hamburg to the south, has been important for logistics, industry, but also developed a strong standing in the service industries.approx. 3.7 million Turks, Kurds (especially around Celle), Serbs, Ukrainians, Greeks, Russians, Italians (especially in Wolfsburg) and Spanish (Especially in Hanover).[ citation needed ]
Bremen/Oldenburg Metropolregion Bremen-Oldenburg.png Located in the northwestern part of Germany, the main axis contains the cities of Bremen, Delmenhorst and Oldenburg, with the cities of Wilhelmshaven and Bremerhaven being the northern corners at the north sea. Major rural areas are covered in between these cities. There is a smooth transition to the Hamburg metropolitan area to the east.approx. 2.7 million Turks, Russians, Albanians, Serbs, Portuguese, Iranians, Dutch, Americans and Britons.[ citation needed ]
Central German Metropolitan Region Karte Leipzig in Deutschland.png The economic region stretches across three federal states. The major city is Leipzig in Saxony, other important cities are Halle/Saale, Gera and Jena. The region is known for its universities and research, for its trade fairs and conventions, as a central distribution hub (Leipzig-Halle-Airport), as center for chemical and industrial production, for the well preserved inner cities and the developed classical and alternative cultural scene. Leipzig is one of the fastest-growing cities in Germany, with a rising economy.approx. 2.4 mil Russians, Poles, Vietnamese, Italians, Romanians, Ukrainians, Chinese, Turks, Portuguese, people from Syria, from Kazakhstan and from Afghanistan. [85]

Immigration

The United Nations Population Fund lists Germany as host to the third-highest number of international migrants worldwide, behind the United States and Saudi Arabia. [79] The largest ethnic group of non-German origin are the Turkish. Since the 1960s, West and later reunified Germany has attracted immigrants primarily from Southern and Eastern Europe as well as Turkey, many of whom (or their children) have acquired German citizenship over time. While most of these immigrants initially arrived as guest workers, changes to guest worker legislation allowed many to stay and to build lives in Germany.

Germany had signed special visa agreements with several countries in times of severe labour shortages or when particular skills were deficient within the country. During the 1960s and 1970s, agreements were signed with the governments of Turkey, Yugoslavia, Italy and Spain to help Germany overcome its severe labour shortage.

As of 2012, after Germany fully legalized visa-free immigrants from the eastern states of the EU, the largest sources of net immigration to Germany were other European countries, most importantly Poland, Romania, Bulgaria, Hungary, Italy, Spain, and Greece; notably, in the case of Turkey, German Turks moving to Turkey slightly outnumbered new immigrants in 2012, [86] however, in recent years there are more Turkish immigrants in Germany than emigrants again, including illegal Turkish migrants.

In 2015, there was a large increase in asylum applications following the 2015 refugee crisis, mainly due to the violent conflicts in Syria, Iraq and Afghanistan: 476,649 asylum applications were counted that year. [87] This number went up to even 745,545 in 2016 and began to decline after it. [12]

In 2022, some 23.8 million people in Germany, or 28.7% of the population have migrant background. [88]

Following the 2022 Russian invasion of Ukraine, over 1.06 million refugees from Ukraine were recorded in Germany as of April 2023. [89]

Education

Cadets of the German Navy exercising in front of one of the gyms of Germany's naval officers school, the Marineschule Murwik MSM-sporthalle.jpg
Cadets of the German Navy exercising in front of one of the gyms of Germany's naval officers school, the Marineschule Mürwik

Responsibility for educational oversight in Germany lies primarily with the individual federated states. Since the 1960s, a reform movement has attempted to unify secondary education into a Gesamtschule (comprehensive school); several West German states later simplified their school systems to two or three tiers. A system of apprenticeship called Duale Ausbildung ("dual education") allows pupils in vocational training to learn in a company as well as in a state-run vocational school. [90]

Optional kindergarten education is provided for all children between three and six years old, after which school attendance is compulsory for at least nine years, depending on the state. Primary education usually lasts for four years and public schools are not stratified at this stage. [90] In contrast, secondary education includes three traditional types of schools focused on different levels of academic ability: the Gymnasium enrols the most academically promising children and prepares students for university studies; the Realschule for intermediate students lasts six years; the Hauptschule prepares pupils for vocational education. [91]

In addition Germany has a comprehensive school known as the Gesamtschule . While some German schools such as the Gymnasium and the Realschule have rather strict entrance requirements, the Gesamtschule does not have such requirements. They offer college preparatory classes for the students who are doing well, general education classes for average students, and remedial courses for those who aren't doing that well. In most cases students attending a Gesamtschule may graduate with the Hauptschulabschluss, the Realschulabschluss or the Abitur depending on how well they did in school. The percentage of students attending a Gesamtschule varies by Bundesland. In 2007 the State of Brandenburg more than 50% of all students attended a Gesamtschule, [92] while in the State of Bavaria less than 1% did.

The general entrance requirement for university is Abitur, a qualification normally based on continuous assessment during the last few years at school and final examinations; however there are a number of exceptions, and precise requirements vary, depending on the state, the university and the subject. Germany's universities are recognised internationally; in the Academic Ranking of World Universities (ARWU) for 2008, six of the top 100 universities in the world are in Germany, and 18 of the top 200. [93] Nearly all German universities are public institutions, tuition fees in the range of €500 were introduced in some states after 2006, but quickly abolished again until 2014.

Percentage of jobholders holding Hauptschulabschluss, Realschulabschluss or Abitur in Germany [94]

1970198219912000
Hauptschulabschluss 87,7%79,3%66,5%54,9%
Realschulabschluss 10,9%17,7%27%34,1%
Abitur 1,4%3%6,5%11%

Literacy

Over 99% of those of age 15 and above are estimated to be able to read and write. However, a growing number of inhabitants are functionally illiterate. The young are much more likely to be functionally illiterate than the old. According to a study done by the University of Bremen in cooperation with the "Bundesverband Alphabetisierung e.V.", 10% of youngsters living in Germany are functionally illiterate and one quarter are able to understand only basic level texts. [95] Illiteracy rates of youngsters vary by ethnic group and parents' socioeconomic class.

Health

The life expectancy in Germany is 81.1 years (78.7 years males, 83.6 years females, 2020 est.). [96] As of 2009, the principal cause of death was cardiovascular disease, at 42%, followed by malignant tumours, at 25%. [97] As of 2008, about 82,000 Germans had been infected with HIV/AIDS and 26,000 had died from the disease (cumulatively, since 1982). [98] According to a 2005 survey, 27% of German adults are smokers. [98] A 2009 study shows Germany is near the median in terms of overweight and obese people in Europe. [99]

Religion

2020 map of Christian denominations in the states of Germany
Roman Catholic majority
Christian majority, Catholic plurality
Christian majority, EKD plurality
Christians less than 50% of population, majority of Christians belong to EKD Konfessionen-in-Deutschland-2020.svg
2020 map of Christian denominations in the states of Germany
  Roman Catholic majority
  Christian majority, Catholic plurality
  Christian majority, EKD plurality
  Christians less than 50% of population, majority of Christians belong to EKD

The national constitutions of 1919 and 1949 guarantee freedom of faith and religion; earlier, these freedoms were mentioned only in state constitutions. The modern constitution of 1949 also states that no one may be discriminated against due to their faith or religious opinions. A state church does not exist in Germany (see Freedom of religion in Germany). [100]

According to a 1990s poll by Der Spiegel, 45% of Germans believe in God, and a quarter in Jesus Christ. [101] According to the Eurobarometer Poll 2010, 44% of German citizens responded that "they believe there is a God", 25% responded that "they believe there is some sort of spirit or life force" and 27% responded that "they don't believe there is any sort of spirit, God or life force". 4% gave no response. [102]

Christianity is the largest religion in Germany, comprising an estimated 53.9% of the country's population. [103] [104]

Smaller religious groups (less than 1%) include Judaism, Buddhism and Hinduism. [105] [103]

The two largest churches, the Roman Catholic Church and the Protestant Church in Germany (EKD), have lost significant number of adherents. In 2020 the Catholic Church accounted for 26.7% [103] [104] [106] and the Evangelical Church for 24.3% [103] [104] [107] of the population. Orthodox Church has 1.9% and other Christian churches and groups summed up to 1.1% of the population. [103] [105] Since the reunification of Germany, the number of non-religious people has grown and an estimated 40.7% of the country's population are not affiliated with any church or religion. [103] [104] [105]

The other religions make up to less than 1% of the population. [105] Buddhism has around 200,000 adherents (0.2%), Judaism has around 200,000 adherents (0.2%), Hinduism 90,000 (0.1%), Sikhism 75,000 (0.1%) and Yazidis religion (45,000–60,000). [108] All other religious communities in Germany have fewer than 50,000 (<0.1%) adherents.

Religion in Germany (2020) [103] [104]
No Religion
40.7%
Roman Catholicism
26.7%
Protestant Church
24.3%
Islam
3.5%
Orthodox Church
1.9%
Other Christians
1.1%
Other Religions
0.9%

Protestantism is concentrated in the north and east and Roman Catholicism is concentrated in the south and west. According to the last nationwide census, Protestantism is more widespread among the population with German citizenship; there are slightly more Catholics total because of the Catholic immigrant population (including such groups as Poles and Italians). [109] The former Pope, Benedict XVI, was born in Bavaria. Non-religious people, including atheists and agnostics are especially numerous in the former East Germany and major metropolitan areas. [110]

Of the roughly 4 million Muslims, most are Sunnis and Alevites from Turkey, but there are a small number of Shi'ites and other denominations. [111] [112] 1.9% of the country's overall population declare themselves Orthodox Christians, [103] with Serbs, Greeks, Romanians, Ukrainians and Russians being the most numerous. [113] Germany has Europe's third-largest Jewish population (after France and the United Kingdom). [114] In 2004, twice as many Jews from former Soviet republics settled in Germany as in Israel, bringing the total Jewish population to more than 200,000, compared to 30,000 prior to German reunification. Large cities with significant Jewish populations include Berlin, Frankfurt and Munich. [115] Around 250,000 active Buddhists live in Germany; 50% of them are Asian immigrants. [116]

2011 Census

Religion (2011 German Census)

  Catholic Church (30.8%)
  EKD (30.3%)
  Other, atheist or unspecified [117] (38.9%)

Census results were as follows:

  • Roman Catholic Church: 24,740,380 or 30.8% of the German population;
  • Protestant Church: 24,328,100 or 30.3% of the German population;
  • Other, atheist or not specified (including Protestants outside EKD): 31,151,210 or 38.9% of the German population. [109]

Languages

German is the only official and most widely spoken language. Standard German is understood throughout the country.

In 2021, the Federal Statistical Office of Germany included a new question regarding the language spoken at home in the micro-census, a large sample survey that yearly covers approximately 1% of the German population living in private households, and the results were as follows: [118]

Languages spoken at home, 2023 micro census
LanguageAbsolute numberPercentage
Total population83,875,000100.00
Only German64,632,00077.05
Mostly German3,669,0004.37
Mostly another language15,574,00018.56
Of which Albanian 597,0000.71
Arabic 1,462,0001.74
Bosnian 256,0000.29
Bulgarian 232,0000.27
Chinese 166,0000.2
Danish 20,0000.02
English 1,010,0001.2
French 192,0000.23
Greek 301,0000.36
Hindi 80,0000.09
Italian 496,0000.60
Croatian 536,0000.64
Kurdish 574,0000.68
Macedonian 102,0000.12
Dutch 102,0000.12
Pashto 48,0000.05
Persian 448,0000.53
Polish 1,024,0001.22
Portuguese 166,0000.20
Romanian 762,0000.91
Russian 1,895,0002.26
Serbian 294,0000.35
Spanish 336,0000.40
Turkish 2,128,0002.53
Hungarian 217,0000.26
Urdu 97,0000.11
Ukrainian 604,0000.72
Vietnamese 160,0000.19
Another European

language

259,0000.30
Another African language281,0000.33
Another Asian language464,0000.55
Another language350,0000.41

Minority languages

Bilingual German-Sorbian city limit signs Rozant - znacki.jpg
Bilingual German-Sorbian city limit signs

Danish, Low German, Low Rhenish, the Sorbian languages (Lower Sorbian and Upper Sorbian), and the two Frisian languages, Saterfrisian and North Frisian, are officially recognized and protected as minority languages by the European Charter for Regional or Minority Languages in their respective regions. With speakers of Romany living in all parts of Germany, the federal government has promised to take action to protect the language. Until now, only Hesse has followed Berlin's announcement, and agreed on implementing concrete measures to support Romany speakers.

Germany is a strong supporter of the Charter, as evidenced by things like the 2022 report from the Secretary General of the Council of Europe specifically naming Germany as an example of how to incorporate minority languages in State media. [119] [120] Still, Germany—like many other signatories of the Charter—has room for improvement in its implementation of the Charter. [121]

Protected Minority Languages in Germany
LanguageStates
Danish Schleswig-Holstein
North Frisian Schleswig-Holstein
Saterland Frisian Lower Saxony
Low German Brandenburg, Bremen, Hamburg, Mecklenburg-Vorpommern, Lower Saxony, Saxony-Anhalt, Schleswig-Holstein, North Rhine-Westphalia
Low Rhenish North Rhine-Westphalia
Upper Sorbian Saxony
Lower Sorbian Brandenburg
Romany Hesse de facto, de jure in all states (see text)

High German dialects

City limits sign; this city is called Emlichheim in High German and Emmelkamp in Low German. Ortsschild Emlichheim - Emmelkamp.jpg
City limits sign; this city is called Emlichheim in High German and Emmelkamp in Low German.

German dialects some quite distinct from the standard language are used in everyday speech, especially in rural regions. Many dialects, for example the Upper German varieties, are to some degree cultivated as symbols of regional identity and have their own literature, theaters and some TV programming. While speaking a dialect outside its native region might be frowned upon, in their native regions some dialects can be spoken by all social classes.[ citation needed ] Nevertheless, partly due to the prevalence of Standard German in media, the use of dialects has declined over the past century, especially in the younger population.

The social status of different German dialects can vary greatly. The Alemannic and Bavarian dialects of the south are positively valued by their speakers and can be used in almost all social circumstances. The Saxonian and Thuringian dialects have less prestige and are subject to derision. While Bavarian and Alemannic have kept much of their distinctiveness, the Middle German dialects, which are closer to Standard German, have lost some of their distinctive lexical and grammatical features and tend to be only pronunciation variants of Standard German.

Low Saxon dialects

Low Saxon is officially recognized as a language on its own, but despite this fact, there's little official action taken on fostering the language. Historically one third of Germany's territory and population was Low Saxon speaking. No data was ever collected on the actual number of speakers, but today the number of speakers ranges around 5 million persons. Despite this relatively high number of speakers there is very little coverage in the media (mostly on NDR TV, no regular programming) and very little education in or on the language. The language is not fixed as part of the school curriculum and Low Saxon is used as a medium of instruction in one school only in the whole Germany (as a "model project" in primary school sided by education in Standard German). As a consequence the younger generation refused to adopt the native language of their parents. Language prevalence dropped from more than 90% (depending on the exact region) in the 1930s to less than 5% today. This accounts for a massive intergenerational gap in language use. Older people regularly use the language and take private initiative to maintain the language, but the lack of innovative potential of the younger generation hinders language maintenance. The language too has an own literature (around 150 published books every year) and there are many theatres (mostly lay stages, but some professional ones, like for example Ohnsorg-Theater).

Use of Low Saxon is mainly restricted to use among acquaintances, like family members, neighbours and friends. A meeting of a village council can be held almost completely in Low Saxon if all participants know each other (as long as written protocols are written in Standard German), but a single foreigner can make the whole switching to Standard German.

The Low Saxon dialects are different in their status too. There's a north–south gradient in language maintenance. The Southern dialects of Westfalian, Eastfalian and Brandenburgish have had much stronger speaker losses, than the northern coastal dialects of Northern Low Saxon. While Eastfalian has lost speakers to Standard German, Westfalian has lost speakers to Standard German and Standard German based regiolect of the Rhine-Ruhr area. Brandenburgish speakers mostly switched to the Standard German-based regiolect of Berlin. Brandenburgish is almost completely replaced by the Berlin regiolect. Northern Low Saxon speakers switched mostly to pure Standard German.

Foreign languages

English is the most common foreign language and almost universally taught by the secondary level; it is also taught at elementary level in some states. Other commonly-taught languages are French, Italian, Spanish and Russian. Dutch is taught in states bordering the Netherlands, and Polish in the eastern states bordering Poland. [122] Latin and Ancient Greek are part of the classical education syllabus offered in many secondary schools.

According to a 2004 survey, two-thirds of Germany's citizens have at least basic knowledge of English.[ citation needed ] About 20% consider themselves to be competent speakers of French, followed by speakers of Russian (7%), Italian (6.1%), and Spanish (5.6%). The relatively high number of Russian speakers is a result of immigration from the former Soviet Union to Germany for almost 10 consecutive years, plus its having been learned in school by many older former East Germans as compulsory first foreign language.[ citation needed ]

See also

Notes

  1. In fertility rates, 2.1 and above is a stable population and have been marked blue, 2 and below leads to an aging population and a reducing population.

Related Research Articles

<span class="mw-page-title-main">Demographics of Austria</span> National demographics

Demographic features of the population of Austria include population density, ethnicity, education level, health of the populace, economic status, religious affiliations and other aspects of the population.

This article details the geographical distribution of speakers of the German language, regardless of the legislative status within the countries where it is spoken. In addition to the Germanosphere in Europe, German-speaking minorities are present in many other countries and on all six inhabited continents.

<span class="mw-page-title-main">Immigration to Germany</span>

Immigration to Germany, both in the country's modern borders and the many political entities that preceded it, has occurred throughout the country's history. Today, Germany is one of the most popular destinations for immigrants in the world, with well over 1 million people moving there each year since 2013. As of 2019, around 13.7 million people living in Germany, or about 17% of the population, are first-generation immigrants.

<span class="mw-page-title-main">Languages of Germany</span> Linguistics of Germany

The official language of Germany is German, with over 95 percent of the country speaking Standard German or a dialect of German as their first language. This figure includes speakers of Northern Low Saxon, a recognized minority or regional language that is not considered separately from Standard German in statistics. Recognized minority languages have official status as well, usually in their respective regions.

<span class="mw-page-title-main">New states of Germany</span> Five re-established states of former East Germany

The new states of Germany are the five re-established states of the former German Democratic Republic (GDR) that unified with the Federal Republic of Germany (FRG) with its 10 "old states" upon German reunification on 3 October 1990.

<span class="mw-page-title-main">Pakistanis in Germany</span> Ethnic group in Germany

Pakistani-Germans refers to the community in Germany of Pakistani heritage or citizenship.

<span class="mw-page-title-main">Chinese people in Germany</span>

Chinese people in Germany form one of the smaller groups of overseas Chinese in Europe, consisting mainly of Chinese expatriates living in Germany and German citizens of Chinese descent. The German Chinese community is growing rapidly and, as of 2016, was estimated to be around 212,000 by the Federal Institute for Population Research. In comparison to that, the Taiwanese OCAC had estimated there were 110,000 people of Chinese descent living in Germany in 2008.

<span class="mw-page-title-main">Vietnamese people in Germany</span>

Vietnamese people in Germany(Vietnamese: Việt kiều Đức / Người Việt tại Đức; German: Vietnamesen in Deutschland) form one of the country's largest groups of resident foreigners from Asia. Federal Statistical Office figures show 103,260 Vietnamese nationals residing in Germany at the end of 2020, which is the fourth largest community from Asia excluding transcontinental, Caucusus and Middle Eastern states. Not included in those figures are individuals of Vietnamese origin or descent who have been naturalised as German citizens. Other data from 2020 shows 183,000 people of Vietnamese descent, of which 117,000 have a migration background.

<span class="mw-page-title-main">Russians in Germany</span> Ethnic group

There is a significant Russian population in Germany. The collapse of the Soviet Union in 1991 triggered mass immigration to the West, with Germany being the top destination, mostly for economic and ethnic reasons. Russians are the 3rd largest migrant group in Germany.

<span class="mw-page-title-main">Serbs in Germany</span> Ethnic group in Germany

Serbs in Germany refers to persons living in Germany who have total or partial Serbian ancestry. They form the seventh largest group of foreigners in Germany.

<span class="mw-page-title-main">Census in Germany</span> Census

A national census in Germany was held every five years from 1875 to 1910. After the World Wars, only a few full population censuses have been held, the last in 1987. The most recent census, though not a national census, was the 2011 European Union census.

The Albanians in Germany refers to the Albanian migrants in Germany and their descendants. They mostly trace their origins to Albania, Kosovo and to a lesser extent to North Macedonia and other Albanian-speaking territories in the Balkan Peninsula. Their exact number is difficult to determine as some ethnic Albanians hold German, Macedonian, Serbian or another Former Yugoslavian citizenship.

<span class="mw-page-title-main">Demographics of the European Union</span>

The demographics of the European Union show a highly populated, culturally diverse union of 27 member states. As of 1 January 2023, the population of the EU is around 448 million people.

<span class="mw-page-title-main">Demographics of Berlin</span>

In December 2019, the city-state of Berlin had a population of 3,769,495 registered inhabitants in an area of 891.82 square kilometers (344.33 sq mi). The city's population density was 4,227 inhabitants per km2. Berlin is Germany's largest city and the most populous city proper in the European Union.

<span class="mw-page-title-main">Old states of Germany</span> Ten states of Germany, previously states in former West Germany

The old states of Germany is a jargon referring to the ten of the sixteen states of the Federal Republic of Germany (FRG) that were part of West Germany and that unified with the eastern German Democratic Republic's 5 states, which are given the contrasting term new states of Germany. Usage of this terminology usually excludes one other state, Berlin, conterminous with the capital city of the reunified nation which used to be divided, with its western part linked with West Germany.

<span class="mw-page-title-main">Smoking in Germany</span> Overview of smoking in Germany

In Germany, smoking is widespread and is subject to very few and lax regulations compared to other countries in Europe. Tobacco taxes in Germany are among the lowest in Europe. Germany ranks last on the Tobacco Control Scale and has sometimes been referred to as the "smoker's paradise" of Europe. According to German addiction researcher Heino Stöver, Germany has "[...] more cigarette vending machines than any other country in the world."

Jugendamt is a German and Austrian local agency set up to promote the welfare of children. Each district or district-free city has its own Jugendamt. Its structure is flat, with no centralised coordinating office. In Germany the youth offices were created during Weimar Republic by the Reich Youth Welfare Act of 1922, in force since 1924. Since the local organizations function independently there is no federal administrative supervision.

Asians in Germany or German Asians are German citizens of full or partial Asian descent. The term Asian German is also applied to foreign residents of Asian origin living in the Federal Republic of Germany. German Asians have been present in Germany in small numbers since the 19th century and originate primarily from countries like Vietnam, China, Thailand, India, Afghanistan, Kazakhstan, Sri Lanka, South Korea, Japan or the Philippines. Although Germany's official census data does not collect specific data on ethnicity or race, but rather nationality, the number of people with an Asian "migrant background" is listed in statistical reports.

<span class="mw-page-title-main">Lebanese people in Germany</span> Ethnic group in Germany

In the narrow sense, Lebanese people in Germany include migrants from Lebanon living in Germany and their descendants, excluding Palestinians.

<span class="mw-page-title-main">Syrians in Germany</span> Residents of Germany of Syrian descent

Syrians in Germany refers to Syrian immigrants in Germany, or Germans with Syrian ancestry. The number of people with an immigration background from Syria, including those with German citizenship, was estimated at around 1,225,000 in 2022. Additionally, the population with Syrian citizenship residing in Germany is 923,000 in 2022, making it the second-largest group of foreign nationals living in the country. Notably, Germany boasts by far the largest Syrian diaspora outside of the Middle East.

References

  1. 1 2 "Bevölkerungsstand". Archived from the original on 23 August 2019. Retrieved 4 January 2022.
  2. 1 2 "Lebendgeborene und Gestorbene" . Retrieved 13 September 2019.
  3. "Lebenserwartung in Deutschland nahezu unverändert" . Retrieved 9 July 2021.
  4. "Histat:Population statistics" . Retrieved 31 August 2021.[ permanent dead link ]
  5. "The Population History of Germany: Research Strategy and Preliminary Results" (PDF). Archived (PDF) from the original on 23 December 2010.
  6. "Zusammengefasste Geburtenziffer nach Kalenderjahren" . Retrieved 13 September 2019.
  7. "Die Datenbank des Statistischen Bundesamtes" . Retrieved 1 July 2021.
  8. "Births and Deaths" . Retrieved 1 July 2021.
  9. "Migrant background" . Retrieved 1 July 2021.
  10. "Bund der Vertriebenen: Aktuelle Aussiedlerstatistik". www.bund-der-vertriebenen.de. Retrieved 26 May 2022.
  11. "Russia Hopes to Lure Back Ethnic Germans". DW.
  12. 1 2 "Asylum statistics". Archived from the original on 9 July 2021. Retrieved 2 July 2021.
  13. "Important Economic Indicators". 15 January 2019.
  14. "Sozialhilfe: Kinderarmut nimmt zu". Focus. 15 November 2007
  15. Holger Wunderlich. Springer VS. Familienpolitik vor Ort – Strukturen, Akteure und Interaktionen auf kommunaler Ebene. p. 52
  16. 1 2 "Berlin-Institut für Bevölkerung und Entwicklung: Ostdeutschland". Berlin-institut.org. Archived from the original on 13 August 2017. Retrieved 24 August 2017.
  17. Michaela Kreyenfeld; Kryštof Zeman; Marion Burkimsher; Ina Jaschinski, "Fertility data for German-speaking countries What is the potential? Where are the pitfalls?" (PDF), Max Planck Institute for Demographic Research, archived (PDF) from the original on 2 February 2011
  18. 1 2 3 Kulish, Nicholas (19 June 2009). "In East Germany, a Decline as Stark as a Wall". The New York Times . Retrieved 11 October 2009.
  19. "Lack of Women in Eastern Germany Feeds Neo-Nazis". Spiegel Online. Spiegel International. 31 May 2007. Retrieved 11 October 2009.
  20. "Zusammengefasste Geburtenziffer nach Kalenderjahren". Destatis.de. Retrieved 13 April 2018.
  21. "East Germany overtakes West Germany: recent trends in order-specific fertility dynamics". Demogr.mpg.de. Archived from the original on 23 September 2015. Retrieved 24 August 2017.
  22. "State & society – Births – Average number of children per woman – Federal Statistical Office (Destatis)". Destatis.de. Retrieved 13 April 2018.
  23. Christoph Butterwegge, Michael Klundt, Matthias Zeng: Kinderarmut in Ost- und Westdeutschland. 2., erweiterte und aktualisierte Auflage. VS Verlag für Sozialwissenschaften, 2008, ISBN   978-3-531-15915-7, p. 99–100
  24. § 10 Abs. 5 BEEG, BGBl. I, S. 1885, 1896
  25. Bujard, Martin (Hrsg.) (2013): Elterngeld und Elternzeit in Deutschland: Ziele, Diskurse und Wirkungen. Schwerpunktheft der Zeitschrift für Familienforschung, 25. Jg., Band 2, Leverkusen: Verlag Barbara Budrich
  26. Bundesintitut für Bevölkerungsforschung 2012. Talsohle bei Akademikerinnen durchschritten? Kinderzahl und Kinderlosigkeit in Deutschland nach Bildungs- und Berufsgruppen. Expertise für das Bundesministerium für Familie, Senioren, Frauen und Jugend. p. 15
  27. "Prognose: Wohlstand in Deutschland wird sinken". Handelsblatt (in German). 12 December 2019. Retrieved 31 January 2020.[ permanent dead link ]
  28. "Germany Population 2018", World Population Review
  29. Fuhrmans, Vanessa (29 July 2011). "Germans Tally Their Concerns Over Census". The Wall Street Journal.
  30. Note: Crude migration change (per 1000) is a trend analysis, an extrapolation based average population change (current year minus previous) minus natural change of the current year (see table statistics). As average population is an estimate of the population in the middle of the year and not end of the year.
  31. 1 2 3 Max Roser (2014), "Total Fertility Rate around the world over the last centuries", Our World In Data, Gapminder Foundation , archived from the original on 7 August 2018, retrieved 7 August 2018
  32. "Life expectancy". Our World in Data. Retrieved 28 August 2018.
  33. "World Population Prospects – Population Division – United Nations". Archived from the original on 19 September 2016. Retrieved 15 July 2017.
  34. "Startseite – Statistisches Bundesamt (Destatis)". destatis.de. Retrieved 23 October 2015.
  35. "Population Statistics – Histat" . Retrieved 31 August 2021.[ permanent dead link ]
  36. "Zusammengefasste Geburtenziffer in Deutschland (1871-2021)". Bundesinstitut für Bevölkerungsforschung.
  37. "Development of births". Federal Statistical Office of Germany.
  38. "Germany". World Bank.
  39. "World Factbook Europe: Germany", The World Factbook , 12 July 2018
  40. https://www-genesis.destatis.de/genesis/online?operation=abruftabelleBearbeiten&levelindex=2&levelid=1692088815921&auswahloperation=abruftabelleAuspraegungAuswaehlen&auswahlverzeichnis=ordnungsstruktur&auswahlziel=werteabruf&code=12411-0001&auswahltext=&werteabruf=Value+retrieval#abreadcrumb Deutsches Statistisches Bundesambt Genesis online, visited on August 15, 2023[p
  41. https://www.destatis.de/EN/Themes/Society-Environment/Population/Current-Population/Tables/liste-current-population.html# Deutsche Statisisches Bundesambt, Current Population, visited August 15, 2023
  42. "Live births: Germany, months, sex". 23 September 2021.
  43. "Deaths: Germany, months, sex". 23 September 2021.
  44. "Lebendgeborene nach Monaten - vorläufige Ergebnisse". Statistisches Bundesamt.
  45. 1 2 "UNSD — Demographic and Social Statistics". unstats.un.org. Retrieved 10 May 2023.
  46. "Unmarried births" . Retrieved 1 July 2021.
  47. Handelsblatt (12 August 2011): "Familienplanung: Uneheliche Babys im Vormarsch"
  48. "Children born outside of marriage Germany 1950-2021". Statista. Retrieved 26 June 2023.
  49. Statistisches Bundesamt. Mikrozensus 2008. Neue Daten zur Kinderlosigkeit in Deutschland. p. 27ff
  50. 1 2 Statistisches Bundesamt. Mikrozensus 2008. Neue Daten zur Kinderlosigkeit in Deutschland. p.29
  51. Bundesintitut für Bevölkerungsforschung 2012. Talsohle bei Akademikerinnen durchschritten? Kinderzahl und Kinderlosigkeit in Deutschland nach Bildungs- und Berufsgruppen. Expertise für das Bundesministerium für Familie, Senioren, Frauen und Jugend. p. 14
  52. Michael Blume; Carsten Ramsel; Sven Graupner (June 2006). "Religiosität als demografischer Faktor – Ein unterschätzter Zusammenhang?" (PDF). Marburg Journal of Religion. 11. Archived (PDF) from the original on 25 April 2012.
  53. Michael Blume (2008) Homo religiosus, Gehirn und Geist 04/2009. S. 32–41.
  54. Nicole Auferkorte-Michaelis, Sigrid Metz-Göckel, Jutta Wergen, Annette Klein. 2005: "Junge Elternschaft und Wissenschaftskarriere - Wie kinderfreundlich sind Deutschlands Universitäten". Hochschuldidaktisches Zentrum HDZ
  55. 1 2 "Homelessness in Germany on the rise". DW.COM. 11 November 2019. Retrieved 31 January 2020.
  56. "Statistics of homeless people accommodated". Statistisches Bundesamt. Retrieved 10 January 2024.
  57. "Germany: 150 percent rise in number of homeless since 2014". DW.COM. 14 November 2017. Retrieved 17 February 2020.
  58. "OHCHR | Home". ohchr.org. Retrieved 31 January 2020.
  59. Shendruk, Amanda (8 July 2021). "Are you even trying to stop racism if you don't collect data on race?". Quartz. Retrieved 4 July 2022.
  60. 1 2 "Publikation – STATmagazin – Population – Families with a migrant background: traditional values count – Federal Statistical Office (Destatis)". destatis.de. 27 August 2012. Retrieved 23 October 2015.
  61. 1 2 3 4 5 6 7 "Bevölkerung mit Migrationshintergrund – Ergebnisse des Mikrozensus 2019 –" (PDF). destatis.de (in German). 28 July 2020. p. 68.
  62. Statistisches Bundesamt Deutschland: "Leichter Anstieg der Bevölkerung mit Migrationshintergrund". Pressemitteilung Nr.105 vom 11 March 2008
  63. "Statistischer Bericht – Mikrozensus – Bevölkerung nach Migrationshintergrund – Erstergebnisse 2022 (The statements are based on statistics listed in excel-Table 12211-03.)". Destatis. Statistisches Bundesamt. 20 April 2023. Retrieved 6 November 2023.
  64. This number represents the number of people without "immigrant background", meaning people with two parents of mostly or full German ancestry. It does not represent the number of people who view themselves as German. This number does not include people with a German forebear, who came to modern Germany after 1955 (including Aussiedler and Spätaussiedler) and descendants of that person.
  65. "2005". Fachserie / 1 / 2 / 2: Ergebnisse des Mikrozensus (in German). 23 August 2017.
  66. 1 2 3 4 5 "Bevölkerung und Erwerbstätigkeit; Bevölkerung mit Migrationshintergrund – Ergebnisse des Mikrozensus 2022 –". destatis.de (in German).
  67. "2011". Fachserie / 1 / 2 / 2: Ergebnisse des Mikrozensus (in German). 13 March 2017.
  68. "2016". Fachserie / 1 / 2 / 2: Ergebnisse des Mikrozensus (in German). 31 August 2017.
  69. "World War I: Restoring Poland | Library of Congress Blog". 25 January 2017.
  70. Lilo Locher (22 February 2002). "Determining the shape of a migration wave" (PDF). Archived from the original (PDF) on 21 March 2004.
  71. J. Otto Pohl. "The Deportation and Destruction of the German Minority in the USSR" (PDF). Odessa3.org. Archived (PDF) from the original on 24 September 2015. Retrieved 24 August 2017.
  72. "Jewish Population of the World - Jewish Virtual Library". jewishvirtuallibrary.org. Retrieved 23 October 2015.
  73. "Citizenship groups" . Retrieved 1 July 2021.
  74. 1 2 "All foreign citizenships" . Retrieved 2 July 2021.
  75. "Germany: Immigration in Transition". migrationpolicy.org. July 2004. Retrieved 23 October 2015.
  76. Stephan Lanz: "Berlin aufgemischt — abendländisch — multikulturell — kosmopolitisch? Die politische Konstruktion einer Einwanderungsstadt". 2007. Bielefeld: transcript Verlag; p. 113
  77. Karin Weiss: "Die Einbindung ehemaliger vietnamesischer Vertragsarbeiterinnen und Vertragsarbeiter in Strukturen der Selbstorganisation", In: Almut Zwengel: "Die "Gastarbeiter der DDR — politischer Kontext und Lebenswelt". Studien zur DDR Gesellschaft; p. 264
  78. "Immigration by Country 2024".
  79. 1 2 "International Migration Report 2017 - Highlights" (PDF). UN Department of Economic and Social Affairs. Archived (PDF) from the original on 23 December 2017. Retrieved 9 June 2016.
  80. "Pressemitteilungen - Bevölkerung mit Migrationshintergrund um 8,5 % gestiegen - Statistisches Bundesamt (Destatis)". Destatis.de. Retrieved 24 August 2017.
  81. "Federal Statistical Office Germany - GENESIS-Online". 26 December 2021.
  82. "Bevölkerungsstand". Archived from the original on 23 August 2019. Retrieved 8 November 2020.
  83. The individual denomination is either Land [state], Freistaat [free state] or Freie (und) Hansestadt [free (and) Hanseatic city].
    "The Federal States". Bundesrat.de. Bundesrat of Germany . Retrieved 17 July 2011.
    "Amtliche Bezeichnung der Bundesländer" [Official denomination of federated states]. Auswaertiges-amt.de (in German). Federal Foreign Office. Archived from the original (PDF) on 21 October 2011. Retrieved 22 October 2011.
  84. "Bevölkerungsstand Länder" . Retrieved 12 August 2022.
  85. Website of the City of Leipzig: https://www.leipzig.de/fileadmin/mediendatenbank/leipzig-de/Stadt/02.1_Dez1_Allgemeine_Verwaltung/12_Statistik_und_Wahlen/Statistik/Leipzig_fb_Migranten.pdf
  86. "See page 21 of this report" (PDF). Bamf.de. Archived from the original (PDF) on 25 October 2017. Retrieved 24 August 2017.
  87. "2015: Mehr Asylanträge in Deutschland als jemals zuvor". Bundesministerium des Innern. Archived from the original on 24 August 2017. Retrieved 24 August 2017.
  88. "Germany: Immigrants made up over 18% of 2022 population". Deutsche Welle .
  89. "Ukrainian refugees by country 2023". Statista.
  90. 1 2 "Country profile: Germany" (PDF). Library of Congress. April 2008. Retrieved 28 March 2011.
  91. "The Educational System in Germany". Cuesta College. 31 August 2002. Archived from the original on 13 May 2011. Retrieved 16 May 2011.
  92. Prof Dr. Valentin Merkelbach. "Gesamtschulen und Grundschulen sind das Beste in unserem Schulsystem". Bildungsklick.de. Retrieved 24 August 2017.
  93. "Top 100 World Universities". Academic Ranking of World Universities. Archived from the original on 22 August 2008. Retrieved 28 March 2011.
  94. Frietsch, Rainer (November 2003). ""Intensivierung" von Bildungsabschlüssen zwischen 1970–2000" (PDF). Studien zum Deutschen Innovationssystem (5–2004). ISSN   1613-4338. Archived from the original (PDF) on 7 October 2007. Retrieved 21 November 2009.
  95. Teachers News: "Funktionaler Analphabetismus"
  96. "The World Factbook". 30 May 2023.
  97. "Statistisches Bundesamt Deutschland – Herz-/Kreislauferkrankungen nach wie vor häufigste Todesursache" (in German). Destatis.de. Archived from the original on 6 June 2011. Retrieved 7 June 2011.
  98. 1 2 "Country Profile Germany" (PDF). Library of Congress Federal Research Division. April 2008. Retrieved 7 May 2011.
    This article may incorporate text from this source, which is in the public domain.
  99. "Statistics Explained". europa.eu. Retrieved 23 October 2015.
  100. Basic Law Art. 140
  101. "By Location". Adherents.com. Archived from the original on 18 August 2000. Retrieved 23 January 2016.{{cite web}}: CS1 maint: unfit URL (link)
  102. "Special Eurobarometer, biotechnology, page 204" (PDF). Fieldwork: Jan-Feb 2010. Archived (PDF) from the original on 15 December 2010. Retrieved 10 September 2017.
  103. 1 2 3 4 5 6 7 8 "Religionszugehörigkeiten in Deutschland 2020" (in German). Forschungruppe Weltanschauungen in Deutschland. 23 September 2021. Retrieved 3 January 2022.
  104. 1 2 3 4 5 "Zahlen und Fakten zum kirchlichen Leben" (PDF) (in German). Evangelische Kirche in Deutschland. Archived (PDF) from the original on 14 July 2021. Retrieved 3 January 2022.
  105. 1 2 3 4 REMID Data of "Religionswissenschaftlicher Medien- und Informationsdienst" Archived 28 May 2014 at the Wayback Machine retrieved 16 January 2015
  106. Official church statistics of the Roman Catholic Church in Germany 2015, Dbk.de, retrieved 25 January 2016
  107. Official press release of the Protestant Church in Germany on 2014 membership data, Ekd.de, retrieved 25. January 2016
  108. "Die Yeziden in Deutschland – Religion und Leben". 23 February 2014. Archived from the original on 23 February 2014. Retrieved 24 August 2017.
  109. 1 2 "Zensus 2011 : Bevölkerung und Haushalte Bundesrepublik Deutschland". Ergebnisse.zensus2011.de. 9 May 2011. Archived from the original on 25 May 2017. Retrieved 24 August 2017.
  110. (in German) Religionen in Deutschland: Mitgliederzahlen Archived 28 May 2014 at the Wayback Machine Religionswissenschaftlicher Medien- und Informationsdienst; 31 October 2009. Retrieved 19 November 2009.
  111. "Chapter 2: Wie viele Muslime leben in Deutschland?" [How many Muslims live in Germany?]. Muslimisches Leben in Deutschland[Muslim Life in Germany] (in German). Nuremberg: Federal Office for Migration and Refugees (German: Bundesamt für Migration und Flüchtlinge), an agency of the Federal Ministry of the Interior (Germany). June 2009. p. 80. ISBN   978-3-9812115-1-1. Archived from the original (PDF) on 30 April 2011. Retrieved 9 September 2010. Demnach leben in Deutschland zwischen 3,8 und4,3 Millionen Muslime [. . .] beträgt der Anteil der Muslime an der Gesamtbevölkerungzwischen 4,6 und 5,2 Prozent. Rund 45 Prozent der in Deutschland lebenden Muslime sind deutsche Staatsangehörige, rund 55 Prozent haben eine ausländische Staatsangehörigkeit.
  112. "Chapter 2: Wie viele Muslime leben in Deutschland?" [How many Muslims live in Germany?]. Muslimisches Leben in Deutschland[Muslim Life in Germany] (in German). Nuremberg: Federal Office for Migration and Refugees (German: Bundesamt für Migration und Flüchtlinge), an agency of the Federal Ministry of the Interior (Germany). June 2009. p. 97. ISBN   978-3-9812115-1-1. Archived from the original (PDF) on 30 April 2011. Retrieved 9 September 2010. Der Anteil der Sunniten unter den in den Haushalten lebenden Muslimen beträgt 74 Prozent
  113. "EKD-Statistik: Christen in Deutschland 2007" (in German). Evangelische Kirche in Deutschland. Archived from the original on 30 April 2011. Retrieved 13 February 2010.
  114. Blake, Mariah. In Nazi cradle, Germany marks Jewish renaissance The Christian Science Monitor . 10 November 2006. Retrieved 30 November 2006.
  115. The Jewish Community of Germany European Jewish Congress. Retrieved 30 November 2006.
  116. (in German) Die Zeit 12/07, page 13
  117. Including Protestants outside EKD.
  118. "Bevölkerung und Erwerbstätigkeit – Bevölkerung mit Migrationshintergrund – Ergebnisse des Mikrozensus 2023 –". Statistisches Bundesamt: 503. 2021.
  119. "Application of the European Charter for Regional or Minority Languages (2021-2022): Report by the Secretary General of the Council of Europe to the Parliamentary Assembly". Parliamentary Assembly. 3.2.20. 2022. Retrieved 14 November 2023.{{cite web}}: CS1 maint: location (link)
  120. "German Bundestag celebrates 25 years of the European Charter for Regional or Minority Languages". Fuen.org/. Retrieved 15 November 2023.
  121. "Recommendation CM/RecChL(2022)5 of the Committee of Ministers to member States on the application of the European Charter for Regional or Minority Languages by Germany". search.coe.int. 2022. Retrieved 15 November 2023.
  122. "Most European students learn English in school".