Demographic features of the population of Hungary include population density, ethnicity, education level, health of the populace, economic status, religious affiliations and other aspects.
Hungary's population has been slowly declining since 1980. The population composition at the foundation of Hungary (895) depends on the size of the arriving Hungarian population and the size of the Slavic (and remains of Avar-Slavic) population at the time. One source mentions 200,000 Slavs and 400,000 Hungarians,[4] while other sources often don't give estimates for both, making comparison more difficult. The size of the Hungarian population around 895 is often estimated between 120,000 and 600,000,[5] with a number of estimates in the 400-600,000 range.[4][6][7] Other sources only mention a fighting force of 25,000 Magyar warriors used in the attack,[8][9] while declining to estimate the total population including women and children and warriors not participating in the invasion. In the historical demographics the largest earlier shock was the Mongol Invasion of Hungary, several plagues also took a toll on the country's population.
According to demographers, about 80 percent of the population was made up of Hungarians before the Battle of Mohács. However, the Hungarian ethnic group became a minority in its own country in the 18th century due to centuries long Ottoman and Habsburg wars, the resettlement policies and continuous immigration from neighboring countries. Major territorial changes made Hungary ethnically homogeneous after World War I. Nowadays, more than nine-tenths of the population is ethnically Hungarian and speaks Hungarian as the mother tongue.[10]
1400-2023 Historical population development on the territory of present-day Hungary
Kniezsa's (1938) view on the ethnic map of the Kingdom of Hungary in the 11th century, based on toponyms. Kniezsa's view has been criticized by many scholars, because of its non-compliance with later archaeological and onomastics research, but his map is still regularly cited in modern reliable sources. One of the most prominent critics of this map was Emil Petrovici.[71]
Estimated ethnic map of the Kingdom of Hungary in 1495, created by the Hungarian Academy of Sciences based on their research. Hungarians are depicted in orange. The date 1495 is based on a nationwide registry conducted in the Kingdom of Hungary by commission of the royal treasury. The map shows the estimated absolute or relative linguistic majority of the local population based on the family names of taxpayers recorded in national or domanial registers, the linguistic analysis of the names of geographic objects and on various scholarly sources.[72][73][74][75]
Ethnic map of the Kingdom of Hungary in 1784 by the Hungarian Academy of Sciences, based on their researches. Hungarians are depicted in orange. The ethnic pattern of Hungary changed due to the centuries long wars and migration movements.[72][73][74]
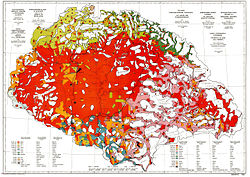
The Red Map.[76][77] Ethnic map of the Hungary proper publicized by the Hungarian delegation. Regions with population density below 20 persons/km2[78] are left blank and the corresponding population is represented in the nearest region with population density above that limit. The map is a smaller version of a more detailed map by Pál Teleki, in which a vibrant, dominant red color was deliberately chosen to mark Hungarians while the light purple color of the Romanians, who were already the majority in the whole of Transylvania back then, is shadow-like.[79]
In the Kingdom of Hungary, the 1910 census was based on mother tongue.[80][81][82][83] According to the census, 54.4% of the inhabitants of Hungary were recorded to speak Hungarian as their native language.[80] This number included the Jewish ethnic group (around 5% of the population according to a separate census on religion[84] and about 23% of Budapest's citizenry) who were overwhelmingly Hungarian-speaking (the Jews tending to declare German as mother tongue due to the immigration of Jews of Yiddish/German mother tongue).[85]
Ethnic map of the Kingdom of Hungary in 1910, based on the 1910 Hungarian census.
Ethnic map of the Kingdom of Hungary and the Carpatho-Pannonian area in 1930, based on the Hungarian (1930), Czechoslovak (1930), Romanian (1930), Yugoslav (1931), Polish (1931), and Austrian (1934) censuses.
The infant mortality rate (IMR) decreased considerably after WW II. In 1949, the IMR was 91.0. The rate decreased to 47.6 in 1960, 35.9 in 1970, 23.2 in 1980, 14.8 in 1990, 9.2 in 2000 and reached an all-time low in 2023 at 3.1 per 1000 live born children.[93]
Population Estimates by Sex and Age Group (01.01.2021) (Data refer to usual resident population.): [104]
Age group
Male
Female
Total
%
Total
4 663 794
5 066 978
9 730 772
100
0–4
241 553
228 350
469 903
4.83
5–9
235 461
222 548
458 009
4.71
10–14
250 542
238 779
489 321
5.03
15–19
250 935
236 815
487 750
5.01
20–24
269 584
252 965
522 549
5.37
25–29
321 164
300 576
621 740
6.39
30–34
321 542
300 563
622 105
6.39
35–39
322 953
310 447
633 400
6.51
40–44
404 753
394 017
798 770
8.21
45–49
396 980
389 352
786 332
8.08
50–54
340 428
344 513
684 941
7.04
55–59
271 871
294 030
565 901
5.82
60–64
279 106
334 279
613 385
6.30
65–69
283 306
374 078
657 384
6.76
70–74
203 869
299 041
502 910
5.17
75–79
137 540
234 575
372 115
3.82
80–84
77 655
166 734
244 389
2.51
85–89
37 559
94 389
131 948
1.36
90–94
12 938
38 093
51 031
0.52
95–99
3 096
10 430
13 526
0.14
100–104
725
1 958
2 683
0.03
105–109
201
414
615
0.01
110+
33
32
65
<0.01
Age group
Male
Female
Total
Percent
0–14
727 556
689 677
1 417 233
14.56
15–64
3 179 316
3 157 557
6 336 873
65.12
65+
756 922
1 219 744
1 976 666
20.31
Vital statistics by county
There are large variations in the birth rates as of 2016: Zala County has the lowest birth rate with 7.5 births per thousand inhabitants, while Szabolcs-Szatmár-Bereg County has the highest birth rate with 11.2 births per thousand inhabitants.
The death rates also differ greatly from as low as 11.3 deaths per thousand inhabitants in Pest County to as high as 15.7 deaths per thousand inhabitants in Békés County.
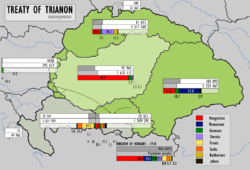
Hungary before the Treaty of Trianon (4 June 1920)
The Red Map. Ethnic map of the Hungary proper publicized by the Hungarian delegation. Regions with population density below 20 persons/km are left blank and the corresponding population is represented in the nearest region with population density above that limit. The vibrant, dominant red color was deliberately chosen to mark Hungarians while the light purple color of the Romanians, who were already the majority in the whole of Transylvania back then, is shadow-like.
Spaces with a smaller density than 20 persons/sq km
Hungary lost 64% of its total population in consequence of the Treaty of Trianon, decreasing from 20.9million to 7.6million,[109] and 31% (3.3 out of 10.7million) of its ethnic Hungarians,[61] Hungary lost five of its ten most populous cities.[110]
Hungary lost 72% of its territory, its sea access, half of its 10 biggest cities and all of its precious metal mines; 3,425,000 ethnic Hungarians found themselves separated from their motherland. Based on the 1910 census. Administrative Hungary in green, autonomous Croatia-Slavonia grey.
According to the census of 1910, the largest ethnic group in the Kingdom of Hungary were Hungarians, who were 54.5% of the population of Kingdom of Hungary, excluding Croatia-Slavonia. Although the territories of the former Kingdom of Hungary that were assigned by the treaty to neighbouring states in total had a majority of non-Hungarian population, they also included areas of Hungarian majority and significant Hungarian minorities, numbering 3,318,000 in total.
The number of Hungarians in the different areas based on census data of 1910. The present day location of each area is given in parentheses.
Non-Hungarian population in the Kingdom of Hungary, based on 1910 census data
Romanians, Slovaks, Ruthenians, Serbs, Croats and Germans, who represented the majority of the populations of the above-mentioned territories:
In Upper Hungary (mostly Slovakia): 1,687,977 Slovaks and 1,233,454 others (mostly Hungarians - 886,044, Germans, Ruthenians and Roma). However, according to the Czechoslovak census in 1921, there were 2,025,003 (67,5%) Slovaks, 650,597 (21,7%) Hungarians, 145,844 (4,9%) Germans, 88,970 (3,0%) Ruthenians and 90,456 (3,0%) others including Jews.[114]
In Carpathian Ruthenia (Ukraine): 330,010 Ruthenians and 275,932 others (mostly Hungarians, Germans, Romanians, and Slovaks)
In Transylvania (Romania): 2,831,222 Romanians (53.8%) and 2,431,273 others (mostly Hungarians - 1,662,948 (31.6%) and Germans - 563,087 (10.7%). The 1919 and 1920 Transylvanian censuses indicate a greater percentage of Romanians (57.1%/57.3%) and a smaller Hungarian minority (26.5%/25.5%)[115]
The number of bilingual people was much higher, for example 1,398,729 people spoke German (17%), 399,176 people spoke Slovak (5%), 179,928 people spoke Croatian (2.2%) and 88,828 people spoke Romanian (1.1%). Hungarian was spoken by 96% of the total population and was the mother language of 89%. The percentage and the absolute number of all non-Hungarian nationalities decreased in the next decades, although the total population of the country increased.
Note: 300.000 Hungarian refugees fled to Hungary from the territory of successor states (Romania, Czechoslovakia and Yugoslavia) after the WW I.[117]
From 1938 to 1945
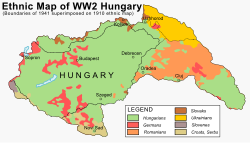
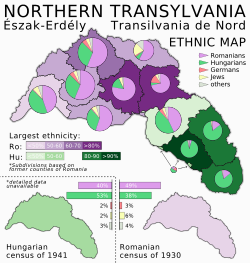
Ethnic map of Hungary in 1910, with 1941 borders superimposed.Ethnic map of Northern Transylvania
Hungary expanded its borders with territories from Czechoslovakia, Romania and Yugoslavia following the First Vienna Award (1938) and Second Vienna Award (1940). The remainder of Carpathian Ruthenia and parts of Yugoslavia were occupied and annexed in 1939 and 1941, respectively. Regarding Northern Transylvania, the Romanian census from 1930 counted 38% Hungarians and 49% Romanians,[118] while the Hungarian census from 1941 counted 53.5% Hungarians and 39.1% Romanians.[119] The territory of Bácska had 789,705 inhabitants, and 45,4% or 47,2% declared themselves to be Hungarian native speakers or ethnic Hungarians.[119] The percentage of Hungarian speakers was 84% in southern Czechoslovakia and 25% in the Sub-Carpathian Rus.[116]
After World War II, about 200,000 Germans were deported to Germany according to the decree of the Potsdam Conference. Under the forced exchange of population between Czechoslovakia and Hungary, approximately 73,000 Slovaks left Hungary. After these population movements Hungary became an ethnically almost homogeneous country except the rapidly growing number of Romani people in the second half of the 20th century.
Note: In 2001 570,537, in 2011 1,398,731 people did not give answer for ethnicity. Moreover, people were able to give more than one answer on the question asking for the minorities (for example, people were allowed to write Hungarian as their first ethnic identity and German as an ethnic identity being influenced by), hence the sum of the above exceeds the number of population.
Methodology had changed in 2001 and 2011 also.[123]
Roma people is estimated to be around 8.8% Roma[124][125]
Historical ethnic groups of Hungary
Hungarians in Hungary (2001)Minorities of Hungary
When the Hungarians invaded the Carpathian Basin, it was inhabited by Slavic and Avar peoples. Written sources from the 9th century also suggest that some groups of Onogurs and Bulgars occupied the valley of the river Mureș at the time of the Magyars’ invasion. There is a dispute as to whether Romanian population existed in Transylvania during that time.
The first Romani groups arrived in Hungary in the fifteenth century from Turkey.[126] Nowadays, the real number of Roma in Hungary is a disputed question.
In the 2001 census only 190 046 (2%) called themselves Roma, but experts and Roma organisations estimate that there are between 450,000 and 1,000,000 Roma living in Hungary.[127][128][129][130][131] Since then, the size of the Roma population has increased rapidly. Today every fifth or sixth newborn child belongs to the Roma minority.[132] Based on current demographic trends, a 2006 estimate by Central European Management Intelligence claims that the proportion of the Roma population will double by 2050, putting the percentage of its Roma community at around 14-15% of the country's population.[132]
There are problems related to the Roma minority in Hungary, and the very subject is a heated and disputed topic.
Objective problems:
Slightly more than 80% of Roma children complete primary education, but only one third continue studies into the intermediate (secondary) level. This is far lower than the more than 90% proportion of children of non-Roma families who continue studies at an intermediate level. Less than 1% of Roma hold higher educational certificates.[133]
Poverty: most of the Roma people live in significantly worse conditions than others.[134]
Bad health conditions: life expectancy is about 10 years less compared to non-Romas
Population pyramid of Alsószentmárton (100% Romany inhabitants)
Kabars
Three Kabar tribes joined to the Hungarians and participated in the Hungarian conquest of Hungary.[51] They settled mostly in Bihar county.
Böszörménys
The Muslim Böszörménys migrated to the Carpathian Basin in the course of the 10th-12th centuries and they were composed of various ethnic groups. Most of them must have arrived from Volga Bulgaria and Khwarezm.
Pechenegs
Communities of Pechenegs (Besenyő in Hungarian) lived in the Kingdom of Hungary from the 11-12th centuries. They were most numerous in the county of Tolna.
Oghuz Turks (Ouzes)
Smaller groups of Oghuz Turk settlers ('Úzok' or 'Fekete Kunok/Black Cumans' in Hungarian) came to the Carphatian Basin from the middle of the 11th century.[135] They were settled mostly in Barcaság. The city of Ózd got its name after them.
Jassics
The Jassic (Jász in Hungarian) people were a nomadic tribe which settled -with the Cumans- in the Kingdom of Hungary during the 13th century. Their name is almost certainly related to that of the Iazyges. Béla IV, king of Hungary granted them asylum and they became a privileged community with the right of self-government. During the centuries they were fully assimilated to the Hungarian population, their language disappeared, but they preserved their Jassic identity and their regional autonomy until 1876. Over a dozen settlements in Central Hungary (e.g. Jászberény, Jászárokszállás, Jászfényszaru) still bear their name.[136]
Cumans
During the Russian campaign, the Mongols drove some 200,000 Cumans, a nomadic tribe who had opposed them, west of the Carpathian Mountains. There, the Cumans appealed to King Béla IV of Hungary for protection.[137] In the Kingdom of Hungary, Cumans created two regions named Cumania (Kunság in Hungarian): Greater Cumania (Nagykunság) and Little Cumania (Kiskunság), both located the Great Hungarian Plain. Here, the Cumans maintained their autonomy, language and some ethnic customs well into the modern era. According to Pálóczi's estimation originally 70–80,000 Cumans settled in Hungary.[14]
The oldest extant documents from Transylvania make reference to Vlachs too. Regardless of the subject of Romanian presence/non-presence in Transylvania prior to the Hungarian conquest, the first chronicles to write of Vlachs in the intra-Carpathian regions is the Gesta Hungarorum,[138][139] while the first written Hungarian sources about Romanian settlements derive from the 13th century, record was written about Olahteluk village in Bihar County from 1283.[140][141] The 'land of Romanians', Terram Blacorum (1222, 1280)[141][142][143][144] showed up in Fogaras and this area was mentioned under different name (Olachi) in 1285.[141] The first appearance of a probably Romanian name 'Ola' in Hungary derives from a charter (1258).[141]
They were a significant population in Transylvania, Banat, Maramureș and Partium (Crișana). There are different estimations in connection with number of Romanians in Kingdom of Hungary. According to a research based on place-names made by István Kniezsa, 511 villages of Transylvania and Banat appear in documents at the end of the 13th century, however only 3 of them bore Romanian names,[145] and around 1400AD, Transylvania and Banat consisted of 1757 villages, though only 76 (4.3%) of them had names of Romanian origin.[145] The number of Romanians started to increase significantly from the Early modern period,[145] and by 1700 the Romanian ethnic group consisted of 40 percent of the Transylvanian population and their number raised even more in the 18th century.[145] Although, in 1574, Pierre Lescalopier, relating his voyage from Venice to Constantinople, claimed that most of the inhabitants of Transylvania were Romanians[146] and according to other estimates, the Romanian inhabitants who were primarily peasants, consisted of more than 60 percent of the population in 1600.[147] Jean W. Sedlar estimates that Vlachs (Romanians) constituted about two-thirds of Transylvania's population in 1241 on the eve of the Mongol invasion,[148] however according to Károly Kocsis and Eszter Kocsisné Hodosi the Hungarian ethnic group in Transylvania was in decent majority before Battle of Mohács and only lost its relative majority by the 17th century.[149] Nevertheless, Grigore Ureche in Letopisețul Țării Moldovei (1642 - 1647) noticed that in Transylvania Romanians were more numerous than Hungarians.[150] Official censuses with information on Hungary's ethnic composition have been conducted since the 19th century.[151][152][153]
The Slovak people lived mainly in Upper Hungary, northern parts of the Kingdom of Hungary. Due to post-Ottoman resettlements, the regions of Vojvodina, Banat and Békés county received bigger Slovak communities in the 18th century, which revitalized many deserted villages and towns, such as Békéscsaba, where Slovaks became the biggest ethnic group, or Nyíregyháza, where they comprised more than a third of the population in 1881.[154] After WWII a major population exchange with Czechoslovakia was carried out: 71,787 or 73,200 Slovaks from Hungary[155][156][157] were transferred to Slovakia – the exact number depends on source consulted – were resettled in South Slovakia in exchange for, according to different estimations, 45,000[158][159] or 120,000[160][161] Hungarians.
From the 14th century, escaping from the Ottoman threat, a large number of Serbs migrated to the Hungarian Kingdom. After the Battle of Mohács, most of the territory of Hungary got into Ottoman rule. In that time, especially in the 17th century, many Serb, and other Southern Slavic immigrants settled in Hungary. Most of the Ottoman soldiers in the territory of present-day Hungary were South Slavs (the Janissary). After the Turkish withdrawal, Kingdom of Hungary came under Habsburg rule, a new wave of Serb refugees migrated to the area around 1690, as a consequence of the Habsburg-Ottoman war. In the first half of the 18th century, Serbs and South Slavs were ethnic majority in several cities in Hungary.
The third, largest wave of German-speaking immigrants into Hungary occurred after the withdrawal of the Ottoman Empire from Hungarian territory, after the Treaty of Karlowitz. Between 1711 and 1780, German-speaking settlers immigrated to the regions of Southern Hungary, mostly region of Bánát, Bács-Bodrog, Baranya and Tolna counties (as well as into present-day Romania and Yugoslavia), which had been depopulated by the Ottoman wars. At the end of the 18th century, the Kingdom of Hungary contained over one million German-speaking residents (collectively known as Danube Swabians).[162] In 2011, 131,951 people declared to be German in Hungary (1,6%).[163]
Rusyns
Rusyns had lived mostly in Carpathian Ruthenia, Northeast Hungary, however significant Rusyn population appeared in Vojvodina from the 18th century.
Croats
Croatia was in personal union with Hungary from 1102. Croat communities were spread mostly in the western and southern part of the country and along the Danube, including Budapest.
Poles
The Poles lived at the northern borders of Kingdom of Hungary from the arrival of the Hungarians.
Slovenes
The Slovenes (Vendek in Hungarian) lived in the western part of the Carpathian basin before the Hungarian conquest. In the 11th and 12th century, the current linguistic and ethnic border between the Hungarian and Slovene people was established. Nowadays, they live in Vendvidék (Slovenska krajina in Slovenians) between the Mura and the Rába rivers. In 2001, there were around 5,000 Slovenes in Hungary.
Jews
The first historical document about Jews of Hungary is the letter written about 960 to King Joseph of the Khazars by Hasdai ibn Shaprut, the Jewish statesman of Córdoba, in which he says Jews living in "the country of Hungarin". There are Jewish inscriptions on tombs and monuments in Pannonia (Roman Hungary) dated to the second or third century CE.[164]
The first Armenians came to Hungary from the Balkans in the 10 - 11th century.
Greeks
Greeks migrated to Kingdom of Hungary from the 15th and 16th centuries. Mass migrations did not occur until the 17th century,[165] the largest waves being in 1718 and 1760–1770;[166] they were primarily connected to the economic conditions of the period.[165] It is estimated that 10,000 Greeks emigrated to Hungary in the second half of the 18th century.[166] A number of Greeks Communists escaped to Hungary after the Greek Civil War, notably in the 'Greek' village of Beloiannisz.
The town of Szentendre and the surrounding villages were inhabited by Bulgarians since the Middle Ages. However, present day Bulgarians are largely descended from gardeners who migrated to Hungary from the 18th century.
The majority of Hungarians became Christian in the 11th century. Hungary remained predominantly Catholic until the 16th century, when the Reformation led to the first Lutherans, and later Calvinists, which were embraced by nearly the entire Hungarian population at the time.
In the second half of the 16th century, Jesuits led a successful campaign of counterreformation among the Hungarians, although Protestantism survived as the faith of a significant minority, especially in the far east and northeast of the country. Orthodox Christianity in Hungary has been the religion mainly of some national minorities in the country, notably Romanians, Rusyns, Ukrainians, and Serbs.
Faith Church, one of Europe's largest Pentecostal churches, is also located in Hungary. Hungary has historically been home to a significant Jewish community.
Distribution of religions in Hungary
According to 2011 census data, Christianity is the largest religion in Hungary, with around 5.2million adherents (52.9%),[168] while the largest denomination in Hungary is the Catholic Church (38.9% — Latin Church 37.1%; Hungarian Greek Catholic Church 1.8%).[169] There is a significant Calvinist minority (11.6% of the population) and smaller Lutheran (2.2%), Orthodox (0.1%) and Jewish (0.1%) minorities. However, these census figures are representative of religious affiliation rather than attendance; around 12% of Hungarians attend religious services more than least once a week and around 50% more than once a year, while 30% of Hungarians do not believe in God at all.[170] The census showed a large drop of religious adherents who wish to answer, from 74.6% to 54.7% in ten years' time, replacing them by people either who do not wish to answer or people who are not following a religion.
Immigration
Hungary migration data, 2001-present
Year
Foreign Immigrants
Foreign Emigrants
Net Migration (Foreigners)
Hungarian Returning Citizens
Hungarian Emigrants
Net Migration (Hungarians)
Total Net Migration
2001
20,308
1,944
18,364
-
-
-
2002
17,972
2,388
15,584
-
-
-
2003
19,365
2,553
16,812
-
-
-
2004
22,164
3,466
18,698
-
-
-
2005
25,582
3,320
22,262
-
-
-
2006
23,569
3,956
19,613
-
-
-
2007
22,607
4,133
18,474
-
-
-
2008
35,547
4,241
31,306
-
-
-
2009
25,582
5,600
19,982
-
-
-
2010
23,884
6,047
17,837
1,575
7,318
-5,743
12,094
2011
22,514
2,687
19,827
2,443
12,413
-9,970
9,857
2012
20,340
9,916
10,424
4,194
12,964
-8,770
1,654
2013
21,250
13,111
8,139
9,354
21,580
-12,226
-4,087
2014
26,004
10,828
15,176
11,356
31,385
-20,029
-4,853
2015
25,787
10,373
15,414
14,810
32,852
-18,042
-2,628
2016
23,803
10,464
13,339
16,215
29,425
-13,210
129
2017
36,453
12,872
23,581
20,906
26,957
-6,051
17,530
2018
49,312
24,370
24,942
23,401
23,808
-407
24,535
2019
55,297
27,895
27,402
23,172
21,900
1,272
28,674
2020
43,785
48,042
-4,257
23,104
19,322
3,782
-475
2021
49,069
46,269
2,800
22,583
21,730
853
3,653
2022
55,514
29,583
25,931
24,147
28,825
-4,678
21,253
2023
61,347
35,633
25,714
23,866
35,736
-11,870
13,844
2024
49,300
43,000
6,300
28,900
41,300
-12,400
-6,100
Foreign citizenship population
Number of foreign citizens residing in Hungary on January 1: (countries with at least 2,000 persons)[171]
↑In fertility rates, 2.1 and above represents a stable or increasing population and have been marked blue, while 2.0 and below leads to an aging and, ultimately, declining population.
↑Except in the year 1941, Jewish people were not recognized as a minority, but only as a religion — assuredly, many Jews considered themselves as belonging to one of the recognized minorities.
Sources
Taylor, A.J.P. (1948). The Habsburg Monarchy 1809–1918 – A History of the Austrian Empire and Austria-Hungary. London: Hamish Hamilton.
↑Dezső Danyi-Zoltán Dávid: Az első magyarországi népszámlálás (1784–1787)/The first census in Hungary (1784–1787), Hungarian Central Statistical Office, Budapest, 1960, pp. 30
123456789101112József Kovacsics, Population history of Hungary mirrored by the conference-series (896-1870) (Magyarország népességtörténete a konferenciasorozat tükrésben (896-1870)), In: Demographia, 1996 - VOLUME 39, NUMBER 2-3, p. 145-165
12George Richard Potter, The New Cambridge modern history: The Renaissance, 1493–1520, CUP Archive, 1971, p. 405
12The New review, Volume 6, World Federation of Ukrainian Former Political Prisoners and Victims of the Soviet Regime, A. Pidhainy., 1966, p. 25
↑Leslie Konnyu, Hungarians in the United States: an immigration study, American Hungarian Review, 1967, p. 4
↑László Kósa, István Soós, A companion to Hungarian studies, Akadémiai Kiadó, 1999, p. 16
↑Teppo Korhonen, Helena Ruotsala, Eeva Uusitalo, Making and breaking of borders: ethnological interpretations, presentations, representations, Finnish Literature Society, 2003, p.39
↑Carlile Aylmer Macartney, The Habsburg Empire, 1790–1918, Macmillan, 1969, p. 79
↑Gábor Ágoston, Bruce Alan Masters, Encyclopedia of the Ottoman Empire, Infobase Publishing, 2009, p. 258
↑Domokos G. Kosáry, A history of Hungary, The Benjamin Franklin bibliophile society, 1941, p. 79
123Richard C. Frucht, Eastern Europe: an introduction to the people, lands, and culture / edited by Richard Frucht, Volume 1, ABC-CLIO, 2005, p. 356
↑Carl Cavanagh Hodge, Encyclopedia of the Age of Imperialism, 1800–1914: A-K, Greenwood Publishing Group, 2008, p. 306
↑Molnár, Miklós (2001). A Concise History of Hungary. Cambridge University Press. p.262. ISBN978-0521667364.
↑Macartney, C.A. (1937). Hungary and Her Successors. Oxford University Press. p.489. ISBN978-0837156216.{{cite book}}: ISBN / Date incompatibility (help)
↑Kontler, László (2002). A History of Hungary: Millennium in Central Europe. Palgrave Macmillan. p.255. ISBN978-0333809176.{{cite book}}: Check |isbn= value: checksum (help)
↑Kontler, László (2002). A History of Hungary: Millennium in Central Europe. Palgrave Macmillan. p.255. ISBN978-0333809176.{{cite book}}: Check |isbn= value: checksum (help)
↑Macartney, C.A. (1937). Hungary and Her Successors. Oxford University Press. p.489. ISBN978-0837156216.{{cite book}}: ISBN / Date incompatibility (help)
↑Kovacsics, József (1996). The Population of Hungary. Hungarian Central Statistical Office. p.28. ISBN978-9632150918.
↑Romsics, Ignác (2002). The Dismantling of Historic Hungary. Columbia University Press. pp.38–40. ISBN978-0880334562.{{cite book}}: Check |isbn= value: checksum (help)
12Kocsis, Károly (1996–2000). "V. Népesség és társadalom – Demográfiai jellemzők és folyamatok – Magyarország népessége – Anyanyelv, nemzetiség alakulása"[V. Population and Society – Demographic Characteristics and Processes – Hungary's Population – Development of Mother Tongue and Nationality]. In István, Kollega Tarsoly (ed.). Magyarország a XX. században – II. Kötet: Természeti környezet, népesség és társadalom, egyházak és felekezetek, gazdaság[Hungary in the 20th century – II. Volume: Natural Environment, Population and Society, Churches and Denominations, Economy] (in Hungarian). Szekszárd: Babits Kiadó. ISBN963-9015-08-3.
12Károly Kocsis, Eszter Kocsisné Hodosi, Ethnic Geography of the Hungarian Minorities in the Carpathian Basin, Simon Publications LLC, 1998, p. 116-153 Archived 2015-04-03 at the Wayback Machine
↑Kristó, Gyula (2003). Early Transylvania (895-1324). Lucidus Kiadó. ISBN978-963-9465-12-1.
↑Spinei, Victor (2009). The Romanians and the Turkic Nomads North of the Danube Delta from the Tenth to the Mid-Thirteenth century. Koninklijke Brill NV. ISBN978-90-04-17536-5.
↑György Fejér, Codex diplomaticus Hungariae ecclesiasticus ac civilis, Volume 7, typis typogr. Regiae Vniversitatis Vngaricae, 1831
1234Tamás Kis, Magyar nyelvjárások, Volumes 18-21, Nyelvtudományi Intézet, Kossuth Lajos Tudományegyetem (University of Kossuth Lajos). Magyar Nyelvtudományi Tanszék, 1972, p. 83
↑Dennis P. Hupchick, Conflict and chaos in Eastern Europe, Palgrave Macmillan, 1995 p. 58
↑István Vásáry, Cumans and Tatars: Oriental military in the pre-Ottoman Balkans, 1185–1365, Cambridge University Press, 2005, p. 28 [permanent dead link]
↑Heinz Stoob, Die Mittelalterliche Städtebildung im südöstlichen Europa, Böhlau, 1977, p. 204
↑"Tout ce pays la Wallachie et Moldavie et la plus part de la Transivanie a esté peuplé des colonie romaines du temps de Traian l'empereur...Ceux du pays se disent vrais successeurs des Romains et nomment leur parler romanechte, c'est-à-dire romain ... " cited from "Voyage fait par moy, Pierre Lescalopier l'an 1574 de Venise a Constantinople", fol 48 in Paul Cernovodeanu, Studii si materiale de istorie medievala, IV, 1960, p. 444
↑Sedlar, Jean W.: East Central Europe in the Middle Ages, 1000–1500; University of Washington Press, 1994; ISBN0-295-97290-4, page 8
↑Károly Kocsis, Eszter Kocsisné Hodosi, Ethnic Geography of the Hungarian Minorities in the Carpathian Basin, Simon Publications LLC, 1998, p. 102 (Table 19) [permanent dead link]
↑"În ţara Ardealului nu lăcuiescu numai unguri, ce şi saşi peste samă de mulţi şi români peste tot locul, de mai multu-i ţara lăţită de români decât de unguri." cited from Grigore Ureche, Letopisețul Țării Moldovei, pp. 133–134
↑A. J. P. Taylor, The Habsburg Monarchy 1809–1918, 1948.
↑Bobák, Ján (1996). Maďarská otázka v Česko–Slovensku, 1944–1948 [Hungarian Question in Czechoslovakia] (in Slovak). Matica slovenská. ISBN 978-80-7090-354-4.
↑Zvara, Juraj (1969). Maďarská menšina na Slovensku po roku 1945 [Hungarian minority in Slovakia after 1945] (in Slovak). Bratislava: Epocha, t. Pravda.
↑Kaplan, Karel (1987). The short march: the Communist takeover in Czechoslovakia, 1945–1948. C.Hurst & Co. Publishers. ISBN 978-0-905838-96-0.
↑Šutaj, Štefan (2005). Nútené presídlenie Maďarov zo Slovenska do Čiech [Deportation of population of Hungarian nationality out of Slovakia to Bohemia after the World War II] (in Slovak). Prešov: Universum. ISBN 978-80-89046-29-4.
↑Károly Kocsis, Eszter Kocsisné Hodosi, Ethnic Geography of the Hungarian Minorities in the Carpathian Basin, Simon Publications LLC, 1998, p. 23 [permanent dead link]
This page is based on this Wikipedia article Text is available under the CC BY-SA 4.0 license; additional terms may apply. Images, videos and audio are available under their respective licenses.


 Population pyramid of Budapest (99.2% non-Romany inhabitants), see: Demographics of Budapest
 Population pyramid of Alsószentmárton (100% Romany inhabitants)


