Demographics of Kosovo Last updated January 28, 2026
Demographics of Kosovo Population [ 1] Growth rate [ 2] Birth rate [ 2] Death rate [ 2] Life expectancy [ 3] : 13 • male [ 3] : 13 • female [ 3] : 13 Fertility rate [ 2] Infant mortality rate [ 2] Net migration rate -0.4 per 1,000 pop. (2024) [ 2] 0–14 years 27.2% 15–64 years 66.1% 65 and over 6.7% Total 1.007 male(s)/female Nationality noun : Kosovar /Kosovan(s) adjective : KosovarMajor ethnic Albanians (91.8%) (2024) Minor ethnic Serbs (2.3%), [ note 1] Bosniaks (1.7%), Turks (1.2%), Ashkali (1%) and others Official Albanian Spoken Albanian (93.67%)
The Kosovo Agency of Statistics monitors various demographic features of the population of Kosovo , such as population density , ethnicity , education level, health of the populace , economic status, religious affiliations and other aspects of the population. Censuses , normally conducted at ten-year intervals, record the demographic characteristics of the population.
According to the last census of the April 2024 by the Kosovo Agency of Statistics , there were 1,588,566 inhabitants, of which 795,552 are men (50.08%) and 790,014 are women (49.92%). [ 8] The same year, US CIA World Factbook estimate put the country's population at 1,977,093. [ 2] According to the first census conducted after the 2008 declaration of independence in 2011, the permanent population of Kosovo was 1,739,825. [ 9] [ 3] : 12
Kosovo is a fairly ethnically and linguistically homogeneous country . The 2024 census shows that ethnic Albanians make the overwhelming majority of Kosovo, with 91.8% of the population, while minorities include Serbs (2.3%), [ a] Bosniaks (1.7%), Turks (1.2%), Ashkali (1%) and other ethnicities all less than 1%. [ 10]
The official languages of Kosovo are Albanian and Serbian . Albanian is the native language for 93.67% of the population, while minority languages are also officially recognized in certain municipalities, depending on their ethnic makeup. The main religions of Kosovo are Islam (93.49%), Eastern Orthodoxy (2.31%) and Roman Catholic (1.75%). The average urbanization of Kosovo is at 50.18% with a growing trend. [ 10]
Kosovo has the youngest population in Europe. The average age is 34.8 and median age is 32, as of 2024. [ 8] [ 2] In 2008, half of its population was under the age of 25 (United Nations Development Programme data) and more than 65 percent of the population was younger than 30 (government data). [ 11]
History Historical population Year 1921 439,010 — 1931 552,064 +2.32% 1948 733,034 +1.68% 1953 815,908 +2.17% 1961 963,988 +2.11% 1971 1,243,693 +2.58% 1981 1,584,440 +2.45% 1991 1,956,196 +2.13% 2011 1,780,021 −0.47% 2024 1,602,515 −0.80% Source: [ 12] [ 13] [ 1]
Population of Kosovo from 1921 to 2015 million year 0.6 0.9 1.2 1.5 1.8 2.1 2.4 1950 1960 1970 1980 1990 2000 2010 2020 2030 population (million) Kosovo Population
‰ years 5 10 15 20 25 30 35 1950 1960 1970 1980 1990 2000 2010 2020 2030 Natural change (per 1000) Kosovo Natural Population Change
‰ years 1 2 3 4 5 6 7 8 1950 1960 1970 1980 1990 2000 2010 2020 2030 TFR Total Fertility Rate
2011 census The 2011 census recorded Kosovo (excluding North Kosovo ) as having 1,739,825 inhabitants. [ 14] The European Centre for Minority Issues (ECMI) has called "for caution when referring to the 2011 census", due to the boycott by Serb-majority municipalities in North Kosovo and the large boycott by Serbs and Roma in southern Kosovo. [ 15] The recorded total population was below most previous estimates. The census enjoyed considerable technical assistance from international agencies and appears to have been endorsed by Eurostat ; it was, however, the first full census since 1981, and not one of an uninterrupted series. The results show that there were no people temporarily resident in hotels or refugee camps at the time of the census; [ 16] that out of 312,711 conventional dwellings, 99,808 (over 30%) were unoccupied; [ 16] and that three municipalities designed[ clarification needed ] Ahtisaari Plan to have Serb majorities – Klokot , Novo Brdo , and Štrpce – in fact had ethnic Albanian majorities (although their municipal assemblies have Serb majorities). [ 16]
Kosovo ethnic map 2011 by settlement
Distribution of Albanians in Kosovo 2011 by settlements
Distribution of Serbs in Kosovo by settlements 2011
Distribution of
Bosniaks in Kosovo by settlements
Distribution of
Turks in Kosovo by settlements
Distribution of
Gorani in Kosovo by settlements
Distribution of
Roma ,
Ashkali and Egyptians in Kosovo by settlements
Vital statistics Source: Kosovo Agency of Statistics [ 17] [ 18] [ 19]
Population estimates in the table below may be unreliable during the 1990s period. Besides, vital statistics do not fully include data from Serb-majority territories. Since 2011, in accordance with European statistical norms, live births and deaths record figures in Kosovo only (excluding foreign countries).
Current vital statistics Period Live births Deaths Natural increase January—November 2024 19,595 8,845 +10,750 January—November 2025 20,181 8,910 +11,271 Difference Source: [ 28] [ 29] [ 30] [ 31]
Marriages and divorces Average population Marriages Divorces Crude marriage rate (per 1000) Crude divorce rate (per 1000) Divorces per 1000 marriages 1950 764,000 8,686 481 11.4 0.6 55.4 1951 780,000 7,300 475 9.4 0.6 65.1 1952 793,000 7,052 406 8.9 0.5 57.6 1953 813,000 7,208 382 8.9 0.5 53.0 1954 832,000 7,390 352 8.9 0.4 47.6 1955 842,000 6,815 445 8.1 0.5 65.3 1956 859,000 5,723 426 6.7 0.5 74.4 1957 873,000 5,860 403 6.7 0.5 68.8 1958 890,000 6,924 374 7.8 0.4 54.0 1959 921,000 6,794 498 7.4 0.5 73.3 1960 944,000 6,822 417 7.2 0.4 61.1 1961 967,353 7,426 479 7.7 0.5 64.5 1962 994,676 7,481 451 7.5 0.5 60.3 1963 1,022,218 7,183 346 7.0 0.3 48.2 1964 1,051,498 8,340 388 7.9 0.4 46.5 1965 1,082,170 8,226 347 7.6 0.3 42.2 1966 1,118,003 8,246 514 7.4 0.5 62.3 1967 1,150,622 7,569 314 6.6 0.3 41.5 1968 1,182,952 8,719 244 7.4 0.2 28.0 1969 1,189,140 10,083 226 8.5 0.2 22.4 1970 1,219,996 11,280 258 9.2 0.2 22.9 1971 1,253,975 11,006 238 8.8 0.2 21.6 1972 1,290,965 10,571 272 8.2 0.2 25.7 1973 1,327,853 11,139 198 8.4 0.1 17.8 1974 1,365,879 9,885 337 7.2 0.2 34.1 1975 1,404,977 9,928 261 7.1 0.2 26.3 1976 1,446,001 10,268 248 7.1 0.2 24.2 1977 1,486,816 10,470 472 7.0 0.3 45.1 1978 1,525,960 11,552 460 7.6 0.3 39.8 1979 1,565,995 11,568 355 7.4 0.2 30.7 1980 1,552,779 12,666 333 8.2 0.2 26.3 1981 1,594,451 11,936 280 7.5 0.2 23.5 1982 1,634,893 12,368 289 7.6 0.2 23.4 1983 1,676,325 12,406 256 7.4 0.2 20.6 1984 1,716,884 12,560 237 7.3 0.1 18.9 1985 1,760,132 12,483 332 7.1 0.2 26.6 1986 1,803,579 11,921 364 6.6 0.2 30.5 1987 1,848,111 13,644 260 7.4 0.1 19.1 1988 1,894,131 14,613 389 7.7 0.2 26.6 1989 1,938,794 14,343 320 7.4 0.2 22.3 1990 1,987,056 12,742 509 6.4 0.3 39.9 1991 1,967,675 12,559 354 6.4 0.2 28.2 1992 2,007,978 13,367 266 6.7 0.1 19.9 1993 2,043,740 13,372 248 6.5 0.1 18.5 1994 2,079,234 11,959 299 5.8 0.1 25.0 1995 2,115,020 12,979 352 6.1 0.2 27.1 1996 2,152,545 12,244 559 5.7 0.3 45.7 1997 2,188,083 11,866 396 5.4 0.2 33.4 1998 2,127,795 13,149 524 6.2 0.2 39.9 1999 2,067,507 14,432 652 7.0 0.3 45.2 2000 2,007,219 15,714 780 7.8 0.4 49.6 2001 1,946,932 16,997 909 8.7 0.5 53.5 2002 1,886,644 18,280 1,037 9.7 0.5 56.7 2003 1,826,356 17,034 1,165 9.3 0.6 68.4 2004 1,766,068 16,989 1,293 9.6 0.7 76.1 2005 1,743,780 15,732 1,445 9.0 0.8 91.9 2006 1,719,536 15,825 1,480 9.2 0.9 93.5 2007 1,733,404 16,824 1,558 9.7 0.9 92.6 2008 1,747,383 17,950 1,026 10.3 0.6 57.2 2009 1,761,474 20,209 1,555 11.5 0.9 76.9 2010 1,775,680 18,289 1,453 10.3 0.8 79.4 2011 1,786,229 16,619 1,469 9.3 0.8 88.4 2012 1,807,126 17,169 1,328 9.5 0.7 77.3 2013 1,818,119 14,664 1,040 8.1 0.6 70.9 2014 1,812,788 16,239 1,243 9.0 0.7 76.5 2015 1,788,274 16,274 1,268 9.1 0.7 77.9 2016 1,777,568 16,051 1,110 9.0 0.6 69.2 2017 1,791,019 17,112 1,072 9.6 0.6 62.6 2018 1,797,086 16,871 999 9.4 0.6 59.2 2019 1,788,891
Administrative divisions Kosovo is administratively subdivided into seven districts, and 38 municipalities. With the current estimation on population, Kosovo ranks as the 150th largest country in the world based on how populous it is. [ 32]
Rank Name Population (2024) Area (km2) Density Settlements English(most common) Albanian Serbian Prishtina District 511,307 2,470 207.0 298 1 Prishtina Prishtinë Priština 227,466 572 397.7 41 7 Podujevë Podujevë/Besianë Podujevo 70,975 663 107.1 76 11 Drenas Drenas Glogovac 48,079 290 165.8 37 12 Lipjan Lipjan Lipljan 55,044 422 130.4 70 21 Kosovo Polje Fushë Kosovë Kosovo Polje 63,949 83 770.5 15 26 Obiliq Obiliq/Kastriot Obilić 22,815 105 217.3 19 30 Gračanica Graçanicë Gračanica 18,486 131 141.1 16 33 Novo Brdo Novobërdë/Artanë Novo Brdo 4,493 204 22.0 24 Prizren District 271,386 1,397 194.3 195 2 Prizren Prizren Prizren 147,246 626 235.2 74 10 Suva Reka Suharekë/Therandë Suva Reka 45,749 306 149.5 42 14 Malisheva Malishevë Mališevo 43,888 361 121.6 43 22 Dragash Dragash/Sharr Dragaš 28,896 435 66.4 35 35 Mamusha Mamushë Mamuša 5,607 11 509.7 – Ferizaj District 180,583 1,030 175.3 12 3 Ferizaj Ferizaj Uroševac 109,255 345 316.7 45 23 Kaçanik Kaçanik Kačanik 27,716 221 125.4 31 25 Shtime Shtime Štimlje 24,308 134 181.4 23 31 Hani i Elezit Hani i Elezit Đeneral Janković/Elez Han 8,533 83 102.8 11 32 Štrpce Shtërpcë Štrpce 10,771 247 43.6 16 Peja District 146,256 1,365 107.1 118 4 Peja Pejë Peć 82,745 603 137.2 14 17 Istog Istog Istok 33,008 454 72.7 50 19 Klina Klinë Klina 30,503 308 99.0 54 Gjakova District 152,216 1,129 134.8 170 5 Gjakova Gjakovë Đakovica 78,699 587 134.1 91 13 Rahovec Rahovec Orahovac 41,799 276 151.4 32 18 Deçan Deçan Dečani 27,775 180 154.3 37 34 Junik Junik Junik 3,943 86 45.8 10 Mitrovica District 173,642 2,077 83.6 267 8 Mitrovica Mitrovicë Mitrovica 64,742 350 185.0 45 9 Vushtrri Vushtrri Vučitrn 61,528 344 178.9 67 15 Skenderaj Skënderaj Srbica 40,664 378 107.6 49 24 North Mitrovica Mitrovicë Veriore Severna Mitrovica 2,326 11 211.5 – 27 Leposavić Leposaviq/Albanik Leposavić 3,185 539 5.9 42 28 Zvečan Zveçan Zvečan 434 122 3.6 35 29 Zubin Potok Zubin Potok Zubin Potok 763 333 2.3 29 Gjilan District 150,176 1,206 124.5 287 6 Gjilan Gjilan Gnjilane 82,980 385 215.5 54 16 Viti Viti Vitina 35,566 278 127.9 39 20 Kamenica Kamenicë/Dardanë Kamenica 22,868 423 54.1 58 36 Ranilug Ranillug Ranilug 2,481 78 31.8 18 37 Klokot Kllokot Klokot 3,041 24 126.7 4 38 Parteš Partesh Parteš 3,240 18 180.0 3 1,585,566 10,908 145.4 1,339
Ethnic groups The official results of the censuses in Kosovo after World War II are tabulated below. The figures for Albanians in the 1991 census were estimates only, since that census was boycotted by most Albanians. Similarly, the figures for Serbs in the 2011 census omit those in North Mitrovica , Leposavić , Zubin Potok and Zvečan (North Kosovo ), while the number of Serbs and Romani in the rest of Kosovo is also deemed unreliable, due to the partial boycott . [ 15]
Ethnic 1948 census 1953 census 1961 census 1971 census 1981 census 1991 census 2011 census 2024 census Number % Number % Number % Number % Number % Number % Number % Number % Albanians 498,244 68.5 524,559 64.9 646,605 67.1 916,168 73.7 1,226,736 77.4 1,596,072 81.6 1,616,869 92.9 1,454,963 91.7 Serbs 171,911 23.6 189,869 23.5 227,016 23.5 228,264 18.4 209,498 13.2 194,190 9.9 25,532 1.5 36,652 2.3 Montenegrins 28,050 3.9 31,343 3.9 37,588 3.9 31,555 2.5 27,028 1.7 20,365 1.1 ethnic Muslims 9,679 1.3 6,241 0.8 8,026 0.8 26,357 2.1 58,562 3.7 66,189 3.4 Bosniaks 27,533 1.6 26,841 1.7 Gorani 10,265 0.6 9,140 0.6 Croats 5,290 0.7 6,201 0.8 7,251 0.8 8,264 0.7 8,718 0.6 8,062 0.4 Yugoslavs 5,206 0.5 920 0.1 2,676 0.2 3,457 0.2 Romani 11,230 1.5 11,904 1.5 3,202 0.3 14.593 1.2 34,126 2.2 45,760 2.3 8,824 0.5 8,730 0.5 Ashkali 15,436 0.9 16,270 1.0 Egyptians 11,524 0.6 10,581 0.6 Turks 1,315 0.2 34,583 4.3 25,764 2.7 12,244 1.0 12,513 0.8 10,445 0.5 18,738 1.1 19,419 1.2 Macedonians 526 0.1 972 0.1 1,142 0.1 1,048 0.1 1,056 0.1 Others or unspecified 1,577 0.2 2,469 0.3 2,188 0.2 4,280 0.3 3,454 0.2 11,656 0.6 3,264 0.6 2,051 0.1 Total 727,820 808,141 963,988 1,243,693 1,584,441 1,956,196 1,739,825 1,585,566
Ethnic groups by municipality The results of the 2011 census of ethnic groups in municipalities are tabulated below. [ 33]
Ethnic groups by municipality 2011 Census Albanians Serbs Turks Bosniaks Roma Ashkali Egyptians Goran Others Not declared Municipality Total Number % Number % Number % Number % Number % Number % Number % Number % Number % Number % Deçan (Deçan / Dečani) 40,019 39,402 98.5 3 0.0 0 0.0 60 0.1 33 0.1 42 0.1 393 1.0 1 0.0 19 66 0.2 Dragash (Dragash / Dragaš) 33,997 20,287 59.7 7 0.0 202 0.6 4,100 12.1 3 0.0 4 0.0 3 0.0 8,957 26.3 283 0.8 151 0.4 Ferizaj (Ferizaj / Uroševac) 108,610 104,152 95.9 32 0.0 55 0.1 83 0.1 204 0.2 3,629 3.3 24 0.0 64 0.1 102 0.1 265 0.2 Gjakova (Gjakova / Đakovica) 94,556 87,672 97.4 17 0.0 16 0.0 73 0.1 738 0.8 613 0.6 5,177 5.5 13 0.0 92 0.1 205 0.2 Gjilan (Gjilan / Gnjilane) 90,178 87,814 97.4 624 0.7 978 1.1 121 0.1 361 0.4 15 0.0 1 0.0 69 0.1 95 0.1 100 0.1 Glogovac (Gllogoc/Drenas / Glogovac) 58,531 58,445 99.9 2 0.0 5 0.0 14 0.0 0 0.0 0 0.0 3 0.0 0 0.0 22 0.0 41 0.1 Gračanica (Graçanica / Gračanica) 10,675 2,474 23.2 7,209 67.7 15 0.1 15 0.1 745 7.0 104 1.0 3 0.0 3 0.0 45 0.4 43 0.4 Kosovo Polje (Fushë Kosovë / Kosovo Polje) 34,827 30,275 86.9 321 0.9 62 0.2 34 0.1 436 0.3 3,230 9.3 282 0.3 15 0.0 131 0.4 41 0.1 Hani i Elezit (Elez Han) 9,403 9,357 99.5 0 0.0 0 0.0 42 0.4 0 0.0 0 0.0 0 0.0 0 0.0 2 0.0 2 0.0 Istog (Istok) 39,289 36,154 92.0 194 0.5 10 0.0 1,142 2.9 39 0.1 111 0.3 1,544 3.9 0 0.0 45 0.1 50 0.1 Junik 6,084 6,069 99.8 0 0.0 0 0.0 0 0.0 0 0.0 0 0.0 0 0.0 0 0.0 4 0.0 11 0.2 Kaçanik (Kačanik) 33,409 33,362 99.9 1 0.0 2 0.0 20 0.1 5 0.0 1 0.0 0 0.0 0 0.0 7 0.0 11 0.0 Kamenica (K. Kamenica) 36,085 34,186 94.7 1,554 4.3 5 0.0 9 0.0 240 0.7 0 0.0 0 0.0 29 0.1 27 0.1 35 0.1 Klina 38,496 37,216 96.7 98 0.3 3 0.0 20 0.1 78 0.2 85 0.2 934 2.4 0 0.0 23 0.1 39 0.1 Klokot (Kllokot / Klokot) 2,556 1,362 53.3 1,177 46.0 1 0.0 0 0.0 9 0.4 0 0.0 0 0.0 6 0.2 1 0.0 0 0.0 Leposavić (Leposaviq / Leposavić) [ note 2] 18,700 300 1.6 18,000 96.3 0 0.0 0 0.0 0 0.0 0 0.0 0 0 0.0 0.0 400 2.1 0 0.0 Lipjan (Lipljan) 57,605 54,467 94.6 513 0.9 128 0.2 42 0.1 342 0.6 1,812 3.1 4 0.0 6 0.0 260 0.5 31 0.1 Mališevo (Malisheva / Mališevo) 54,613 54,501 99.9 0 0.0 0 0.0 15 0.0 26 0.0 5 0.0 0 0.0 0 0.0 8 0.0 58 0.1 Mamuša (Mamusha / Mamuša) 5,507 327 5.9 0 0.0 5,182 93.2 1 0.0 39 0.7 12 0.2 0 0.0 0 0.0 0 0.0 0 0.0 Mitrovica, Kosovo (Mitrovicë / K. Mitrovica) 71,909 69,497 96.6 14 0.0 518 0.7 416 0.6 528 0.7 647 0.9 6 0.0 23 0.0 47 0.1 213 0.3 North Mitrovica [ note 2] 29,460 4,900 16.6 22,530 76.5 210 0.7 1,000 3.4 200 0.7 40 0.1 0 0.0 580 2.0 0 0.0 0 0.0 Novo Brdo (Novobërdë / Novo Brdo) 6,729 3,524 52.4 3,122 46.4 7 0.1 5 0.1 63 0.9 3 0.0 0 0.0 0 0.0 2 0.0 3 0.0 Obiliq (Obiliq/Kastriot / Obilić) 21,549 19,854 92.1 276 1.3 2 0.0 58 0.3 661 3.1 578 2.7 27 0.1 5 0.0 48 0.2 40 0.2 Parteš (Partesh / Parteš) 1,787 0 0.0 1,785 99.9 0 0.0 0 0.0 0 0.0 0 0.0 0 0.0 0 0.0 2 0.1 0 0.0 Peja (Peja / Peć) 96,450 87,975 91.2 332 0.3 59 0.1 3,786 3.9 993 1.0 143 0.1 2,700 2.8 189 0.2 132 0.1 141 0.1 Podujevo (Besiane / Podujevo) 88,499 87,523 98.9 0 0.0 5 0.0 33 0.0 74 0.1 680 0.8 2 0.0 0 0.0 43 0.0 127 0.1 Pristina (Prishtina / Priština) 198,897 194,452 97.8 430 0.2 2,156 1.1 400 0.2 56 0.0 557 0.3 8 0.0 205 0.1 334 0.2 299 0.2 Prizren 177,781 145,718 82.0 237 0.1 9,091 5.1 16,869 9.5 2,899 1.6 1,350 0.8 168 0.1 655 0.4 386 0.2 381 0.2 Rahovec (Orahovac) 56,208 55,166 98.1 134 0.2 0.2 0.0 10 0.0 84 0.1 404 0.7 299 0.5 0 0.0 11 0.0 98 0.2 Ranilug (Ranilug) 3,866 164 4.2 3,692 95.5 0 0.0 1 0.0 0 0.0 0 0.0 0 0.0 0 0.0 3 0.1 6 0.2 Štrpce (Shtërpcë / Štrpce) 6,949 3,757 54.1 3,148 45.3 0 0.0 2 0.0 24 0.3 1 0.0 0 0.0 0 0.0 7 0.1 4 0.1 Shtime (Shtime/ Štimlje) 27,324 26,447 96.8 49 0.2 1 0.0 20 0.1 23 0.1 750 2.7 0 0.0 2 0.0 13 0.0 19 0.1 Skenderaj (Srbica) 50,858 50,685 99.7 50 0.1 1 0.0 42 0.0 0 0.0 10 0.0 1 0.0 0 0.0 5 0.0 64 0.1 Suva Reka (Suharekë / Suva Reka) 59,722 59,076 98.9 2 0.0 4 0.0 15 0.0 41 0.1 493 0.8 5 0.0 0 0.0 15 0.0 71 0.1 Vitina (Viti / Vitina) 46,987 46,669 99.3 113 0.2 4 0.0 25 0.1 12 0.0 14 0.0 0 0.0 7 0.0 83 0.2 60 0.1 Vučitrn (Vushtrri / Vučitrn) 69,870 68,840 98.5 384 0.5 278 0.4 33 0.0 68 0.1 143 0.2 1 0.0 3 0.1 50 0.1 70 0.1 Zubin Potok [ note 2] 14,900 1,000 6.7 13,900 93.9 0 0.0 0 0.0 0 0.0 0 0.0 0 0.0 0 0.0 0 0.0 0 0.0 Zvečan (Zveçan / Zvečan) [ note 2] 16,650 350 2.1 16,000 96.1 0 0.0 0 0.0 0 0.0 0 0.0 0 0.0 0 0.0 0 0.0 0 0.0 Kosovo 1,819,604 1,623,419 90.0 80,000 [ note 2] 4.4 19,002 1.1 28,506 1.6 9,024 0.5 15,476 0.9 11,585 0.6 10,826 0.6 3,052 0.2 2,752 0.2
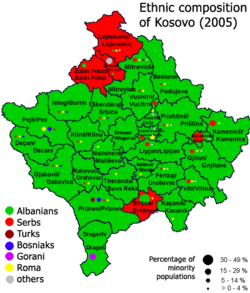
Ethnic composition of Kosovo in 2005 according to the Organization for Security and Co-operation in Europe The 2000 Living Standard Measurement Survey by Statistical Office of Kosovo found an ethnic composition of the population as follows:
A more comprehensive (October 2002) estimate (for the 1.9 million inhabitants) for these years:
During the Kosovo War in 1999, around 700,000 ethnic Albanians, [ 38] over 100,000 ethnic Serbs and more than 40,000 Bosniaks were forced out of Kosovo to neighbouring Albania , North Macedonia , Montenegro , Bosnia and Serbia . After the United Nations took over administration of Kosovo following the war, the vast majority of the Albanian refugees returned.[ citation needed ] Switzerland and Austria accounting for some 200,000 individuals each, or for 20% of the population resident in Kosovo.
Many non-Albanians – chiefly Serbs and Romani – fled or were expelled, mostly to the rest of Serbia at the end of the war, with further refugee outflows occurring as the result of sporadic ethnic violence. As of 2002, the number of registered refugees was around 250,000. [ 39] [ 40] [ 41] The non-Albanian population in Kosovo is now about half of its pre-war total[ citation needed ] north , but many remain in Kosovo Serb enclaves surrounded by Albanian-populated areas.
Languages Linguistic structure according to the 2011 census As defined by the Constitution of Kosovo , Albanian and Serbian are official languages in Kosovo. According to the 2011 census, almost 95% of the citizens speak Albanian as their native language, followed by South Slavic languages and Turkish . Due to North Kosovo 's boycott of the census, Bosnian came in as the second-largest language after Albanian. However, Serbian is in reality the second-most spoken language in Kosovo.[ citation needed ]
Health Harvard Medical School and NATO published a study on the impact of the conflict on Kosovo health system in 2014. [ 43] The data in the table below are from the Kosovo Agency of Statistics .
Structure of group of diseases according to ICD-10 recorded in PHC in 2010 Group of diseases Number Percentage Parasitic diseases 53,762 28 Tumors/cancers 2,943 1.5 Blood and homopotetic organ disease and immunity disorders 5,091 2.6 Endocrinic disorder of feeding and metabolism 25,212 13.1 Psychic and personality disorder 13,488 7 SQN diseases 15,490 8.1 Eye diseases 21,320 11.1 Ear and mastoid process diseases 18,989 9.9 Diseases of blood circulation system 5,139 2.7 Diseases of respiratory system 6,962 3.6 Diseases of digestive system 3,192 1.7 Dermic and hypodermic tissue diseases 1,453 0.8 Diseases of locomotor system and connective tissue 1,775 0.9 Disease of urogenital system 2,198 1.1 Pregnancy, delivery and maternity 5,737 3 Certain states resulting from perinatal periods 200 0.1 Inborn deformity, chromosomal deformities and anomalies 248 0.1 Symptoms, indications, analyses and clinical abnormal ascertainments 1,556 0.8 Injuries, poisoning, and other consequences caused by external factors 2,871 1.5 External factors of morbidity and mortality 579 0.3 579 0.3 Factors influencing on health conditions and contact with health services 3,948 2.1 Total 192,154
Religion The country has no official religion . The constitution establishes Kosovo as a secular state that is neutral in matters of religious beliefs and where everyone is equal before the law and freedom to belief, conscience and religion is guaranteed. [ 44] [ 45]
The 2011 Kosovo population census was largely boycotted by the Kosovo Serbs , especially in North Kosovo . That left the Serb population underrepresented. [ 46] The International Monitoring Operation said that questions complied with international standards: respondents can declare their ethnicity and religion but are not obliged to do so. [ 47] Serbs predominantly identify as Orthodox Christians . [ 48] The results of the 2011 census gave the following religious affiliations for the population included in it: [ 49]
Religious map of Kosovo in 2011 by settlements. The Serb-dominated gray area in the north is presumably majority Orthodox. 2011 & 2024 Kosovo religion census(boycotted by most Serbs) Religion Population 2011 % Population 2024 % Islam 1,663,412 95.6% 1,482,276 93.5% Christianity 64,275 38,438 25,837 3.7% 2.2% 1.5% 64,498 27,815 4.06% .75% .31% Other (specify) 1,188 0.1% 7,175 0.45% No religion 1,242 0.1% 7,899 0.50% Not stated Prefer not to answer Missing 9,708 7,213 2,495 0.6% 0.4% 0.1% 23,718 1.50% Total 1,739,825 100% 1,585,566 100%
Most Albanians in Kosovo are Muslim . [ 50] [ 48] Almost all Muslims in Kosovo are Sunni . A small amount of Muslims in Kosovo practice Sufism , mainly in Western Kosovo. Most Muslims in Kosovo follow the Hanafi Madhab .
The Serb population is largely Serbian Orthodox . The Catholic Albanian communities are mostly concentrated in Gjakova , Prizren , Klina and a few villages near Peć and Vitina (see laramans ). Slavic-speaking Catholics usually call themselves Janjevci or Kosovan Croats. Slavic-speaking Muslims in the south of Kosovo are known as the Gorani people .
Migration According to a 2015 report by Geoba.se, Kosovo's current net migration rate is at −3.72, ranking Kosovo 197th, [ 51] due to the ongoing political and economic crisis. The same source gives −0.71 for the 2023 estimate.
Internally displaced persons According to the US CIA, as of 2022 [ update] internally displaced persons , primarily Serbs displaced during the Kosovo War . [ 2] Also, a smaller number of Serbs, Roma, Ashkali, and Egyptians fled their homes in 2004 as a result of violence. [ 2]
Notes and references Notes ↑ The Kosovo Agency of Statistics (ASK) conducted a population assessment for four northern municipalities: Leposaviq, Zveçan, Zubin Potok, and North Mitrovica, which are predominantly inhabited by Serbs who largely boycotted the registration process. This assessment was carried out in collaboration with international experts, following international standards and practices for population evaluation. ↑ Due to political issues, Serbs have avoided participating in the population censuses conducted by the Republic of Kosovo. The census is therefore inaccurate to explain the real demographic spread in Kosovo. Serbs form the second largest ethnic group in Kosovo, after Albanians. Estimates are that Serbs hold 6-7% of the population. [ 4] [ 5] [ 6] [ 7] 1 2 3 4 5 Due to the boycott of the 2011 census by most municipalities in the Serb-inhabited north (see North Kosovo ), the real number of the population of Leposavić , North Mitrovica , Zubin Potok and Zvečan is unknown. Estimates are taken according to a 2014 OSCE report. [ 34] [ 35] [ 36] [ 37] 1 2 "ASK Data - Regjistrimi popullsisë" . Agjencia e Statistikave të Kosovës (ASK). 2025. Retrieved 19 July 2025 . 1 2 3 4 5 6 7 8 9 10 "Kosovo" . The World Factbook . Central Intelligence Agency . Retrieved 1 December 2024 . 1 2 3 4 "Series 1: General Statistics: Kosovo in Figures (2015)" (PDF) . Agjencia e Statistikave të Kosovës . September 2016. Archived from the original (PDF) on 30 September 2022. Retrieved 1 December 2024 . ↑ Cocozelli, Fred (2016). Ramet, Sabrina (ed.). Ethnic Minorities and Politics in Post-Socialist Southeastern Europe 267. ISBN 978-1316982778 ↑ Judah, Tim (7 November 2019). "Kosovo's demographic destiny looks eerily familiar" . Balkan Insight. ↑ "Kosovo Population 2019" . 28 July 2019. Archived from the original on 28 July 2019. Retrieved 11 July 2021 . ↑ Khakee, Anna; Florquin, Nicolas (1 June 2003). "Kosovo: Difficult Past, Unclear Future" (PDF) . Kosovo and the Gun: A Baseline Assessment of Small Arms and Light Weapons in Kosovo . 10 . Pristina , United Nations Interim Administration Mission in Kosovo and Geneva , Switzerland : Small Arms Survey : 4– 6. JSTOR resrep10739.9 . Archived from the original (PDF) on 30 June 2022. Retrieved 3 March 2023 . Kosovo—while still formally part of the so-called State Union of Serbia and Montenegro dominated by Serbia —has, since the war, been a United Nations protectorate under the United Nations Interim Administration Mission in Kosovo (UNMIK). [...] However, members of the Serb minority of the territory (circa 6–7 per cent in 2000) have, for the most part, not been able to return to their homes. For security reasons, the remaining Serb enclaves are, in part, isolated from the rest of Kosovo and protected by the multinational NATO -led Kosovo Force (KFOR). 1 2 "The preliminary data of the Census of Population, Family Economies and Housing in Kosovo are published – Zyra e Kryeministrit" . Office of the Prime Minister of Kosovo . Kosovo Agency of Statistics . 12 July 2024. Retrieved 1 December 2024 . ↑ "Agjencia e Statistikave të Kosovës -" . Esk.rks-gov.net . Archived from the original on 25 November 2013. Retrieved 1 December 2024 . 1 2 "Regjistrimi i popullsisë, ekonomive familjare dhe banesave në Kosovë 2024 - Popullsia sipas gjinisë, etnicitetit dhe vendbanimit" [ Population, Household Economies, and Housing Census in Kosovo 2024 - Population by Gender, Ethnicity, and Place of Residence] (PDF) (in Albanian). Pristina: Kosovo Agency of Statistics . July 2025. Retrieved 18 July 2025 . ↑ Kosovo's Birth Rate Falling but Still High . BalkanInsight . 10 July 2008. Retrieved 18 August 2018. ↑ "Comparative overview of the number of population in 1948, 1953, 1961, 1971, 1981, 1991, 2002, 2011. and 2022" . Statistical Office of the Republic of Serbia . ↑ "Kosovo: Districts, Major Cities & Settlements" . citypopulation.de . ↑ "Agjencia e Statistikave të Kosovës" . Esk.rks-gov.net . Archived from the original on 2 November 2013. Retrieved 1 December 2024 . 1 2 "ECMI: Minority figures in Kosovo census to be used with reservations" . Infoecmi.eu . Archived from the original on 28 May 2017. Retrieved 29 August 2017 . 1 2 3 "Agjencia e Statistikave të Kosovës -" . esk.rks-gov.net . Archived from the original on 2 November 2013. Retrieved 29 August 2017 . ↑ "Kosovo agency of statistics/Figures/Population" . ask.rks-gov.net . Archived from the original on 18 September 2015. Retrieved 9 January 2020 . ↑ "Eurostat database" . ec.europa.eu . ↑ "Kosovo Agency of Statistics" . ask.rks-gov.net . Archived from the original on 28 September 2021. Retrieved 17 May 2021 . ↑ "Demographic changes of the Kosovo population 1948–2006" (PDF) . ask.rks-gov.net . Archived from the original (PDF) on 25 August 2021. Retrieved 14 March 2020 . ↑ "Statistical Yearbook of the Republic of Kosovo, 2019" (PDF) . ask.rks-gov.net . Archived from the original (PDF) on 24 August 2021. Retrieved 9 January 2020 . ↑ "Birth Statistics in Kosovo, 2019" . ask.rks-gov.net . 12 June 2020. Archived from the original on 5 August 2020. Retrieved 25 June 2020 . ↑ "Death Statistics in Kosovo, 2019" . ask.rks-gov.net . 25 June 2020. Archived from the original on 27 January 2021. Retrieved 25 June 2020 . ↑ "Birth Statistics in Kosovo, 2020" (PDF) . ask.rks-gov.net . Archived from the original (PDF) on 18 December 2021. Retrieved 18 December 2021 . ↑ "Death Statistics in Kosovo, 2020" (PDF) . ask.rks-gov.net . Archived from the original (PDF) on 18 December 2021. Retrieved 18 December 2021 . ↑ "Birth Statistics in Kosovo, 2021" (PDF) . ask.rks-gov.net . Archived from the original (PDF) on 30 June 2022. Retrieved 30 June 2022 . ↑ "Death Statistics in Kosovo, 2021" (PDF) . ask.rks-gov.net . Archived from the original (PDF) on 6 August 2022. Retrieved 30 June 2022 . ↑ "Quarterly Bulletin" . ask.rks-gov.net . Archived from the original on 29 January 2020. Retrieved 8 January 2020 . ↑ "Monthly Bulletin" . ask.rks-gov.net . Archived from the original on 11 April 2021. Retrieved 19 March 2021 . ↑ "Births by the place where the birth took place and the permanent place of the mother in the municipality" . askdata.rks-gov.net . [ permanent dead link ] ↑ "Deaths by place of death and place of permanents residence in the municipality" . askdata.rks-gov.net . [ permanent dead link ] ↑ "CIA- The World Factbook" . Cia.gov . Archived from the original on 27 September 2011. Retrieved 24 February 2013 . ↑ "People on Move, pg.20" . Esk.rks-gov.net . Archived from the original on 10 April 2013. Retrieved 24 February 2013 . ↑ "OSCE Leposavic estimates" . OSCE. Archived from the original on 4 March 2016. ↑ "OSCE Mitrovica North estimate" . OSCE. Archived from the original on 4 March 2016. ↑ "OSCE Zubin Potok estimate" . OSCE. Archived from the original on 4 March 2016. ↑ "OSCE Zvecan estimates" . OSCE. Archived from the original on 4 March 2016. ↑ "BBC News – World – Kosovo Albanians: Who's left?" . News.bbc.co.uk . Archived from the original on 22 December 2006. Retrieved 29 August 2017 . ↑ "Coordination Centre of Federal Republic of Yugoslavia and Republic of Serbia for Kosovo and Metohija" . Archived from the original on 27 April 2012. Retrieved 23 February 2008 . ↑ UNHCR : 2002 Annual Statistical Report: Serbia and Montenegro, p. 9 ↑ "USCR: Country Information: Yugoslavia" . 29 October 2004. Archived from the original on 29 October 2004. Retrieved 29 August 2017 . ↑ "Language in Kosovo" . Kosovo Agency of Statistics. Archived from the original on 17 February 2015. ↑ "Health 2009" . Esk.rks-gov.net . Archived from the original on 2 November 2013. Retrieved 24 February 2013 . ↑ Perritt, Henry H. Jr. (28 September 2009). The Road to Independence for Kosovo: A Chronicle of the Ahtisaari Plan ISBN 9781139479431 – via Google Books. ↑ Naamat, Talia; Porat, Dina; Osin, Nina (19 July 2012). Legislating for Equality: A Multinational Collection of Non-Discrimination Norms. Volume I: Europe ISBN 978-9004226128 – via Google Books. ↑ Perparim Isufi (14 September 2017). "Kosovo Police Stop 'Illegal' Serb Census Attempts" . Balkan Insight . Retrieved 17 December 2017 . ↑ Çollaku, Petrit (29 March 2011). "Kosovo Census to Start Without the North" . Balkan Insight . Retrieved 1 December 2024 . 1 2 "Kosovo (unrecognized state)" . Minority Rights Group. March 2018. Retrieved 1 December 2024 . ↑ "Kosovo Population and Housing Census 2011 – Final Results: Quality Report" . unstats.un.org . United Nations Statistics Division . 2011. Archived from the original on 2 November 2016. Retrieved 17 December 2017 . ↑ Alexe, Dan (1 December 2010). "The influence of Sufi Islam in the Balkans" . Euobserver . Archived from the original on 10 October 2017. Retrieved 1 December 2024 . ↑ "The World: Net Migrants per 1000 (2015)" . GEOBA.se. Archived from the original on 29 August 2017. Retrieved 29 August 2017 . External links
Sovereign states States with limited Dependencies and Other entities
Sovereign states States with limited Dependencies and Other entities
This page is based on this
Wikipedia article Text is available under the
CC BY-SA 4.0 license; additional terms may apply.
Images, videos and audio are available under their respective licenses.