The demographic characteristics of the population of Croatia are known through censuses, normally conducted in ten-year intervals and analysed by various statistical bureaus since the 1850s. The Croatian Bureau of Statistics has performed this task since the 1990s. The latest census in Croatia was performed in autumn of 2021. According to final results published on 22 September 2022 the permanent population of Croatia at the 2021 census (31st Aug) stood at 3.87million. The population density is 68.7 inhabitants per square kilometre, and the overall life expectancy in Croatia at birth was 78,2 years in 2018.[3] The population rose steadily (with the exception of censuses taken following the two world wars) from 2.1million in 1857 until 1991, when it peaked at 4.7million. Since 1991, Croatia's death rate has continuously exceeded its birth rate; the natural growth rate of the population is negative. This population drop is also caused by emigration rates. Because of this, Croatia's population fell below 4 million again in 2018, and the apex of its mass emigration occurred in 2022, while population didn't increase again until 2023 due to immigration compensating for the negative natural change. Croatia is in the fourth (or fifth) stage of the demographic transition. In terms of age structure, the population is dominated by the 15 to 64 year‑old segment. The median age of the population is 43.4, and the gender ratio of the total population is 0.93 males per 1 female.
Croatia is inhabited mostly by Croats (91.63%), while minorities include Serbs (3.2%), and 21 other ethnicities (less than 1% each). The demographic history of Croatia is marked by significant migrations, including the arrival of the Croats in the area growth of Hungarian and German-speaking population since the union of Croatia and Hungary, and joining of the Habsburg Empire, migrations set off by Ottoman conquests and growth of Italian speaking population in Istria and in Dalmatia during Venetian rule there. After the collapse of Austria-Hungary, the Hungarian population declined, while the German-speaking population was forced or compelled to leave after World War II and similar fate was suffered by the Italian population. Late 19th century and the 20th century were marked by large scale economic migrations abroad. The 1940s and the 1950s in Yugoslavia were marked by internal migrations in Yugoslavia, as well as by urbanisation. Recently, significant migrations came as a result of the Croatian War of Independence when hundreds of thousands were displaced, while the 2010s brought a new wave of emigration which strengthened after Croatia's accession to the EU in 2013.
Croatian is the official language, but minority languages are officially used in some local government units. Croatian is declared as the native language by 95.60% of the population. A 2009 survey revealed that 78% of Croatians claim knowledge of at least one foreign language—most often English. The main religions of Croatia are Roman Catholic (86.28%), Eastern Orthodoxy (4.44%) and Islam (1.47%). Literacy in Croatia stands at 98.1%. The proportion of the population aged 15 and over attaining academic degrees grew rapidly since 2001, doubling and reaching 16.7% by 2008. An estimated 4.5% of the GDP is spent for education. Primary and secondary education are available in Croatian and in languages of recognised minorities. Croatia has a universal health care system and in 2010, the nation spent 6.9% of its GDP on healthcare. Net monthly income in August 2023 averaged 1,163 euro. The most significant sources of employment in 2023 were manufacturing industry, wholesale and retail trade and construction. In August 2023, the unemployment rate was 6.9%. Croatia's median equivalent household income tops average Purchasing Power Standard of the ten countries which joined the EU in 2004, while trailing the EU average. 2011 census recorded a total of 1.5million private households, which predominantly owned their own housing. The average urbanisation rate in Croatia stands at 56%, with an augmentation of the urban population and a reduction of the rural population.
The total fertility rate of 1.50 children per mother is one of the lowest in the world. Since 1991, Croatia's death rate has nearly continuously exceeded its birth rate.[5] The Croatian Bureau of Statistics forecast that the population may even shrink to 3.1million by 2051, depending on the actual birth rate and the level of net migration.[6] The population of Croatia rose steadily from 2.1million in 1857 until 1991, when it peaked at 4.7million, with the exception of censuses taken in 1921 and 1948, i.e. following two world wars.[7] The natural growth rate of the population is negative.[8][9] Croatia started advancing from the first stage of the demographic transition in the late 18th and early 19th centuries (depending on where in Croatia is being discussed).[10] Croatia is in the fourth or fifth stage of the demographic transition.[11]
An explanation for the population decrease in the 1990s is the Croatian War of Independence. During the war, large sections of the population were displaced and emigration increased. In 1991, in predominantly Serb areas, more than 400,000 Croats and other non-Serbs were either removed from their homes by the Croatian Serb forces or fled the violence.[12] In 1995, during the final days of the war, more than 120,000 and perhaps as many as 200,000 Serbs fled the country before the arrival of Croatian forces during Operation Storm.[13][14] Within a decade following the end of the war, only 117,000 Serb refugees returned out of the 300,000 displaced during the entire war.[15] According to 2001 Croatian census there were 201,631 Serbs in Croatia, compared to the census from 1991 when the number was 581,663.[16][17] Most of Croatia's remaining Serbs never lived in areas occupied in the Croatian War of Independence. Serbs have been only partially re-settled in the regions they previously inhabited, while some of the settlements previously inhabited by Serbs were settled by Croat refugees from Bosnia and Herzegovina, mostly from Republika Srpska.[18][19]
In 2014, there were 39,566 live births in Croatia, comprising 20,374 male and 19,192 female children. Virtually all of those were performed in medical facilities; only 19 births occurred elsewhere. Out of the total number, 32,677 children were born in wedlock or within 300days after the end of the marriage, and the average age of mothers at the birth of their first child was 28.4 years.[20] General fertility rate, i.e. number of births per 1,000 women aged 15–49 is 42.9, with the age specific rate peaking at 101.0 per million for women aged 25–29. In 2009, 52,414 persons died in Croatia, 48.5% of whom died in medical facilities and 90.0% of whom were receiving medical treatment at the time. Cardiovascular disease and cancer were the primary causes of death in the country, with 26,235 and 13,280 deaths respectively. In the same year, there were 2,986 violent deaths, including 2,121 due to accidents. The latter figure includes 616 deaths in traffic accidents.[7] In 2014, the birth rate was 9.3 per mille, exceeded by the mortality rate of 12.0 per mille. The infant mortality rate was 5.0 per mille in 2014.[5] In terms of age structure, the population of Croatia is dominated by the 15–64year older segment (68.1%), while the size of the population younger than 15 and older than 64 is relatively small (15.1% and 16.9% respectively). The median age of the population is 41.4. The sex ratio of the population is 1.06 males per 1 female at birth and up to 14 years of age, and 0.99 males per 1 female between the ages of 15 and 64. But at ages over 64 the ratio is 0.64 males per 1 female. The ratio for the total population is 0.93 males per 1 female.[9]
In contrast to the shrinking native population, since the late 1990s there has been a positive net migration into Croatia, reaching a level of more than 7,000 net immigrants in 2006.[21] In accordance with its immigration policy, Croatia is also trying to entice emigrants to return.[22]Croatian citizenship is acquired in a multitude of ways, based on origin, place of birth, naturalization and international treaties.[23] In recent years, the Croatian government has been pressured each year to add 40% to work permit quotas for foreign workers.[24]
There were 8,468 immigrants to Croatia in 2009, more than half of them (57.5%) coming from Bosnia and Herzegovina, a sharp decline from the previous year's 14,541. In the same year, there were 9,940 emigrants from the country, 44.8% of them leaving to Serbia. The number of emigrants represents a substantial increase compared to the figure of 7,488 recorded in 2008. In 2009, the net migration to and from abroad peaked in the Sisak-Moslavina County (−1,093 persons) and the city of Zagreb (+830 persons).
In 2009, a total of 22,382 marriages were performed in Croatia as well as 5,076 divorces. The 2001 census recorded 1.47million households in the country.[7]
The first modern population census in the country was conducted in 1857, and 15 more have been performed since then. Since 1961 the censuses are conducted in regular ten-year intervals, with the latest one in 2011.[7][25] The first institution set up in the country specifically for the purposes of maintaining population statistics was the State Statistical Office, founded in 1875. Since its founding, the office changed its name and structure several times and was alternately subordinated to other institutions and independent, until the most recent changes in 1992, when the institution became the Croatian Bureau of Statistics.[26] The 2011 census was performed on 1–28 April 2011, recording situation as of 31 March 2011.[27] The first census results, containing the number of the population by settlement, were published on 29 June 2011,[28] and the final comprehensive set of data was published in December 2012.[29] The 2011 census and processing of the data gathered by the census was expected to cost 171.9million kuna (23.3million euro).[27] The 2011 census was performed using new methodology: the permanent population was determined as the enumerated population who lived in the census area for at least 12 months prior to the census, or plans to live in the same area for at least 12 months after the census. This method was also retroactively applied to the 2001 census data.[7][25]
Year
Enumerated population
Permanent population
Average annual growth rate
Population density per km2
1857
2,181,499
—N/a
-
38.5
1869
2,398,292
—N/a
0.83%
42.4
1880
2,506,228
—N/a
0.41%
44.3
1890
2,854,558
—N/a
1.39%
50.4
1900
3,161,456
—N/a
1.08%
55.9
1910
3,460,584
—N/a
0.95%
61.1
1921
3,443,375
—N/a
-0.05%
60.8
1931
3,785,455
—N/a
0.99%
66.9
1948
3,779,858
—N/a
-0.01%
66.8
1953
3,936,022
—N/a
0.83%
69.5
1961
4,159,696
—N/a
0.71%
73.5
1971
4,426,221
—N/a
0.64%
78.2
1981
4,601,469
—N/a
0.40%
81.3
1991
4,784,265
—N/a
0.40%
84.5
2001
4,492,049
4,437,460
-0.72%
78.4
2011
4,456,096
4,284,889
-0.34%
75.7
2021
3,937,024
3,871,833
-0.96%
68.4
Source: Croatian Bureau of Statistics[7][25] Note: From 2001 population density is calculated using the permanent population figure.
Population by Sex and Age Group (Census 01.IV.2011):[38]
Age Group
Male
Female
Total
%
Total
2 066 335
2 218 554
4 284 889
100
0–4
109 251
103 458
212 709
4.96
5–9
104 841
99 476
204 317
4.77
10–14
120 633
114 769
235 402
5.49
15–19
124 918
119 259
244 177
5.70
20–24
133 455
128 203
261 658
6.11
25–29
147 416
141 650
289 066
6.75
30–34
149 998
144 621
294 619
6.88
35–39
143 984
140 770
284 754
6.65
40–44
143 603
143 330
286 933
6.70
45–49
152 446
155 115
307 561
7.18
50–54
157 981
162 521
320 502
7.48
55–59
153 750
158 068
311 818
7.28
60–64
127 851
144 889
272 740
6.37
65–69
89 364
112 638
202 002
4.71
70–74
88 912
123 489
212 401
4.96
75–79
66 456
109 070
175 526
4.10
80–84
35 999
72 105
108 104
2.52
85–89
12 415
35 226
47 641
1.11
90–94
2 580
8 178
10 758
0.25
95–99
446
1 557
2 003
0.05
100+
36
162
198
<0.01
Age group
Male
Female
Total
Percent
0–14
334 725
317 703
652 428
15.23
15–64
1 435 402
1 438 426
2 873 828
67.07
65+
296 208
462 425
758 633
17.70
Population Estimates by Sex and Age Group (01.I.2021):[38]
Age Group
Male
Female
Total
%
Total
1 964 930
2 071 425
4 036 355
100
0–4
93 094
88 456
181 550
4.50
5–9
98 610
92 382
190 992
4.73
10–14
103 861
98 484
202 345
5.01
15–19
100 760
95 080
195 840
4.85
20–24
121 362
111 639
233 001
5.77
25–29
124 266
113 882
238 148
5.90
30–34
129 589
120 925
250 514
6.21
35–39
142 764
134 641
277 405
6.87
40–44
143 900
136 684
280 584
6.95
45–49
137 002
132 354
269 356
6.67
50–54
135 156
136 496
271 652
6.73
55–59
139 894
147 579
287 473
7.12
60–64
139 203
153 445
292 648
7.25
65–69
126 789
144 282
271 071
6.72
70–74
94 333
124 596
218 929
5.42
75–79
59 495
91 040
150 535
3.73
80–84
46 485
82 214
128 699
3.19
85–89
21 993
48 425
70 418
1.74
90–94
5 737
15 973
21 710
0.54
95–99
619
2 734
3 353
0.08
100+
18
114
132
<0.01
Age group
Male
Female
Total
Percent
0–14
295 565
279 322
574 887
14.24
15–64
1 313 896
1 282 725
2 596 621
64.33
65+
355 469
509 378
864 847
21.43
Marriages and divorces
Average population
Marriages
Divorces
Crude marriage rate (per 1000)
Crude divorce rate (per 1000)
Divorces per 1000 marriages
1950
3,850,991
38,163
3,137
9.9
0.8
82.2
1951
3,881,986
35,079
2,947
9.0
0.8
84.0
1952
3,912,983
39,492
3,175
10.1
0.8
80.4
1953
3,945,997
37,022
3,924
9.4
1.0
106.0
1954
3,978,125
40,715
3,854
10.2
1.0
94.7
1955
4,013,015
39,219
4,499
9.8
1.1
114.7
1956
4,039,992
38,677
4,419
9.6
1.1
114.3
1957
4,067,005
36,627
4,746
9.0
1.2
129.6
1958
4,088,987
37,359
5,272
9.1
1.3
141.1
1959
4,114,979
36,651
5,053
8.9
1.2
137.9
1960
4,140,181
36,761
4,811
8.9
1.2
130.9
1961
4,167,292
36,634
5,057
8.8
1.2
138.0
1962
4,196,712
36,149
4,883
8.6
1.2
135.1
1963
4,225,675
33,976
5,114
8.0
1.2
150.5
1964
4,252,876
35,965
5,217
8.5
1.2
145.1
1965
4,280,923
38,474
5,663
9.0
1.3
147.2
1966
4,310,701
36,896
5,390
8.6
1.3
146.1
1967
4,338,683
35,815
4,861
8.3
1.1
135.7
1968
4,365,628
35,447
4,891
8.1
1.1
138.0
1969
4,391,490
35,466
5,474
8.1
1.2
154.3
1970
4,412,252
37,319
5,333
8.5
1.2
142.9
1971
4,431,275
37,701
5,427
8.5
1.2
143.9
1972
4,450,564
37,779
5,567
8.5
1.3
147.4
1973
4,470,161
36,967
5,781
8.3
1.3
156.4
1974
4,490,660
36,034
6,331
8.0
1.4
175.7
1975
4,512,082
36,290
5,928
8.0
1.3
163.4
1976
4,535,934
35,019
6,099
7.7
1.3
174.2
1977
4,559,571
35,524
5,511
7.8
1.2
155.1
1978
4,581,085
35,629
5,959
7.8
1.3
167.3
1979
4,594,778
34,041
5,036
7.4
1.1
147.9
1980
4,599,782
33,310
5,342
7.2
1.2
160.4
1981
4,611,509
33,855
5,704
7.3
1.2
168.5
1982
4,634,234
33,143
5,355
7.2
1.2
161.6
1983
4,658,254
33,135
5,263
7.1
1.1
158.8
1984
4,680,285
32,161
5,295
6.9
1.1
164.6
1985
4,701,417
30,953
5,375
6.6
1.1
173.7
1986
4,721,446
30,495
5,946
6.5
1.3
195.0
1987
4,739,745
31,395
5,577
6.6
1.2
177.6
1988
4,755,207
29,719
5,647
6.2
1.2
190.0
1989
4,767,260
28,938
5,369
6.1
1.1
185.5
1990
4,777,368
27,924
5,466
5.8
1.1
195.7
1991
4,733,938
21,583
4,877
4.6
1.0
226.0
1992
4,690,509
22,169
3,676
4.7
0.8
165.8
1993
4,647,079
23,021
4,667
5.0
1.0
202.7
1994
4,603,649
23,966
4,630
5.2
1.0
193.2
1995
4,560,220
24,385
4,236
5.3
0.9
173.7
1996
4,516,790
24,596
3,612
5.4
0.8
146.9
1997
4,473,361
24,517
3,899
5.5
0.9
159.0
1998
4,429,931
24,243
3,962
5.5
0.9
163.4
1999
4,386,501
23,778
3,721
5.4
0.8
156.5
2000
4,343,072
22,017
4,419
5.1
1.0
200.7
2001
4,299,642
22,076
4,670
5.1
1.1
211.5
2002
4,302,174
22,806
4,496
5.3
1.0
197.1
2003
4,303,399
22,337
4,934
5.2
1.1
220.9
2004
4,304,600
22,700
4,985
5.3
1.2
219.6
2005
4,310,145
22,138
4,883
5.1
1.1
220.6
2006
4,311,159
22,092
4,651
5.1
1.1
210.5
2007
4,310,217
23,140
4,785
5.4
1.1
206.8
2008
4,309,705
23,373
5,025
5.4
1.2
215.0
2009
4,305,181
22,382
5,076
5.2
1.2
226.8
2010
4,295,427
21,294
5,058
5.0
1.2
237.5
2011
4,280,622
20,211
5,662
4.7
1.3
280.1
2012
4,260,368
20,323
5,659
4.8
1.3
278.5
2013
4,233,922
19,169
5,992
4.5
1.4
312.6
2014
4,201,598
19,501
6,570
4.6
1.6
336.9
2015
4,151,725
19,834
6,010
4.7
1.4
303.0
2016
4,106,867
20,467
7,036
4.9
1.7
343.8
2017
4,041,407
20,310
6,265
4.9
1.5
308.5
2018
3,988,775
19,921
6,125
4.9
1.5
307.5
2019
3,949,390
19,761
5,936
5.0
1.5
300.4
2020
3,914,206
15,196
5,153
3.9
1.3
339.1
2021
3,878,981
18,203
5,100
4.7
1.3
280.2
2022
3,855,641
18,074
4,808
4.7
1.3
266.0
2023
3,859,686
17,306
4,407
4.5
1.1
254.7
2024
3,866,233
17,206
4,961
4.5
1.3
288.3
Ethnic groups
Ethnic structure of Croatia in 2021.Municipalities and cities in Croatia per percentage of residents declaring ethnicity other than Croat in 2021 census (including undeclared and unknown).
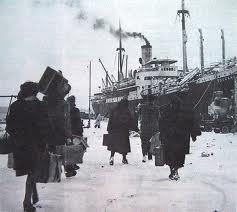
A 1930s ad for shipping lines to South AmericaState Office for Croats Abroad in Zagreb
The demographic history of Croatia is characterised by significant migrations, starting with the arrival of the Croats in the area. According to the work De Administrando Imperio written by the 10th-century Byzantine Emperor Constantine VII, the Croats arrived in the area of modern-day Croatia in the early 7th century. However, that claim is disputed, and competing hypotheses date the event between the 6th and the 9th centuries.[43] Following the establishment of a personal union of Croatia and Hungary in 1102,[44] and the joining of the Habsburg Empire in 1527,[45] the Hungarian and German-speaking population of Croatia began gradually increasing in number. The processes of Magyarization and Germanization varied in intensity but persisted to the 20th century.[46][47] The increased military activity and Orthodox refugee populations from Bosnia and Serbia initiated by Ottoman conquests also caused a westward migration of parts of the Croatian population;[48] the Burgenland Croats are direct descendants of some of those settlers.[49] Serb migration into this region peaked during the Great Serb Migrations of 1690 and 1737–39.[50] Similarly, Venetian Republic rule in Istria and in Dalmatia, following the Fifth and the Seventh Ottoman–Venetian Wars ushered gradual growth of Italian speaking population in those areas.[51] Following the collapse of Austria-Hungary in 1918, the Hungarian population declined, especially in the areas north of the Drava river, where they represented the majority before World War I.[52]
The period between 1890 and World War I was marked by large economic emigration from Croatia to the United States, and particularly to the areas of Pittsburgh, Pennsylvania, Cleveland, Ohio, and Chicago, Illinois. Besides the United States, the main destination of the migrants was South America, especially Argentina, Chile, Bolivia and Peru. It is estimated that 500,000 people left Croatia during this period. After World War I, the main focus of emigration shifted to Canada, where about 15,000 people settled before the onset of World War II.[53][54] During World War II and in the period immediately following the war, there were further significant demographic changes as the German-speaking population, the Volksdeutsche, were either forced or otherwise compelled to leave—reducing their number from the prewar German population of Yugoslavia of 500,000, living in parts of present-day Croatia and Serbia, to the figure of 62,000 recorded in the 1953 census.[55]
Austrian linguistic map from 1896. In green the areas where Slavs were the majority of the population, in orange the areas where Istrian Italians and Dalmatian Italians were the majority of the population. The boundaries of Venetian Dalmatia in 1797 are delimited with blue dots.Istrian Italians leave Pola in 1947 during the Istrian-Dalmatian exodus.
After the fall of Napoleon (1814), Istria, Kvarner and Dalmatia were annexed to the Austrian Empire.[56] Many Istrian Italians and Dalmatian Italians looked with sympathy towards the Risorgimento movement that fought for the unification of Italy.[57] However, after the Third Italian War of Independence (1866), when the Veneto and Friuli regions were ceded by the Austrians to the newly formed Kingdom Italy, Istria and Dalmatia remained part of the Austro-Hungarian Empire, together with other Italian-speaking areas on the eastern Adriatic. This triggered the gradual rise of Italian irredentism among many Italians in Istria, Kvarner and Dalmatia, who demanded the unification of the Julian March, Kvarner and Dalmatia with Italy. Moreover, as Italian was the language of administration, education, the press, and the Austrian navy before 1859, people who wished to acquire higher social standing and separate from the Slav peasantry became Italians.[58] In the years after 1866, Italians lost their privileges in Austria-Hungary, their assimilation of the Slavs came to an end, and they found themselves under growing pressure by other rising nations; with the rising Slav tide after 1890, italianized Slavs reverted to being Croats.[58] Austrian rulers found use of the racial antagonism and financed Slav schools and promoted Croatian as the official language, and many Italians chose voluntary exile.[58] Austrians carried out an aggressive anti-Italian policy.[59]
Istrian Italians made up about a third of the population in Istria in 1900.[60] The Italian-speaking population in Dalmatia, comprising 12.5% of the total population in 1865,[61] was concentrated in the major coastal cities. In the city of Split in 1890 there were 1,971 Dalmatian Italians (9% of the population), in Zadar 7,672 (27%), in Šibenik 1,090 (5%), in Kotor 646 (12%) and in Dubrovnik 356 (3%).[62] In the 1910 Austro-Hungarian census, Istria had a population of 57.8% Slavic-speakers (Croat and Slovene), and 38.1% Italian speakers.[63] For the Austrian Kingdom of Dalmatia, (i.e. Dalmatia), the 1910 numbers were 96.2% Slavic speakers and 2.8% Italian speakers.[64] In Rijeka the Italians were the relative majority in the municipality (48.61% in 1910), and in addition to the large Croatian community (25.95% in the same year), there was also a fair Hungarian minority (13.03%). According to the official Croatian census of 2011, there are 2,445 Italians in Rijeka (equal to 1.9% of the total population).[65]
The 1947 Treaty of Peace with Italy provided for the right of option of Italian citizens living in the territories that were to be taken over by Greece, France, and Yugoslavia to remain Italian citizens, provided the possibility of request by those states that they moved out of the area within a year; it granted a similar right of option to Italian citizens who habitually spoke "one of the Yugoslav languages (Serbian, Croatian or Slovene)" and who lived in Italian territory.[66][67] Some 300,000 inhabitants of the taken-over areas—predominantly ethnic Italians, but also tens of thousands of Croats and Slovenes—eventually left,[68] in what was later called the Istrian–Dalmatian exodus. The emigrants, who had lived in the now Yugoslav territories of the Julian March (Karst Region and Istria), Kvarner and Dalmatia, largely went to Italy, but some joined the Italian diaspora in the Americas, Australia and South Africa.[69][70]
According to the census organized in Croatia in 2001 and that organized in Slovenia in 2002, there were 2,258 Italians in Slovenia and 19,636 in Croatia.[71][72] Since the dissolution of Yugoslavia, a significant portion of the population of Istria opted for a regional declaration in the census instead of a national one. As such, more people have Italian as a first language than those having declared Italian. In 2001, about 500 Dalmatian Italians were counted in Dalmatia. In particular, according to the official Croatian census of 2011, there are 83 Dalmatian Italians in Split (equal to 0.05% of the total population), 16 in Šibenik (0.03%) and 27 in Dubrovnik (0.06%).[73] According to the official Croatian census of 2021, there are 63 Dalmatian Italians in Zadar (equal to 0.09% of the total population).[74] According to the official Montenegrin census of 2011, there are 31 Dalmatian Italians in Kotor (equal to 0.14% of the total population).[75]
The 1940s and the 1950s in Yugoslavia were marked by colonisation of settlements where the displaced Germans used to live by people from the mountainous parts of Bosnia and Herzegovina, Serbia and Montenegro, and migrations to larger cities spurred on by the development of industry.[76][failed verification] In the 1960s and 1970s, another wave of economic migrants left Croatia. They largely moved to Canada, Australia, New Zealand and Western Europe. During this period, 65,000 people left for Canada,[54] and by the mid-1970s there were 150,000 Croats who moved to Australia.[77] Particularly large European emigrant communities of Croats exist in Germany, Austria and Switzerland, which largely stem from the 1960s and 1970s migrations.[78]
A series of significant migrations came as a result of the 1991–1995 Croatian War of Independence. In 1991, more than 100,000 Croats and other non-Serbs were displaced by the Croatian Serb forces or fled the violence in areas with significant Serb populations.[12] During the final days of the war, in 1995, between 200,000[13] and 250,000 Serbs[14] fled the country following the Operation Storm. Ten years after the war, only a small portion of Serb refugees returned out of the 400,000 displaced during the entire war.[15] Most of the Serbs in Croatia who remained never lived in areas occupied during the Croatian War of Independence. Serbs have been only partially re-settled in the regions they previously inhabited; some of these areas were later settled by Croat refugees from Bosnia and Herzegovina.[18][19]
Significant migrations have been happening after the accession of Croatia to the European Union, with a persistent growth since 2013, and the population leaving is largely younger and more educated.[79]
Demographic losses in the 20th century wars and pandemics
In addition to demographic losses through significant migrations, the population of Croatia suffered significant losses due to wars and epidemics. In the 20th century alone, there were several such events. The first was World War I, when the loss of the population of Croatia amounted to an estimated 190,000 persons, or about 5.5% of the total population recorded by the 1910 census.[80] The 1918 flu pandemic started to take its toll in Croatia in July 1918, with peaks of the disease occurring in October and November. Available data is scarce, but it is estimated that the pandemic caused at least 15,000–20,000 deaths.[81] Around 295,000 people were killed on the territory of present-day Croatia during World War II, according to the demographer Bogoljub Kočović.[82] The demise of the armed forces of the Independent State of Croatia and of the civilians accompanying the troops at the end of World War II was followed by the Yugoslav death march of Nazi collaborators. A substantial number of people were executed, but the exact number is disputed. The claims range from 12,000 to 15,000 to as many as 80,000 killed in May 1945.[83][84] Finally, approximately 20,000 were killed or went missing during the 1991–1995 Croatian War of Independence. The figure pertains only to those persons who would have been recorded by the 1991 census as living in Croatia.[85][86]
Migration
International migration data of Croatia, 2014–present
65 years and over: 19.91% (male 342,025 /female 508,184) (2018 est.)
Median age
total: 44.4 years
male: 42.6 years
female: 46.1 years (2018 est.)
Birth rate
8.3 births/1,000 population (2023 est.)
Death rate
13.3 deaths/1,000 population (2023 est.)
Total fertility rate
1.53 children born/woman (2023 est.)
Net migration rate
-1.4 migrant(s)/1,000 population (2018 est.) Country comparison to the world: 150th
Population growth rate
-0.51% (2018 est.) Country comparison to the world: 221st
Mother's mean age at first birth
28 years (2014 est.)
Life expectancy at birth
total population: 76.3 years (2018 est.) Country comparison to the world: 87th
male: 73.2 years (2018 est.)
female: 79.6 years (2018 est.)
Ethnic groups
Croat 90.4%, Serb 4.4%, other 4.4% (including Bosniak, Hungarian, Slovene, Czech, and Romani), unspecified 0.8% (2011 est.)
Languages
Croatian (official) 95.6%, Serbian 1.2%, other 3% (including Hungarian, Czech, Slovak, and Albanian), unspecified 0.2% (2011 est.)
Religions
Roman Catholic 86.3%, Orthodox 4.4%, Muslim 1.5%, other 1.5%, unspecified 2.5%, not religious or atheist 3.8% (2011 est.)
Nationality
noun: Croat(s), Croatian(s)
adjective: Croatian
note: the French designation of "Croate" to Croatian mercenaries in the 17th century eventually became "Cravate" and later came to be applied to the soldiers' scarves – the cravat; Croatia celebrates Cravat Day every 18 October
Croatian is the official language of Croatia, and one of 24 official languages of the European Union since 2013.[40][90]Minority languages are in official use in local government units where more than a third of the population consists of national minorities or where local legislation mandates their use. These languages are Czech, German, Hungarian, Italian, Ruthenian, Serbian, Slovene, and Slovak.[91][92] Besides these, the following languages are also recognised: Albanian, Bosnian, Bulgarian, German, Hebrew, Macedonian, Montenegrin, Polish, Romanian, Romani, Russian, Rusyn, Slovenian, Turkish and Ukrainian.[92] According to the 2021 Census, 95.25% of citizens of Croatia declared Croatian as their native language, 1.16% declared Serbian as their native language, while no other language is represented in Croatia by more than 0.5% of native speakers among the population of Croatia.[93]
In the region of Dalmatia, each city historically spoke a variant of the Dalmatian language. It developed from Latin like all Romance languages, but became heavily influenced by Venetian and Croatian. The language fell out of use in the region by the 16th century and went extinct when the last speaker died in 1898.
From 1961 to 1991, the official language was formally designated as Serbo-Croatian or Croato-Serbian. Even during socialist rule, Croats often referred to their language as Croato-Serbian (instead of Serbo-Croatian) or as Croatian.[96] Croatian and Serbian variants of the language were not officially recognised as separate at the time, but referred to as the "West" and "East" versions, and preferred different alphabets: the Gaj's Latin alphabet and Karadžić's Cyrillic alphabet.[95] Croats are protective of their language from foreign influences, as the language was under constant change and threats imposed by previous rulers (i.e. Austrian German, Hungarian, Italian and Turkish words were changed and altered to "Slavic" looking/sounding ones).
A 2009 survey revealed that 78% of Croats claim knowledge of at least one foreign language.[97] According to a survey ordered by the European Commission in 2005, 49% of Croats speak English as their second language, 34% speak German, and 14% speak Italian. French and Russian are spoken by 4% each, and 2% of Croats speak Spanish. A substantial proportion of Slovenes (59%) have a certain level of knowledge of Croatian.[98]
The main religions of Croatia are Roman Catholicism 83.04%, no religion 6.39%, other Christianity 0.73%, undeclared 3.86%, Eastern Orthodoxy 3.35%, Islam 1.32%, Protestantism 0.26%, others 1.87%.[99] In the Eurostat Eurobarometer Poll of 2005, 67% of the population of Croatia responded that "they believe there is a God" and 7% said they do not believe "there is any sort of spirit, God, or life force", while 25% expressed a belief in "some sort of spirit or life force".[100] In a 2009 Gallup poll, 70% answered affirmatively when asked "Is religion an important part of your daily life?"[101] Significantly, a 2008 Gallup survey of the Balkans indicated church and religious organisations as the most trusted institutions in the country. The survey revealed that 62% of the respondents assigned "a lot" or "some" trust to those institutions, ranking them ahead of all types of governmental, international or non-governmental institutions.[102]
Public schools allow religious education, in cooperation with religious communities that have agreements with the government, but attendance is not mandatory. The classes are organized widely in public elementary and secondary schools. In 2009, 92% of elementary school pupils and 87% of secondary school students attended the religious education classes.[103]Public holidays in Croatia also include the religious festivals of Epiphany, Easter Monday, Feast of Corpus Christi, Assumption Day, All Saints' Day, Christmas, and St. Stephen's or Boxing Day. The religious festival public holidays are based on the Catholic liturgical year, but citizens of the Republic of Croatia who celebrate different religious holidays have the right not to work on those dates. This includes Christians who celebrate Christmas on 7 January per the Julian calendar, Muslims on the days of Eid al-Fitr and Eid al-Adha, and Jews on the days of Rosh Hashanah and Yom Kippur.[104]Marriages performed by the religious communities having agreements with the state are officially recognized, eliminating the need to register the marriages in a registrar office.[105]
The legal position of religious communities is defined by special legislation, specifically regarding government funding, tax benefits, and religious education in schools. Other matters are left to each religious community to negotiate separately with the government. Registration of the communities is not mandatory, but registered communities become legal persons and enjoy tax and other benefits. The law stipulates that to be eligible for registration, a religious group must have at least 500 believers and be registered as a civil association for 5 years. Religious groups based abroad must submit written permission for registration from their country of origin.[106]
Education completed by population of Croatia (over age of 14) according to 2001 census. The segment achieving academic degrees more than doubled by 2008.
Literacy in Croatia is 98.1 percent.[9] The 2001 census reported that 15.7% of the population over the age of 14 has an incomplete elementary education, and 21.9% has only an elementary school education. 42.8% of the population over the age of 14 has a vocational education and 4.9% completed gymnasium. 4.2% of the same population received an undergraduate degree, while 7.5% received an academic degree, and 0.5% received a postgraduate or a doctoral degree.[107] Croatia recorded a substantial growth of the population attaining academic degrees and by 2008, this population segment was estimated to encompass 16.7% of the total population of Croatians 15 and over.[108] A worldwide study about the quality of living in different countries published by Newsweek in August 2010 ranked the Croatian education system at 22nd, a position shared with Austria.[109] In 2004, it was estimated that 4.5% of the GDP is spent for education, while schooling expectancy was estimated to 14 years on average.[9] Primary education in Croatia starts at the age of six or seven and consists of eight grades. In 2007 a law was passed to increase free, noncompulsory education until 18 years of age. Compulsory education consists of eight grades of elementary school. Secondary education is provided by gymnasiums and vocational schools. As of 2010, there are 2,131 elementary schools and 713 schools providing various forms of secondary education. Primary and secondary education are also available in languages of recognised minorities in Croatia, where classes are held in Czech, Hungarian, Italian, Serbian and German languages.[7]
There are 84 elementary level and 47 secondary level music and art schools, as well as 92 schools for disabled children and youth and 74 schools for adults.[7] Nationwide leaving exams (Croatian: državna matura) were introduced for secondary education students in the 2009–2010 school year. It comprises three compulsory subjects (Croatian language, mathematics, and a foreign language) and optional subjects and is a prerequisite for a university education.[110]
There are 205 companies, government or education system institutions and non-profit organizations in Croatia pursuing scientific research and the development of technology. Combined, they spent more than 3billion kuna (400million euro) and employed 10,191 full-time research staff in 2008.[7] Among the scientific institutes operating in Croatia, the largest is the Ruđer Bošković Institute in Zagreb.[113] The Croatian Academy of Sciences and Arts in Zagreb is a learned society promoting language, culture, arts and science since its inception in 1866.[114] Scientists from Croatia include inventors and Nobel Prize winners.[115]
Croatia has a universal health care system, the roots of which can be traced back to the Hungarian-Croatian Parliament Act of 1891, providing a form of mandatory insurance for all factory workers and craftsmen.[116] The population is covered by a basic health insurance plan provided by statute and optional insurance. In 2014, the annual compulsory healthcare related expenditures reached 21.8billion kuna (2.9billion euro).[117] Healthcare expenditures comprise only 0.6% of private health insurance and public spending.[118] In 2010, Croatia spent 6.9% of its GDP on healthcare,[119] representing a decline from approximately 8% estimated in 2008, when 84% of healthcare spending came from public sources.[120] According to the World Health Organization (WHO), Croatia ranks around the 50th in the world in terms of life expectancy.[121]
There are hundreds of healthcare institutions in Croatia, including 79 hospitals and clinics with 23,967 beds. The hospitals and clinics care for more than 700thousand patients per year and employ 5,205 medical doctors, including 3,929 specialists. There are 6,379 private practice offices, and a total of 41,271health workers in the country. There are 63 emergency medical service units, responding to more than a million calls. The principal cause of death in 2008 was cardiovascular disease at 43.5% for men and 57.2% for women, followed by tumours, at 29.4% for men and 21.4% for women. Other significant causes of death are injuries, poisonings and other external causes (7.7% men/3.9% women), digestive system diseases (5.7% men/3.6% women), respiratory system diseases (5.1% men/3.5% women) and endocrine, nutritional and metabolic diseases (2.1% men/3.0% women). There is no other cause of disease affecting more than 3% of the population.[7] In 2014 only 22 Croatians had been infected with HIV/AIDS and 4 had died from the disease.[122] In 2008 it was estimated by the WHO that 27.4% of Croatians over age of 15 were smokers.[123] According to 2003 WHO data, 22% of the Croatian adult population is obese.[124]
Life expectancy in Croatia since 1950Life expectancy in Croatia since 1960 by gender
Net monthly income in September 2011 averaged 5,397 kuna (c. 729 euro), dropping 2.1% relative to the previous month. In the same month, gross monthly income averaged 7,740 kuna (c. 1,046 euro),[126] and it includes the net salary along with income tax, retirement pension insurance, healthcare insurance, occupational safety and health insurance and employment promotion tax.[127] The average net monthly income grew compared to 5,311 kuna (c. 717 euro) in 2009 or 3,326 kuna (c. 449 euro) in 2000.[7] The highest net salaries were paid in financial services sector, and in April 2011 those averaged 10,041 kuna (c. 1,356 euro), while the lowest ones, paid in the same month, were in the manufacturing and leather processing industries, averaging at 2,811 kuna (c. 380 euro).[128] Since January 2016, the minimum wage in Croatia is 3,120 kuna before tax (c. 400 euro).[129]
Number of employed persons recorded steady growth between 2000 and 2008 when it peaked, followed by 4% decline in 2009. That year, there were 1.499million employed persons, with 45% of that number pertaining to women. The total number of employed persons includes 252,000 employed in crafts and freelance professionals and 35,000 employed in agriculture. The most significant sources of employment in 2008 were manufacturing industry and wholesale and retail trade (including motor vehicle repair services) employing 278,640 and 243,640 respectively. Further significant employment sector was construction industry comprising 143,336 jobs that year. In the same year, more than 100,000 were employed in public administration, defence and compulsory social insurance sector as well as in education. Since 2009, negative trends persisted in Croatia with jobs in the industry declined further by 3.5%.[130] Number of unemployed and retired persons combined exceeded number of employed in August 2010, as it fell to 1.474million.[131] In 2009, labour force consisted of 1.765million persons out of 3.7million working age population—aged 15 and over.[7] In October 2011, unemployment rate stood at 17.4%.[132] 7.2% of employed persons hold a second job.[133]
2011 census recorded a total of 1,534,148 private households in Croatia as well as 1,487 other residential communities such as retirement homes, convents etc. At the same time, there were 1,923,522 permanent housing units—houses and apartments.[134] 2001 census recorded 1.66million permanent housing units, including 196thousand intermittently occupied and 42thousand abandoned ones. Average size of a permanently used housing unit is 74.4 square metres (801 square feet). The intermittently used housing units include 182thousand vacation houses and 8thousand houses used during agricultural works. The same census also recorded 25thousand housing units used for business purposes only.[135] As of 2007, 71% of the households owned their own housing and had no mortgage or other loans to repay related to the housing, while further 9% were repaying loans for their housing. The households vary by type and include single households (13%), couples (15%), single parent households (4%), couples with children (27%) and extended family households (20%).[133] There are approximately 500 homeless persons in Croatia, largely living in Zagreb.[136]
Average urbanisation rate in Croatia stands at 56%, with the maximum rate recorded within the territory of the City of Zagreb, where it reached 94.5% and Zagreb metropolitan area comprising the City of Zagreb and the Zagreb County, where it stands at 76.4%.[137] Very significant rate of urbanisation was observed in the second half of the 20th century. 1953 census recorded 57% of population which was active in agriculture, while a census performed in 1991 noted only 9.1% of population active in that field. This points to augmentation of urban population and reduction of rural population.[138]
↑"Povijest Gradišćanskih Hrvatov" (in Croatian). Croatian Cultural Association in Burgenland. Archived from the original on 14 November 2012. Retrieved 17 October 2011.
↑Angelo Filipuzzi (1966). La campagna del 1866 nei documenti militari austriaci: operazioni terrestri (in Italian). University of Padova. p.396.[ISBN unspecified]
↑"Treaty of Peace with Italy"(PDF). Treaties and international agreements registered or filed and recorded with the Secretariat of the United Nations. 10 February 1947.
↑Ronen, Yaël (June 2019). "Option of Nationality". Max Planck Encyclopedias of International Law. Oxford Public International Law.
This page is based on this Wikipedia article Text is available under the CC BY-SA 4.0 license; additional terms may apply. Images, videos and audio are available under their respective licenses.