Northern Ireland is the smallest of the four parts of the United Kingdom in terms of both area and population, containing 2.9% of the total population and 5.7% of the total area of the United Kingdom. It is the smaller of the two political entities on the island of Ireland by area and population, the other being the Republic of Ireland. Northern Ireland contains 27.1% of the total population and 16.75% of the total area of the island of Ireland.
The Belfast Metropolitan Area dominates in population terms, with over a third of the inhabitants of Northern Ireland.
When Northern Ireland was created, it had a Protestant majority of approximately two-to-one,[2][3][4] unlike the Republic of Ireland, where Catholics were in the majority.[5] The 2001 census was the first to show that the Protestant and other (non-Catholic) Christian share of the population had dropped below 50%, but 53.1% still identified as being from a Protestant or other Christian background. In the 2011 census, this dropped to 48.4%.[6][4] In 2021, the recorded number of Catholics by background (45.7%) overtook the Protestant and other Christian by background share (43.48%), becoming the plurality, with no group in the overall majority.[7][8][9][10]
Its people speak Ulster English which is itself heavily influenced by the Scots language of which Ulster Scots is a dialect, while a significant number speak Irish (Gaelic) or Ulster Scots. In addition the Ulster dialect of Irish (Gaelic) also has a closer connection to Scottish Gaelic than other Irish (Gaelic) dialects. This is both because of historic links with Scotland going back centuries, and because of settlements of lowland Scots Protestants in Ulster in the 17th century, such as the Plantation of Ulster.
Also unlike the Republic, a large proportion of people in Northern Ireland have a British national identity, although a significant minority identifies as Irish. Many people in Northern Ireland have a Northern Irish identity, whether in addition to a British or Irish identity or by itself.
Note: 1981 and 1991 data are mid-year estimates.[12] Data for years prior to 1926 are from the Census of Ireland, for those counties that became Northern Ireland in 1920.
Northern Ireland's population density is 133 people per square kilometre – comparable to European countries such as Denmark and the Czech Republic. If Northern Ireland were a sovereign state, it would have the 16th-highest population density in Europe. It has a higher population density than Scotland (70 people per km2), but less than England (434 per km2) and Wales (153 per km2).[15]
Belfast is the most population-dense of the 11 local government districts at 2,617 per km2, with the highest population (345,418)[16] and least land area (133 km2)[17] of any district, and includes both Belfast City and much of the Metropolitan Castlereagh settlement (formerly part of the Castlereagh local government district before 2015).
Fermanagh and Omagh is the least dense district, with the lowest population (116,812)[18] and greatest land area (2,836 km2). It includes all of Northern Ireland's least-populous county, Fermanagh (except the townland of Killybane near Fivemiletown), and the largely rural former Omagh district.
The 217 wards with the highest population density which make up 50.2% of the population. They have a combined area of 460.1km , 3.3% of Northern Ireland's total area. Overlaid: railways (black), rail stations (yellow), motorways (blue), dual carriageways (green).
Of the 80 District Electoral Areas that make up the local government districts, Botanic in Belfast has the highest population density at 4,653 people per km2,[17] as well as being the most populous DEA (49,727 people in 2021).[19] The DEA includes Belfast city centre, Queen's University, and much of the city's student population.
Erne West in Fermanagh and Omagh has the lowest population density of any DEA, with 20 people per km2, as well as being the least populous DEA (14,661 people in 2021). Erne West is largely mountainous and separated from the rest of Northern Ireland by Lough Erne, with only a few roads around and over the lough. The largest settlement, Bellanaleck, a small village near Enniskillen, is home to only 714 people,[20] and is apart from the other small villages spread through Erne West's large, narrow area.
The 216 contiguous wards with the highest population density, which make up 50.02% of the population. They have a combined area of 1,299km , 9.4% of Northern Ireland's total area. Overlaid: railways (black), rail stations (red), motorways (blue), dual carriageways (green).Another way to show the majority of Northern Ireland's population is as a contiguous area centred on Belfast and nearby settlements (red) and the surrounding area (yellow). This highlights the concentration of Northern Ireland's population - and its road and rail infrastructure - around greater Belfast.
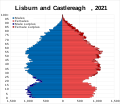
As of 2021, 50.2% of Northern Ireland's population lived in the 217 most population-dense electoral wards (around 47% of Northern Ireland's 462 wards). The 217 wards have an area of 460.1 km2, 3.3% of Northern Ireland's total area. Of these 217 wards, 99 are a contiguous area covering most of Belfast, Castlereagh, Lisburn and Newtownabbey. These 217 wards are highlighted in red on the map.
Furthermore, 50.02% of Northern Ireland's population lived in the most population-dense contiguous area of 216 electoral wards. These 216 wards have an area of 1,299km2, 9.4% of Northern Ireland's total area. These 216 wards are highlighted in purple on the map. These wards cover part or all of the 10 largest settlements, and almost entirely track Northern Ireland's rail lines, motorways and dual carriageways. The exceptions are a spur towards Armagh city; and a string of villages between Ballymena and Limavady.
The electoral wards in Northern Ireland with the highest and lowest population density are listed in the table below:
Place of birth by age groupMap showing the percentage of the population born outside Northern Ireland according to the 2021 census.
In 2001, 91.0% of the population were born in Northern Ireland, 7.2% were born in other parts of the UK and Ireland, and 1.8% were born elsewhere. By 2021, the proportion of immigrants from outside the UK and Ireland had risen to 6.6%, while the proportion born within other parts of the UK and Ireland had fallen to 6.9%. The highest number of non-British/Irish immigrants are in Belfast City Council, followed by Armagh City, Banbridge and Craigavon Borough Council and Mid Ulster District Council. The town of Dungannon in Mid Ulster District Council has a bigger share of immigrants than any town in Northern Ireland, while Derry City and Strabane has the smallest share of immigrants.[24]
Below are the 5 largest foreign-born groups in Northern Ireland according to 2014 ONS estimates.[28]
Country of birth
Estimated population, 2013
Estimated population, 2014
Estimated population, 2015
Poland
25,000
20,000
18,000
Lithuania
7,000
8,000
13,000
India
8,000
6,000
6,000
Philippines
3,000
4,000
5,000
Emigration
Detailed statistic on births are available between 1887 and 2022 in Birth tables [29] and deaths between 1955 and 2022 in Death tables [30]
Using deaths and births between 1955 and 2021, and the number of those from the 2021 census whose country of birth is Northern Ireland, we can estimate emigration for those aged under 66 by subtracting the total of the number of deaths and the number of those born in Northern Ireland who are still living there.
Northern Irish emigration estimates
All ages
18-66 year olds
Births 1955-2021
1,801,552
1,353,624
Deaths 1955-2021 among those born 1955-2021
78,914
76,226
Country of birth is Northern Ireland in 2021 Census, ages 0–66
1,389,081
965,538
Estimated Emigration
333,557
311,860
Estimated Emigration as a percentage of births
18.5%
23.0%
This gives an estimate of 18.5% of all people born since 1955 have emigrated, or 23% of adults aged 18–66. This is an estimate of the minimum amount of emigration, since deaths are not broken down by country of birth, so some of those will not have been born in Northern Ireland. Most deaths occur in the over 50 and currently about 12.5% of those aged 50 and over were born outside Northern Ireland. Adjusting the number of deaths downwards by 12.5%, we can estimate an emigration rate of 18.5 to 19% for all ages, and 23.0% to 23.7% for adults aged 18–66.
Doing the same analysis by age shows that this is consistent with the actual number of those born in Northern Ireland from the 2021 England/Wales census,[31] where about 40% of emigrants have settled in England or Wales.
Emigration from Northern Ireland by Age
Births, deaths, and Northern Ireland-born living in Northern Ireland
Estimated emigration as percentage of births, compared to Northern Ireland-born living in England as a percentage of births
Below are the numbers of Northern Ireland born living outside Northern Ireland from the most recent censuses for England, Wales, Scotland, Ireland, Australia, and New Zealand.
Numbers for other countries are not available for the individual countries that make up the UK, so it is not possible to accurately determine the number living in the US, Canada, or the EU (excluding Ireland). The numbers estimated from total UK emigrants are included in the above table but not included in the total.
Of those born in Northern Ireland and aged between 16 and 24, 64% living in England and 72% living in Scotland are full-time students.[39][40]
Ethnicity
Whereas a question on ethnic group was asked in Great Britain from 1991, it was in 2001 that the Northern Ireland census first asked about ethnicity.[41][42]
Northern Ireland ethnic demography
Ethnic demography of Northern Ireland from 2001 to 2021
Population pyramid of Northern Ireland by ethnicity in 2021
The following table shows the ethnic group of respondents for the following censuses
A question about knowledge of Irish was reintroduced to the census in 1991, for the first time since 1911. In 2011, the census question was modified to ask about Ulster Scots alongside Irish.[50]
Foreign languages. Map showing the percentage of people whose main language was other than English or Irish (Gaeilge) in the 2021 census. Those stating Ulster Scots as their main language were negligible in number and not analysed geographically by NISRA.
Percentage of people aged 3+ claiming to have some ability in Irish in the 2021 census
Percentage of people aged 3+ claiming to have some ability in Ulster Scots in the 2021 census
Main language of all usual residents aged 3 and over
Understands spoken Ulster Scots, but cannot speak, read, or write
92,040
5.30%
115,088
6.27%
Can speak but cannot read or write Ulster Scots
10,265
0.59%
26,570
1.45%
Can speak and read but cannot write Ulster Scots
7,801
0.45%
12,297
0.67%
Can speak, read, write, and understand Ulster Scots
16,373
0.94%
20,930
1.14%
Other combination of skills
13,725
0.79%
15,728
0.86%
Has some knowledge of Ulster Scots
140,204
8.08%
190,613
10.38%
Education
Northern Ireland has a highly educated and literate population, particularly among the younger generations.
The following shows the educational attainment, shown by highest qualification received, at different ages for adults, in the 2021 census[59]
Highest Qualification received - Level 1 to Level 4
Highest qualification received by age
Female highest qualifications by age
Male highest qualifications received by age
Apprenticeships and No qualifications
Apprenticeships by age
No qualifications by age
The census defines the levels as follows:
Level 1: 1 to 4 GCSEs, O levels, CSEs (any grades); 1 AS Level; NVQ level 1; or equivalent
Level 2: 5 or more GCSEs (A*-C or 9–4), O levels (passes) CSEs (grade 1); 1 A level, 2-3 AS Levels; NVQ level 2, BTEC General, City and Guilds Craft; or equivalent
Level 3: 2 or more A Levels, 4 or more AS Levels; NVQ Level 3, BTEC National, OND, ONC, City and Guilds Advanced Craft; or equivalent
Level 4: Degree (BA, BSc), foundation degree, NVQ Level 4 and above, HND, HNC, professional qualifications (teaching or nursing, for example), or equivalent
Other: Other qualifications, equivalent unknown
Younger adults, aged 18–30, are the highest ever qualified group. Just under 50% of that age group who have reached university graduation age (around 23 years old) have achieved a Level 4 or above qualification. This is about 10% higher than those aged 30–40. The number of those without qualifications is the lowest in 18-30 group.
There is a large gender gap with 10% more females than males receiving Level 4 or above qualification. About 55% of women in their 20s have achieved Level 4.
The number of young adults with no qualifications is less than 8%, compared to an overall 23.8%. There has been a decrease in the number of people with apprenticeships from about 20% of males over 70 to only 5% for 20-30 year olds.
Compared to the UK regions in England and Wales, Northern Ireland has one of the highest percentages of those with a Level 4 qualification, with only London and southern England regions higher. However it also has the highest proportion of people with no qualifications. This is not entirely due to higher numbers of older people without qualifications. Even among the younger, more qualified, NI residents, Northern Ireland has the highest proportion of people with no qualifications.[60]
Northern Ireland compared to UK regions
Percentage of people with degree-level qualifications in England and Wales compared to Northern Ireland.
Percentage of people with no qualifications in England and Wales compared to Northern Ireland.
Past censuses
Questions about the highest academic qualification received has been asked since the 1991 census. The categorization of results has changed since 1991, but each prior census can be mapped to 2021 categories.
Apprenticeships were not tracked as separate categories in 1991 or 2001 and it is not certain whether they were counted as "No Qualifications". About 10% of those over 50 reported holding an apprenticeship in 2021. Currently apprenticeships have a large academic component, and are separated into "Intermediate", "Advanced," and "Higher" apprenticeships, and so are included as academic qualifications.[61]
Mapping the past results to the 2021 categories shows that the number of people with no qualifications has dropped considerably in each census, whereas the number of people with degrees or equivalent is nearly 4 times larger than in 1991.
Population pyramid of Northern Ireland by religion brought up in 2021
Percentage by Religious Background at each age
Population by Religious Background at each age
Changes in Religious Background, between 2001 and 2021
Religious Background in each Electoral Area 2001.[65] Protestants outnumbered Catholics in 46 out of the 80 Electoral Areas
Religious Background in each Electoral Area 2011.[66] Protestants outnumbered Catholics in 44 out of the 80 Electoral Areas
Religious Background in each Electoral Area 2021.[67] Protestants outnumbered Catholics in 37 out of the 80 Electoral Areas
For the first century that Northern Ireland existed, the majority or plurality of its population identified with Protestantism, and with its founding, the region was intended to have a permanent Protestant majority.[68] With the 2021 census, Catholics outnumbered Protestants for the first time.[69] Reliable religion statistics are not available for 1971 or 1981 because boycott campaigns against the census during the Troubles resulted in high rates of non-response to the religion question.[70][41][69]
Northern Ireland is geographically polarized by religion. Catholics are concentrated in the west and border areas, and recently in Belfast. Protestants are concentrated in the east, in an east–west band across northern Armagh to northern Down, and north–south from the Antrim coast to north of Belfast. Belfast was once a majority Protestant city but became a Catholic plurality city between the 2001 and 2011 censuses.
The following table shows the religion stated by respondents to the 2001, 2011 and 2021 censuses.
The religious affiliations in the districts of Northern Ireland at the times of the 2001, 2011, and 2021 censuses were as follows. Note that these boundaries changed in 2015.
"Religion" vs "religion or religion Raised In" (religious background)
Religion and Religion Raised in by age
The census included two questions related to religion: "what religion, religious denomination or body do you belong to?" and "what religion, religious denomination or body were you brought up in?"
This produced two sets of results, where the "current religion" is in all cases less than the "religion brought up in"
The difference between the two measurements is higher for Protestants than for Catholics, and is higher among younger people.
Geographically, using Religion instead of Religious Background does not change the areas where Catholic outnumber Protestants, or vice versa, but results in some regions where a majority turns into a plurality.
'Religion' vs 'Religion or Religion Raised In' mapped by DEA
Religious plurality or majority based on "religion belong to"[77]
Religious Background in each Electoral Area 2021.
National identity
National Identity
Map of predominant national identity in the 2021 census in Northern Ireland
Predominant National Identity by District Electoral Area (DEA)[78]
Most commonly selected National Identity in 2011 census, based on 2011 Census "Small Areas". Combinations that include both British and Irish are excluded. "Other" consists of National Identity responses that do not include Irish, British, or Northern Irish in any combination.
Most commonly selected National Identity in 2021 census, based on 2021 Census "Data Zones" so cannot be directly compared to 2011[79]
In Northern Ireland national identity is complex. Many in Northern Ireland have a British national identity and view the English, Scots and Welsh as fellow members of their common nation while regarding people from the Republic of Ireland as foreigners. Many others in Northern Ireland view people from the Republic of Ireland as being members of their common nation encompassing the island of Ireland and regard the English, Scots and Welsh as foreigners. Co-existing with this dichotomy is a Northern Irish identity, which can be held alone or, as is also the case with Englishness, Scottishness and Welshness, alongside a British identity, or alongside an Irish identity. A small number of people see themselves as being both British and Irish.
In the 2021 census respondents gave their national identity as follows.
Identity in Northern Ireland in 2021 by population pyramid
British only identity
Irish only identity
Northern Irish only identity
National identity and religion
National Identity by Religions breaks down as follows.[81] All tables, maps, and graphs in this section use "Religion or Religion brought up in" from the census.
Catholic
Protestant
Other
No Religion
All Residents
British only
6.6%
57.8%
29.3%
35.5%
31.9%
British and Northern Irish only
0.8%
15.4%
3.9%
9.0%
8.0%
Irish only
60.0%
2.0%
8.8%
7.6%
29.1%
Irish and Northern Irish only
3.1%
0.4%
1.0%
1.5%
1.8%
Northern Irish only
20.9%
17.7%
9.9%
25.6%
19.8%
British and Irish only
0.7%
0.5%
1.1%
0.6%
0.6%
British, Irish and Northern Irish only
0.9%
1.9%
1.5%
2.3%
1.5%
Other
7.0%
4.4%
44.7%
18.0%
7.4%
British only plus British and Northern Irish only
7.4%
73.1%
33.2%
44.5%
39.9%
Irish only plus Irish and Northern Irish only
63.1%
2.4%
9.7%
9.0%
30.9%
Other combinations of British, Irish and Northern Irish
1.6%
2.4%
2.6%
2.9%
2.1%
Any choice that includes British
9.0%
75.5%
35.8%
47.4%
42.0%
Any choice that includes Irish
64.7%
4.8%
12.3%
11.9%
33.0%
Areas where less than 50% Catholics identify as Irish (green) and less than 50% Protestants identify as British (red)
Although there is a strong correlation between religion and national identity, Catholics tending to identify as Irish and Protestants tending to identify as British, this is not an absolute relationship, and the correlation is weaker amongst Catholics than it is amongst Protestants. Amongst Catholics, geography also plays an important role, with Catholics in heavily Protestant parts of Northern Ireland being more likely to call themselves British and less likely to call themselves Irish than Catholics in more Catholic areas of Northern Ireland. The reverse is true for Protestants, but to a lesser extent. However, the actual numbers are low for both those Protestants identifying as Irish and Catholics identifying as British, since it happens in areas where the respective religion is proportionally low.
In the 2021 census, Protestants outnumbered Catholics in 37 DEAs, down from 44 in 2011, while those considering themselves British outnumbered those who considered themselves Irish in 45 DEAs, down from 58 in 2011.
The majority of areas being British, despite the majority of areas being Catholic, is partly because Catholics were more likely to see themselves as British than Protestants were to see themselves as Irish (however this changed significantly between 2011 and 2021 - 9% vs. 4.8% respectively – in 2011 it was 13% vs 4% respectively), but is also partly because those of no religion were more likely to see themselves as British as see themselves as Irish. The non-religious tend to live in Protestant areas, suggesting that they are mostly of Protestant descent. In 2021, 47% of those professing no religion considered themselves British, while 12% considered themselves Irish. Members of the immigrant population, which includes many Poles, are also more likely to consider themselves Catholic.
Northern Irish identity was slightly more likely amongst Catholics than amongst Protestants, and it varied little according to geography.
Protestant National Identity
Percentage of Protestants identifying as British
Percentage of Protestants identifying as Irish
Percentage of Protestants identifying as Northern Irish
Catholic National Identity
Percentage of Catholics identifying as British
Percentage of Catholics identifying as Irish
Percentage of Catholics identifying as Northern Irish
No Religion National Identity
Percentage of professing no religion identifying as British
Percentage of those professing no religion identifying as Irish
Percentage of those professing no religion identifying as Northern Irish
Changes from 2011 to 2021
National Identity between 2011 and 2021
National Identity in Northern Ireland by Electoral Area 2011. British outnumbered Irish in 58 out of the 80 Electoral Areas.[82] British is total of British Only plus British and Northern Irish, Irish is total of Irish Only plus Irish and Northern Irish
National Identity in Northern Ireland by Electoral Area 2021. British outnumbered Irish in 45 out of the 80 Electoral Areas[83]
Swing from British to Irish identity by DEA (2014) from 2011 to 2021 censuses
National identity by age in 2011 (solid line) and 2021 (dotted line) showing a narrowing in the gap from 2011[84][85]
The following metrics account for over 90% of the population in both 2011 and 2021. National Identity showed a large shift from British to Irish of 10% between 2011 and 2021.
2011
2021
Change
British Only
39.9%
31.9%
-8.0%
British And Northern Irish
6.2%
8.0%
+1.8%
Irish Only
25.3%
29.1%
+3.9%
Irish And Northern Irish
1.1%
1.8%
+0.7%
Northern Irish Only
20.9%
19.8%
-1.1%
All DEAs showed an increase in Irish National Identity relative to British, with the lowest increase (3%) in the Court DEA, and the largest increase (22%) in the Castlereagh South DEA. Generally the largest increases were in the east, in and around Belfast.
Between 2011 and 2021, Catholics seeing themselves as British fell from 13% to 9%, while Protestants seeing themselves as Irish increased from 4% to 4.8%.
The shift from British to Irish can be seen from the plot comparing the age groups from the 2011 census with the same age cohort in the 2021 census. There was a swing towards Irish across all age cohorts, but it was 12-13% among younger adults (under 35 in 2021), approximately 2-6% among 35-64 (in 2021) year olds, and a much smaller 0.8% in the oldest age cohort.
Age cohort changes between 2011 and 2021
National Identity in 2011 and 2021, by same age cohort. For example, those in the 16-24 age group in 2011 are compared to the 26-34 age group in 2021[86]
Swing from British to Irish by age cohort.
Passports held
Passports held. Red is British and green is Irish.
The most commonly held passport according to the 2011 census. 1,070,413 British and 375,826 Irish passports were held.[87]
The most commonly held passport according to the 2021 census. 1,000,207 British and 614,251 Irish passports were held.[88]
People born in Northern Ireland have automatic British citizenship on the same basis and with the same provisions as those born elsewhere in the United Kingdom. Despite the Irish Government's withdrawal of its constitutional claim to Northern Ireland in 1999, those born in Northern Ireland are entitled to Irish citizenship, should they so choose. Because of this entitlement most people in Northern Ireland are able to get both a British passport and an Irish Passport. Through an agreement between the Irish Government and Post Office Ltd, post offices in Northern Ireland provide a service where customers can apply for an Irish passport, alongside their service where customers can apply for a British passport.
Significantly more Irish passports (+11.4%) and fewer British passports (-6.5%) were held in 2021 compared to 2011. Catholics in particular gave up their British passports (-10.9%) and now hold Irish passports (+16.7%), but there was also a small drop in the percentage of Protestants with British passports (-0.4%) and large increase in Protestants with Irish passports (+6.5%). Similarly "Other" and "No religion" British passport holders fell by 8.3% and 4.9% respectively, and Irish passport holder increased by 5.6% and 6.9% respectively.
In the 2021 census, respondents stated that they held the following passports,[89] compared to 2011.[90][91]
Passport
All usual residents
Religion or religion brought up in
Catholic
Protestant and other Christian
Other Religions
None
2021
Change
2021
Change
2021
Change
2021
Change
2021
Change
No passport
15.9%
-3.0%
15.1%
-4.1%
16.0%
-2.5%
12.5%
-6.0%
19.6%
-0.6%
EU/EEA Countries
83.0%
+0.9%
84.3%
+1.9%
83.5%
+1.1%
64.8%
-4.5%
77.6%
-0.8%
United Kingdom
52.6%
-6.5%
27.5%
-10.9%
77.4%
-0.4%
47.7%
-8.3%
60.3%
-4.9%
Ireland
32.3%
+11.4%
57.2%
+16.7%
10.6%
+6.5%
15.6%
+5.6%
14.1%
+6.9%
Poland
1.3%
+0.3%
2.4%
0.4%
0.1%
0.0%
0.7%
+0.1%
0.9%
0.0%
Lithuania
0.6%
+0.2%
1.0%
+0.3%
0.1%
+0.1%
0.4%
+0.2%
1.2%
+0.4%
Other EU/EEA
1.9%
+1.1%
1.5%
+0.6%
1.3%
+0.9%
5.5%
+3.1%
5.7%
+1.5%
Other
1.1%
-0.1%
0.5%
-0.4%
0.6%
-0.1%
22.7%
-3.3%
2.8%
-0.7%
The following table shows the number of passport applications from within Northern Ireland since the 2021 census. 2024 numbers are up to 26 August 2024, and are not yet available broken down into first time or renewals.
In 2022, 34.8% of Irish passport applications were first time applications. In 2023 this rose to 38.2% of applications.
Population pyramid from 1971 to projections to 2050
According to the Northern Ireland Statistics and Research Authority the average (median) age increased from 34 years to 37 years between the 2001 and 2011 censuses. Over the same period, the share of the population represented by children aged under 16 years fell from 24 per cent to 21 per cent, while the proportion of people aged 65 years and over rose from 13 per cent to 15 per cent.[96]
Population pyramids of each of Northern Ireland's Local Government Districts
This page is based on this Wikipedia article Text is available under the CC BY-SA 4.0 license; additional terms may apply. Images, videos and audio are available under their respective licenses.