Ethnic classification used in the 2011 United Kingdom Census
This article is about one of the White ethnicity classifications used in the United Kingdom census. For the broad racial group, see White people in the United Kingdom. For the cattle breed, see British White.
Ethnic group
White British
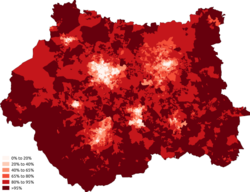
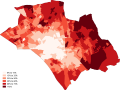
Geographic distribution of the White British in 2021 (in England and Wales)
White British is an ethnicity classification used for the White population identifying as English, Scottish, Welsh, Cornish, Northern Irish, or British in the United Kingdom Census. In the 2011 census, the White British population was 49,997,686, 81.5% of Great Britain's total population. For the entire United Kingdom, due to different reporting measures within Northern Ireland which includes all those who identified as British with those who identified as Irish, an amalgamated total of 52,320,080 is given. This accounts for 82.8% of the population and includes individuals who identified as White Irish in Great Britain.[6][7][8] In the 2021 Census, the White British group numbered 44,355,044 or 74.4% of the population of England and Wales.[9]
This section needs to be updated. Please help update this article to reflect recent events or newly available information.(May 2024)
For the 2011 census, in EnglandandWales, the White self-classification option included a subcategory of "English/Welsh/Scottish/Northern Irish/British".[10][11] In Scotland, the White category included "Scottish" and "Other British" options.[12] In Northern Ireland, the White British classification did not appear, the only choice being 'White'.[13]
The 2011 census for England, Wales and Scotland also included additional White ethnic classifications of White Irish, White Gypsy/Irish Traveller and White Other. There were calls for the 2011 national census in England and Wales to include an extra subcategory so people could identify their ethnic group as Cornish.[14][15]
For the 2021 census, in England and Wales, the 'Roma' group was added under the 'White' ethnic group.[9]
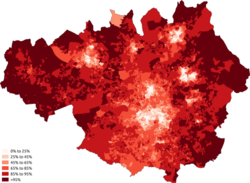
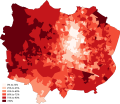
Geographic distribution of the White British by constituency in 2021 (in England and Wales)
Demographics
Population and distribution
Population pyramid of the White British in 2021
The White British census classification have their ages more evenly distributed in their population pyramid and have the highest per cent female population of all ethnic-based classifications. The following numbers were based on the 2011 census conducted in each country. In England and Wales, about 64 per cent of the White British classification are between the ages of 16 and 64 while about 18 per cent are under 16 and 19 per cent are over 64. All other census classifications have a higher percentage of their population under 16 and a lower percentage over 64. Of those aged 65 or over, White British are 8 per cent male and 10 per cent female, making them have the lowest per cent male population among all census classifications defined as "ethnic" in the census.[16]
In Scotland, about 65 per cent of the White British classification are between the ages of 16 and 64 while about 17 per cent are under 16 and 18 per cent are over 64. Of those aged 65 or over, White British are 8 per cent male and 10 per cent female, the same percentages as in England and Wales.[17]
In Northern Ireland, about 13 per cent of the White classification are between the ages of 16 and 24 while about 21 per cent are under 16 and 65 per cent are over 24. Of those aged 25 or over, white people are 32 per cent male and 34 per cent female.[18]
Since the 2011 UK Census was returned, London contained by far the lowest percentage of English and other White British people of all the UK regions, where they made up less than half of the population in 24 of the 32 boroughs, including: Newham (16.7%), Brent (18.0%), Ealing (30.4%), Harrow (30.9%), Hackney (31.2%), Redbridge (35.2%) and Tower Hamlets (36.2%). Despite this, the White British population in London was still higher in numbers than the entirety of Wales or Northern Ireland, owing to London's high overall population. The city with the lowest White British population as a percentage was Leicester (40.9%) – also the only city below 50% – while the lowest for unitary authorities was Slough (34.5%), followed by Luton (44.6%).[6] The local ward with the lowest percentage was Southall Broadway in Ealing (3.5%), followed by Southall Green in Ealing; Green Street East, Green Street West, and East Ham North, all in Newham, which were the only wards below five per cent.
↑Excluding Northern Irish figures entirely, only including those for White British in Great Britain
↑Excluding Northern Irish figures entirely, only including those for White British in Great Britain
↑In 2021 and 2022, Scotland held its census a year later after England, Wales and Northern Ireland due to the COVID-19 pandemic. As a result, the data shown is from two separate years.
↑Excluding Northern Irish figures entirely, only including those for White British in Great Britain
↑In 2021 and 2022, Scotland held its census a year later after England, Wales and Northern Ireland due to the COVID-19 pandemic. As a result, the combined population of the United Kingdom according to the 2021 and 2022 census results was 66,940,563.
↑In 2021 and 2022, Scotland held its census a year later after England, Wales and Northern Ireland due to the COVID-19 pandemic. As a result, the combined population of the United Kingdom according to the 2021 and 2022 census results was 65,037,384.
The 2021 census for England and Wales recorded a population of over 43.20 million White British born in the United Kingdom, representing the main birthplace of the majority (97.4%) of those who identified as White British. The remaining 1.15 million White British residing in England and Wales were born in countries outside of the United Kingdom. The most common countries of birth were Germany (149,838), South Africa (101,425), Poland (73,685), Romania (63,101) and the United States (59,036).[30]
Economic status and education
According to official UK Government figures from 2016, the employment rate for White British people stood at 75%, with the overall employment rate in the UK standing at 74%.[31] UK Government figures also demonstrate that 31% of White British people work in professional and managerial occupations, higher than the Mixed (30%), Pakistani/Bangladeshi (27%) and Black (25%) groups, but lower than the Indian ethnic group (43%).[32]
At GCSE level, official UK Government statistics state that 63% of White British pupils attained A* to C grades in English and Mathematics in the 2015–16 academic year, higher than Black Caribbean (51%) and Pakistani (58%) pupils, but lower than Bangladeshi (67%), Indian (77%) and Chinese (83%) pupils.[33] According to a report by the Sutton Trust, "White working class pupils achieve the lowest grades at GCSE of any main ethnic group, with just a quarter of boys and a third of girls achieving 5 good GCSEs."[34] At A-Level, in the 2015–16 academic year, 11% of White British pupils achieved at least 3 'A' grades at A-Level; the only major ethnic groups to achieve the same benchmark at a higher rate were Indian (14%) and Chinese (24%) pupils.[35]
According to Department for Education statistics for the 2020–21 academic year, White British pupils attained slightly below the national average for academic performance at both A-Level and GCSE. 25.9% of White British pupils achieved at least 3 As at A Level[36] and an average score of 50.2 was achieved in Attainment 8 scoring at GCSE level.[37] White British pupils eligible for free school meals, a measurement of socioeconomic status, are found to be the largest disadvantaged group in education across the early years, GCSE performance and access to higher education.[38] Since 2007, out of all ethnicities aged 18 years old who have received a state education, white pupils have had the lowest rate of entry into higher education and have also seen the lowest rate of increase, from 21.8% in 2007 to 33.3% in 2021. For comparison, 72.1% of Chinese pupils and 48.6% of Black pupils gained a higher education place in the same year.[39]
Percentage of students getting at least 3 A grades at A level (2020/21)[36]
Research conducted on behalf of the Commission on Race and Ethnic Disparities in 2021 showed that white people have the highest rate of cancer in the United Kingdom.[41] In 2024 it was also found that whites had the highest suicide rate of any ethnic group in the UK.[42]
Statistically, White British are more likely to be Christian than other ethnic-based classifications other than Black and Roma British. According to the 2011 UK Census, White British are 64% Christian in England and Wales, mostly Anglican in England, while the percentage for all groups is about 59%. The percentage of White British who are Christians is lower in Scotland, at 55% (mainly Presbyterian there), whereas at least 54% of all Scots are Christian. The British country with the highest percentage is Northern Ireland, where white people are 94% Christian, while 93% of all usual residents are. About 27% of the White British population in England and Wales, and 36% in Scotland reported having "no religion". In Northern Ireland, the lowest percentage of white people who reported "no religion" in the census is about 5%. The 27% and 36% per cent figures for "no religion" are about the same for all groups. About 7% of the White British in England and Wales, and Scotland declined to state any religion.[43][44][45]
↑Report states that births in which no ethnicity was stated were usually White British. If assumptions about all non-stated births are actually White British, the percentage of the group rises to 75.2% of births in 2005 and 80.3% White overall.
↑Including all White people reporting at least one of British/Irish/Northern Irish/English/Scottish/Welsh national identities
↑"Key Statistics in England and Wales". webarchive.nationalarchives.gov.uk. 2001. Archived from the original on 5 January 2016. Retrieved 7 January 2022.{{cite web}}: CS1 maint: bot: original URL status unknown (link)
This page is based on this Wikipedia article Text is available under the CC BY-SA 4.0 license; additional terms may apply. Images, videos and audio are available under their respective licenses.