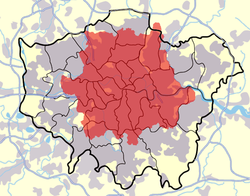
Greater London ceremonial county (red) within England. The small enclave in its centre is the City of London (white). Together they form the Greater London administrative area.
Greater London has a land area of 1,572km2 (607sqmi) and had an estimated population of 9,089,736 in 2024.[4] The ceremonial county of Greater London is only slightly smaller, with an area of 1,569km2 (606sqmi) and a population of 9,074,625 in 2024.[6] The area is almost entirely urbanised and contains the majority of the Greater London Built-up Area, which extends into Hertfordshire, Essex, Kent, Surrey, and Berkshire and in 2011 had a population of 9,787,426. None of the administrative area, region, or ceremonial county hold city status, but both the City of London and City of Westminster do. The area was historically part of Middlesex, Essex, Surrey, Kent and Hertfordshire.
The River Thames is the defining geographic feature of the area, entering it near Hampton in the west and flowing east before exiting downstream of Dagenham. Several tributaries of the Thames flow through the area, but are now mostly culverted and form part of London's sewerage system. The land immediately north and south of the river is flat, but rises to low hills further away, notably Hampstead Heath, Shooter's Hill, and Sydenham Hill. The area's highest point is Westerham Heights (245m (804ft)), part of the North Downs. In the north-east the area contains part of Epping Forest, an ancient woodland.
The City of London has had its own government since the Anglo-Saxon period. The first London-wide directly elected local government was the London County Council, established for the County of London in 1889, which covered the core of the urban area. In 1965 the county was abolished and replaced by Greater London, a two-tier administrative area governed by the Greater London Council, thirty-two London boroughs, and the City of London Corporation.[7] The Greater London Council was abolished in 1986, and its responsibilities largely taken over by the boroughs. The Greater London Authority was formed in 2000.
The term "Greater London" was used before it was established by statute in 1965. It referred to the Metropolitan Police District, the area served by the Metropolitan Water Board, the London Passenger Transport Area, and the area defined by the Registrar General as the "Greater London Conurbation".[8][9][10] The term was also used for the Greater London Arterial Road Programme, devised between 1913 and 1916, and the Greater London Planning Region, devised in 1927, which occupied 1,856 square miles (4,810km2) and included 9 million people.[11][9]
Although the London County Council (LCC) and County of London were created in 1889, the area did not cover all of London. London's built-up area, postal district, transport network and Metropolitan Police District, extended vastly beyond the boundaries of the new administrative county. Many of the LCC housing projects, including the vast Becontree Estate, were also outside its boundaries.[12] The LCC pressed for an alteration in its boundaries soon after the end of the First World War, noting that within the Metropolitan and City Police Districts there were 122 housing authorities. A Royal Commission on London Government was set up to consider the issue.[13][14] The LCC proposed a vast new area for Greater London, with a boundary somewhere between the Metropolitan Police District and the home counties.[15] Protests were made at the possibility of including Windsor, Slough and Eton in the authority.[16] The commission made its report in 1923, rejecting the LCC's scheme. Two minority reports favoured change beyond the amalgamation of smaller urban districts, including both smaller borough councils and a central authority for strategic functions. The London Traffic Act 1924 was a result of the commission.[17] Reform of local government in the County of London and its environs was next considered by the Royal Commission on Local Government in Greater London, chaired by Sir Edwin Herbert, which issued the 'Herbert Report' after three years of work in 1960. The commission applied three tests to decide if a community should form part of Greater London: how strong is the area as an independent centre in its own right; how strong are its ties to London; and how strongly is it drawn outwards towards the country rather than inwards towards London.
Greater London is created
Greater London was created by the London Government Act 1963, which came into force on 1 April 1965, replacing the administrative counties of Middlesex and London, including the City of London, where the London County Council had limited powers, and absorbing parts of Essex, Hertfordshire, Kent and Surrey. Greater London originally had a two-tier system of local government, with the Greater London Council (GLC) sharing power with the City of London Corporation (governing the small City of London) and the 32 London Borough councils. The GLC was abolished in 1986 by the Local Government Act 1985. Its functions were devolved to the City Corporation and the London Boroughs, with some functions transferred to central government and joint boards.[18] Greater London formed the London region in 1994.
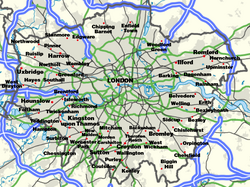
Map of Greater London showing railway lines, primary roads, motorways, and suburban townsThe London postal district in red in contrast to Greater London
The current Mayor (not to be confused with the Lord Mayor of London) is Sadiq Khan. He is scrutinised by the elected London Assembly, which may amend his annual budget (by two-thirds majority) but otherwise lacks the power to block his directives. The headquarters of the GLA, previously at City Hall in Southwark, moved to The Crystal in Newham in January 2022.[27] The Mayor is responsible for Greater London's strategic planning and is required to produce or amend the London Plan each electoral cycle.
Mayor of London
The Mayor of London is a directly elected politician who, along with the London Assembly, is responsible for the strategic government of Greater London.
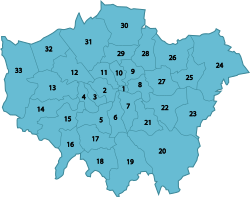
For elections to the London Assembly, London is divided into 14 constituencies, each formed from two or three boroughs. The City of London forms part of the City and East constituency.
London is divided into 73 Parliamentary borough constituencies, formed from the combined area of several wards from one or more boroughs. Typically a borough is covered by two or three constituencies.
Status
The London Region does not have city status granted by the Crown. The Cities of London and Westminster within it have received formal city status.[28][a] Despite this, Greater London is commonly regarded as a city in the general senses of a conurbation and a municipality. A Lord Lieutenant of Greater London is appointed for its area, excluding the City of London. For the purposes of the Lieutenancies Act 1997, this area is defined as a county.[29]
The term "London" usually refers to region or to the conurbation, but not often to the ancient, tiny City of London.[30][31] That small area is often referred to as "the City" or "the Square Mile" and it forms the main financial district. Archaically, the urbanised area of London was known as the Metropolis. In common usage, the terms "London" and "Greater London" are usually used interchangeably.[30] Greater London is officially divided for some purposes, with varying definitions, into Inner London and Outer London. For some strategic planning purposes, it is divided into five sub-regions.
Greater London is divided into 32 London Boroughs, each governed by a London Borough council. The City of London has a unique government dating back to the 12th century and is separate from the county of Greater London, although is still part of the region served by the Greater London Authority.[30]
High resolution view from the top of Tolworth Tower in South West London over the sprawling suburban housing that is typical in some areas of Greater London
With increasing industrialisation, London's population grew rapidly throughout the 19th and early 20th centuries, and it was the most populated city in the world until overtaken by New York in 1925. Its population peaked at 8,615,245 in 1939. There were an estimated 7,753,600 official residents[clarification needed] in mid-2009.[33][failed verification]
London's wider metropolitan area has a population of between 12 and 13 million depending on the definition of that area. According to Eurostat, London has been the most populous city and metropolitan area of the European Union.
The region covers an area of 1,579 square kilometres. The population density is 4,761 people per square kilometre, more than ten times that of any other British region. In terms of population, London is the 25th largest city and the 17th largest metropolitan region in the world.[when?] It is ranked 4th in the world in the number of US dollar billionaires residing in the city. It ranks as one of the most expensive cities in the world, alongside Tokyo and Moscow.
Ethnic groups
In the 2001 UK Census, 71.15% of the population classed their ethnic group as White, including White British (59.79%), White Irish (3.07%) or "Other White" (8.29%, mostly Greek-Cypriot, Italian, Polish and Portuguese). 12.09% classed themselves as British Asian, including Indian, Pakistani, Bangladeshi and "Other Asian" (mostly Sri Lankan, Arab and other Southern Asian ethnicities). 10.91% classed themselves as Black British (around 6% as Black African, 4% as Black Caribbean, 0.84% as "Other Black"). 3.15% were of mixed race; 1.12% as Chinese; and 1.58% as other (mostly Filipino, Japanese, Korean, Vietnamese and other "British Orientals"). 21.8% of inhabitants were born outside the European Union. Irish people, from both the Republic of Ireland and Northern Ireland, number about 200,000, as do the Scots and Welsh combined.
In January 2005, a survey of London's ethnic and religious diversity claimed that there were more than 300 languages spoken and more than 50 non-indigenous communities with a population of more than 10,000. Figures from the Office for National Statistics show that in 2006 London's foreign-born population was 2,288,000 (31%), up from 1,630,000 in 1997. The 2001 UK Census showed that 27.1% of the population were born outside the UK, and a slightly higher proportion were classed as Non-White.
In the 2011 UK Census, 59.79% of the population classed their ethnic group as White, including White British (44.89%), White Irish (2.15%) or "Other White" (12.65%, mostly Greek-Cypriot, Italian, Polish, Spanish, Colombians and Portuguese). 18.49% classed themselves as British Asian, including Indian, Pakistani, Bangladeshi and "Other Asian" (mostly Sri Lankan, Arab and other Southern Asian ethnicities). 13.32% classed themselves as Black British (7% as Black African, 4.22% as Black Caribbean, 2.08% as "Other Black"). 4.96% were of mixed race; and 3.44% as other (mostly Filipino, Japanese, Korean, Vietnamese and other "British Orientals").
The table shows the top 21 countries of birth of residents in 2011.[34] These figures do not give a fair indication of the total population of the specific ethnic groups associated with each country. For example, Londoners of Greek origin (from both Greece and Cyprus) number 300,000, since an organised Greek community has been established for nearly two centuries. The same can be said for Italian and French Londoners whose communities have been here for centuries (the French Embassy estimates there are between 300,000 and 400,000 French citizens living in the UK, with "a huge majority of them living in London").[35] Though a Polish community has existed in London since the late-Middle Ages, it was not significant in the 2001 Census but has grown significantly since 2004, when Poland joined the European Union and by June 2010; London had 122,000 Polish residents.[36] The German-born population figure may be misleading, however, because it includes British nationals born to parents serving in the British armed forces in Germany.
London has been a focus for immigration for centuries, whether as a place of safety or for economic reasons. Huguenots, Eastern European Jews, Cypriots and East African Asians are examples of the former; Irish, Bangladeshis and West Indians of the latter. The East End district around Spitalfields has been first home for several ethnic groups, which have subsequently moved elsewhere in London as they gained prosperity.
The population of the current area of Greater London rose from about 1.1 million in 1801 (when only about 850,000 people were in the urban area, while 250,000 were living in villages and towns not yet part of London) to an estimated 8.6 million in 1939, but declined to 6.7 million in 1988, before starting to rebound in the 1990s.
By 2006, the population had recovered to the level of 1970 (and the level of population in the 1920s). It has now surpassed the previous 1939 peak, and is over 9 million.
Figures here are for Greater London in its 2001 boundaries. Figures before 1971 have been reconstructed by the Office for National Statistics based on past censuses to fit the 2001 boundaries. Figures from 1981 onward are mid-year estimates (revised in August 2007), which are more accurate than the censuses, known to underestimate the population of London.
This is a chart of trend of regional gross value added (GVA) of Inner London at current basic prices published (pp.240–253) by Office for National Statistics with figures in millions of British pounds sterling.
Eurostat data shows the GDP of Inner London to be 232 billion euros in 2009[53] and per capita GDP of 78,000 euros.
This is a chart of trend of regional gross value added of Outer London at current basic prices published (pp.240–253) by Office for National Statistics with figures in millions of British pounds sterling.
Important national and royal ceremonies are shared between St Paul's and Westminster Abbey. The Abbey is not to be confused with nearby Westminster Cathedral, the largest Roman Catholic cathedral in England and Wales. Religious practice in London is lower than in any other part of the UK or Western Europe and is around seven times lower than American averages. Despite the prevalence of Anglican churches, weekly observance is low within that denomination, although in recent years church attendance, particularly at evangelical Anglican churches in London, has started to increase.
London is home to sizeable Hindu, Sikh, Buddhist, Muslim and Jewish communities. Many Muslims live in Tower Hamlets and Newham; the most important Muslim buildings are the East London Mosque in Whitechapel and the London Central Mosque on the edge of Regent's Park. London's large Hindu community is in the north-western boroughs of Harrow and Brent, the latter containing one of Europe's largest Hindu temples, BAPS Shri Swaminarayan Mandir London.
Sikh communities are in East and West London, particularly Southall in the western borough of Ealing, which is also home to the largest Sikh temple in the capital. The majority of British Jews live in London, with significant communities in Stamford Hill (the most Orthodox Jewish area outside New York City and Israel) and St. John's Wood, Golders Green, and Edgware in North London.
Publicly funded education has been administered through 33 LEAs, which correspond to the City of London and the 32 London boroughs, since the 1990 enactment of the Education Reform Act 1988.[54] From 1965 to 1990, 12 Inner London boroughs and the City of London were served by the Inner London Education Authority.[54]
The introduction of comprehensive schools, directed by Circular 10/65 in 1965, was mostly followed in Greater London; however, 19 grammar schools have been retained in some Outer London boroughs,[55] with Sutton having the most with five, followed by Bexley with four and others in five other boroughs. In these boroughs the state schools outperform the (relatively few) independent schools. In inner London, private schools always get the best results and are larger in number. At GCSE and A level, Outer London boroughs have broadly better results than Inner London boroughs.[56]
At GCSE, the best borough is Kingston upon Thames, closely followed by Sutton. Both boroughs have selective schools, and get the top two average GCSE results in England for LEAs. Next is Kensington and Chelsea, the third best in England, then Redbridge, Hammersmith and Fulham, Bromley, Barnet and Harrow. Only ten boroughs have GCSE results under the England average, and some inner-London boroughs have surprisingly good results considering where they lie on the scale of deprivation, e.g. Lambeth. Overall at GCSE in 2009, Greater London had the best results for regions of England. Greater London is generally a prosperous region, and prosperous areas generally have good GCSE results. The City of London has no state schools, just two independent schools. Haringey and Kensington and Chelsea have the most people that pass no GCSEs.[citation needed]
At A-level, the average results for LEAs are disappointing compared to their good GCSE results. Although Kingston upon Thames gets the best GCSE results in England, at A-level it is not even above average. Sutton gets the best A-level results in London and in England. Three of the schools in the top four at A-level in London are in Sutton. It has only one independent school. The few other boroughs with above-average A-level results are Havering, Barnet, Bexley, Redbridge, and Ealing. The poor A-level results in many London boroughs is explained by the quantity of independent schools getting good A-level results. The state school system is often bypassed at age 16 by the more able pupils. Some London boroughs need more good sixth form colleges.[citation needed]
The University of London has 20 federated colleges and schools. The two main constituents of the University of London are (in order of total funding) University College London (UCL) and King's College London (KCL). Imperial College was part of the University of London until 2007, and is now an independent university. UCL, KCL and Imperial have very large research grants – some of the largest in England after Cambridge and Oxford, UCL and Imperial receive around £600 million each which is more than twice as much as any other in the region. The next largest institution by funding is Queen Mary University of London, followed by City, University of London. London is also home to the London School of Economics and Political Science (LSE), one of the few solely social science institutions in the world. Together with UCL and Imperial, they make up the London vertex of the Golden Triangle universities, the other institutions being Oxford and Cambridge. The region has many medical schools although these are part of other institutions such as UCL, KCL and Imperial. The Royal Veterinary College is based in Camden (with another site in North Mymms in Hertfordshire).
50% of students come from the region, and around 30% from other regions. Most students from other regions come from South East England, the East of England, and, to a lesser degree, South West England; the vast majority are from the south of England. Over 50% students native to the region stay in the region, with 15% going to South East England, 30% to either Scotland, Wales or the North East and around 5% go elsewhere. London is a draw for UK graduates from all over the UK.
Over 70% of UK students to graduate from the University of London remain in London; just under 15% go to the South-East, and just over 5% go to the East of England and 10% elsewhere.
Twin cities
The GLA has twin and sister city agreements with the following cities.[57]
This page is based on this Wikipedia article Text is available under the CC BY-SA 4.0 license; additional terms may apply. Images, videos and audio are available under their respective licenses.