4–26 July 1892 | |||||||||||||||||||||||||||||||||||||||||||||||||
All 670 seats in the House of Commons 336 seats needed for a majority | |||||||||||||||||||||||||||||||||||||||||||||||||
|---|---|---|---|---|---|---|---|---|---|---|---|---|---|---|---|---|---|---|---|---|---|---|---|---|---|---|---|---|---|---|---|---|---|---|---|---|---|---|---|---|---|---|---|---|---|---|---|---|---|
| Turnout | 4,317,312 77.4% ( | ||||||||||||||||||||||||||||||||||||||||||||||||
| |||||||||||||||||||||||||||||||||||||||||||||||||
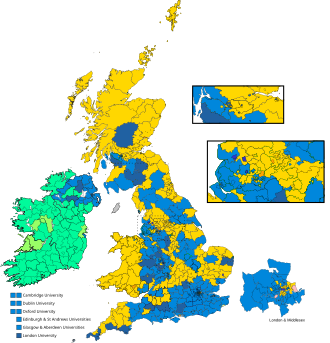 Colours denote the winning party | |||||||||||||||||||||||||||||||||||||||||||||||||
 Diagram displaying the composition of the House of Commons following the election | |||||||||||||||||||||||||||||||||||||||||||||||||
| |||||||||||||||||||||||||||||||||||||||||||||||||


The 1892 United Kingdom general election was held from 4 to 26 July 1892. It saw the Conservatives, led by Lord Salisbury again win the greatest number of seats, but no longer a majority as William Ewart Gladstone's Liberals won 80 more seats than in the 1886 general election. The Liberal Unionists who had previously supported the Conservative government saw their vote and seat numbers go down.
Contents
Despite being split between Parnellite and anti-Parnellite factions, the Irish Nationalist vote held up well. As the Liberals did not have a majority on their own, Salisbury refused to resign on hearing the election results and waited to be defeated in a vote of no confidence on 11 August. Gladstone formed a minority government dependent on Irish Nationalist support.
The Liberals had engaged in failed attempts at reunification between 1886 and 1887. Gladstone however was able to retain control of much of the Liberal party machinery, particularly the National Liberal Federation. Gladstone used the annual NLF meetings as a platform to consolidate various Liberal causes, particularly the Newcastle meeting of 1891, which gave its name to the radical Newcastle Programme. This programme placed Irish Home Rule first, followed by Welsh and Scottish disestablishment, reduction in factory work hours, free education, electoral reform, land reform, reform or abolition of the House of Lords, and the removal of duties on basic foods. This programme would later be disowned by the party leadership following the Liberal defeat in the 1895 election. [1]
