| |||||||||||||||||||||||||||||||||||||||||
All 32 London boroughs, 34 out of 36 metropolitan boroughs, 17 out of 55 unitary authorities, 67 out of 201 district councils, and 6 directly elected mayors | |||||||||||||||||||||||||||||||||||||||||
---|---|---|---|---|---|---|---|---|---|---|---|---|---|---|---|---|---|---|---|---|---|---|---|---|---|---|---|---|---|---|---|---|---|---|---|---|---|---|---|---|---|
| |||||||||||||||||||||||||||||||||||||||||
Map showing council control following the election. Conservative: Labour: Liberal Democrats: No overall control: No election: |
The 2018 United Kingdom local elections were held on Thursday 3 May 2018, [2] with local council elections taking place in all 32 London boroughs, 34 metropolitan boroughs, 67 district and borough councils and 17 unitary authorities. [3] There were also direct elections for the mayoralties of Hackney, Lewisham, Newham, Tower Hamlets and Watford.
With the exception of those areas that have had boundary changes, the seats up for election were last contested in the 2014 local elections.
A parliamentary by-election in West Tyrone took place the same day. [4] Various other local by-elections also took place.
According to a BBC News estimate, taking into account boundary changes, the major political parties are effectively defending the following 'notional' numbers of council seats on election day:
These numbers are how many seats each party won at the previous comparable election, generally in 2014, rather than which party held the seat on the eve of the election. [5] Some other news agencies, such as the Press Association, compare against the party holding a seat on the eve of the election, leading to a different analysis of gains and losses. [6] [7]
There are also 48 Residents Associations' councillors, and 100 'other' / independent councillors. [8]
All registered electors (British, Irish, Commonwealth and European Union citizens) aged 18 or over [9] on polling day were entitled to vote in the local elections. [10] A person with two homes (such as a university student having a term-time address and living at home during holidays) was able to register to vote at both addresses as long as the addresses were not in the same electoral area, and was able to vote in the local elections for the two different local councils. [11]
In certain councils, there was a trial system in place where photo ID was required to vote. These councils were: Swindon, Gosport, Woking, Bromley, and Watford. [12] An estimated 4,000 electors were turned away from polling stations across these trial areas as a result of not having the appropriate form of ID. [13]
The number of councils controlled by each party following the election are shown in the table below. Both Labour and the Liberal Democrats made modest gains in terms of their respective number of councillors, whereas the Conservatives made a net loss of 35 seats. UKIP lost nearly all of the 126 seats they were defending, with only 3 councillors elected. [14]
Party | Councillors | Councils | Votes | Projected national equivalent [n 1] | ||||
---|---|---|---|---|---|---|---|---|
Number | Change | Number | Change | Number [15] | Share | |||
Labour | 2,353 | 79 | 74 | 3,154,753 | 41.2% | 35% | ||
Conservative | 1,332 | 35 | 46 | 3 | 2,444,204 | 31.9% | 35% | |
Liberal Democrats | 542 | 76 | 9 | 4 | 1,067,660 | 13.9% | 16% | |
Green | 39 | 8 | 0 | 500,580 | 6.5% | 14% | ||
UKIP | 3 | 123 | 0 | 101,866 | 1.3% | |||
Independent | 96 | 17 | 0 | 392,139 | 5.2% | |||
Residents | 44 | 3 | 0 | |||||
Liberal | 1 | 1 | 0 | |||||
PATH | 1 | 1 | 0 | |||||
Harold Hill Independent | 1 | 1 | 0 | |||||
No overall control | — | 21 | 1 | — | — | — | ||
The following table shows the aggregate results for the 32 councils that were up for election in London.
Party | Councillors | Councils | |||
---|---|---|---|---|---|
Number | Change† | Number | Change | ||
Labour | 1,128 | 67 | 21 | 1 | |
Conservative | 508 | 92 | 7 | 2 | |
Liberal Democrats | 152 | 34 | 3 | 2 | |
Residents | 25 | 2 | 0 | ||
Green | 11 | 7 | 0 | ||
Independent | 7 | 5 | 0 | ||
UKIP | 0 | 9 | 0 | ||
PATH | 1 | 1 | 0 | ||
Harold Hill Independent | 1 | 1 | 0 | ||
No overall control | — | 1 | 1 | ||
†Due to boundary changes, the figures for seat losses/gains are notional changes calculated by the BBC, and do not match up precisely to the London-wide results in 2014.
The following table shows the aggregate results for the 118 councils that were up for election outside of London.
Party | Councillors | Councils | |||
---|---|---|---|---|---|
Number | Change | Number | Change | ||
Labour | 1,225 | 12 | 53 | 1 | |
Conservative | 824 | 57 | 39 | 1 | |
Liberal Democrats | 390 | 42 | 6 | 2 | |
Independent | 89 | 12 | 0 | ||
Green | 28 | 1 | 0 | ||
Residents | 21 | 0 | |||
UKIP | 3 | 114 | 0 | ||
Liberal | 1 | 1 | 0 | ||
No overall control | — | 20 | |||
Only four councils switched from a majority for one party to another. The Conservatives gained Redditch from Labour, and lost control of three councils to the Liberal Democrats: Kingston upon Thames, Richmond upon Thames and South Cambridgeshire. The Liberal Democrats also gained Three Rivers District Council from no overall control. Labour gained a majority on three councils that had been under no overall control (Kirklees, Plymouth and Tower Hamlets) while losing their majority on two (Derby and Nuneaton and Bedworth). The Conservatives gained a majority on one council that had been under no overall control (Basildon) while losing their majority on two (Mole Valley and Trafford). [16]
Labour won the inaugural mayoral election for the Sheffield City Region. Five other mayoral elections saw no change in the winning party: Labour held four and the Liberal Democrats held one.
This was the first set of local elections since the 2017 general election. Most of the seats up for election had last been contested in the 2014 local elections.
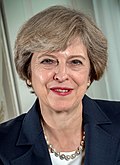
Because the group of local councils varies with each cycle of local elections, the BBC and other analysts calculated a projected national vote share, which aims to assess what the council results indicate the UK-wide vote would be if the results were repeated at a general election. The BBC's estimate put Labour on 35% of the vote (up 8% since 2017), the Conservatives on 35% (down 3%), the Liberal Democrats on 16% (down 2%). [17] In the May 2017 local elections, the projected national voteshare was 38% for the Conservatives, 27% for Labour, 18% for the Liberal Democrats and 5% for UKIP. When votes were still being counted, media reports widely described the result as "mixed" for both Labour and the Conservatives. [18] The results suggested that support for the parties had not moved much since the general election 11 months earlier. [19] Some reports considered the results a relief for Theresa May and the Conservatives. [20] [21]
Ben Margulies, a research fellow at the University of Warwick, noted how the United Kingdom Independence Party's collapse in vote share directly benefited the Conservatives as they committed to exiting the European Union. Margulies stated that the Conservatives' position with the electorate will "remain perched on a precipice". [22] Matthew Mokhefi-Ashton, a politics lecturer at Nottingham Trent University, argued that Labour had set their expectations too high and thus made the actual result look disappointing by comparison. [23] David Cutts, a professor of political science at the University of Birmingham, described the Liberal Democrats' performance in the election as "underwhelming" in contrast to the media response, arguing that the party only made moderate gains in their strongholds from before the Liberal-Conservative coalition and council areas that were seen as "Strong Remain" and "Strong Leave". Cutts argued that the next local elections in England are a greater test of their stability as they feature substantially more strongholds. [24]
All seats in the 32 London borough councils were up for election.
4 metropolitan boroughs had all of their seats up for election following boundary changes.
Council | Previous control | Result | ||
---|---|---|---|---|
Birmingham | Labour | Labour | ||
Leeds | Labour | Labour [54] | ||
Manchester | Labour | Labour [55] | ||
Newcastle upon Tyne | Labour | Labour [56] | ||
One third of the seats in 30 metropolitan boroughs were up for election:
One unitary authority had all of its seats up for election following boundary changes.
Council | Previous control | Result | ||
---|---|---|---|---|
Kingston upon Hull | Labour | Labour [86] |
One third of the council seats were up for election in 16 unitary authorities.
Council | Previous control | Result | ||
---|---|---|---|---|
Blackburn with Darwen | Labour | Labour [87] | ||
Derby | Labour | No overall control (Con with UKIP and Lib Dem support) [88] [89] | ||
Halton | Labour | Labour [90] | ||
Hartlepool | Labour | Labour [91] | ||
Milton Keynes | No overall control (Labour with Lib Dem support) | No overall control (Labour with Lib Dem support) [92] [93] | ||
North East Lincolnshire | No overall control (Lab minority) | No overall control (Lab with Lib Dem support) [94] [95] | ||
Peterborough | No overall control (Conservative minority) | Conservative [96] | ||
Plymouth | Conservative | Labour [97] | ||
Portsmouth | No overall control (Conservative minority) | No overall control (Lib Dem with Lab support) [98] [99] | ||
Reading | Labour | Labour [100] | ||
Slough | Labour | Labour [101] | ||
Southampton | Labour | Labour [102] | ||
Southend-on-Sea | Conservative | Conservative [103] | ||
Swindon | Conservative | Conservative [104] | ||
Thurrock | No overall control (Conservative minority) | No overall control [105] (Conservative minority) | ||
Wokingham | Conservative | Conservative [106] |
Seven non-metropolitan districts have all of their seats up for election.
Council | Previous control | Result | ||
---|---|---|---|---|
Eastleigh | Liberal Democrats | Liberal Democrats [107] | ||
Harrogate | Conservative | Conservative [108] | ||
Hastings | Labour | Labour [109] | ||
Huntingdonshire | Conservative | Conservative [110] | ||
Newcastle-under-Lyme | No overall control (Conservative minority) | No overall control [111] (Conservative minority) | ||
South Cambridgeshire | Conservative | Liberal Democrats [112] | ||
South Lakeland | Liberal Democrats | Liberal Democrats [113] | ||
Six non-metropolitan districts have half of their seats up for election.
Council | Previous control | Result | ||
---|---|---|---|---|
Adur | Conservative | Conservative [114] | ||
Cheltenham | Liberal Democrats | Liberal Democrats [115] | ||
Fareham | Conservative | Conservative [116] | ||
Gosport | Conservative | Conservative [117] | ||
Nuneaton and Bedworth | Labour | No overall control (Lab minority) [118] [119] | ||
Oxford | Labour | Labour [120] |
54 district councils had one third of their seats up for election. Weymouth and Portland originally had elections scheduled for 2018, but the elections were postponed indefinitely following a decision to merge the council into a unitary Dorset Council from 2019 onwards. [121] [122]
These were the last elections to Daventry District Council, following the decision to abolish it along with Northamptonshire County Council and its 7 district councils into two unitary authorities in 2020.
There were five local authority mayoral elections and one metropolitan mayoral election.
Combined Authority | New mayor | |
---|---|---|
Sheffield City Region (South Yorkshire) | Dan Jarvis (Lab) | |
Council | Previous mayor | New mayor | ||
---|---|---|---|---|
Hackney | Philip Glanville (Lab) | Philip Glanville (Lab) | ||
Lewisham | Sir Steve Bullock (Lab) | Damien Egan (Lab) | ||
Newham | Sir Robin Wales (Lab) | Rokhsana Fiaz (Lab) | ||
Tower Hamlets | John Biggs (Lab) | John Biggs (Lab) | ||
Watford | Dorothy Thornhill (Lib Dem) | Peter Taylor (Lib Dem) |
The Metropolitan Borough of Wirral is a metropolitan borough of Merseyside, in North West England. It has a population of 322,453 (2022), and encompasses 62 square miles (161 km2) of the northern part of the Wirral Peninsula. Major settlements include Birkenhead, Wallasey, Bebington, Heswall, Hoylake and West Kirby. Wirral is England's westernmost metropolitan borough, faced by the city of Liverpool to the northeast over the River Mersey.
The 2003 United Kingdom local elections were held on Thursday 1 May 2003, the same day as the Scottish Parliamentary and the Welsh Assembly elections. There were local elections for all councils in Scotland and in most of England. There were no local elections in Wales, Northern Ireland or London.
The 2006 United Kingdom local elections were held on Thursday 4 May 2006.
The 2006 St Helens Metropolitan Borough Council election took place on 4 May 2006 to elect members of St Helens Metropolitan Borough Council in Merseyside, England. One third of the council was up for election and the council stayed under no overall control.
The 2011 United Kingdom local elections was held on Thursday May 5. In England, direct elections were held in all 36 Metropolitan boroughs, 194 Second-tier district authorities, 49 unitary authorities and various mayoral posts, meaning local elections took place in all parts of England with the exception of seven unitary authorities, and seven districts and boroughs. For the majority of English districts and the 25 unitary authorities that are elected "all out" these were the first elections since 2007. In Northern Ireland, there were elections to all 26 local councils. Elections also took place to most English parish councils.
The 1994 United Kingdom local elections were held on Thursday 5 May 1994. The results showed a continued decline for the governing Conservatives — who were now in their 15th successive year of government at Westminster — with the third-placed party, the Liberal Democrats, as the main beneficiaries.
The 1991 United Kingdom local elections were held on Thursday 2 May 1991. The results were a setback for the governing Conservative Party, who were left with their lowest number of councillors since 1973, though their popular vote was an improvement from the 1990 local elections.
The 2006 Solihull Metropolitan Borough Council election took place on 4 May 2006 to elect members of Solihull Metropolitan Borough Council in the West Midlands, England. One third of the council was up for election and the Conservative Party stayed in overall control of the council.
The 2010 Sunderland Council election took place on 6 May 2010 to elect members of Sunderland Metropolitan Borough Council in Tyne and Wear, England. One third of the council was up for election and the Labour Party stayed in overall control of the council. The election took place on the same day as the 2010 General Election.
The 2013 United Kingdom local elections took place on Thursday 2 May 2013. Elections were held in 35 English councils: all 27 non-metropolitan county councils and eight unitary authorities, and in one Welsh unitary authority. Direct mayoral elections took place in Doncaster and North Tyneside. These elections last took place on the 4 June 2009 at the same time as the 2009 European Parliament Elections, except for County Durham, Northumberland and the Anglesey where elections last took place in 2008.
The 2014 United Kingdom local elections were held on 22 May 2014. Usually these elections are held on the first Thursday in May but were postponed to coincide with the 2014 European Parliament Elections. Direct elections were held for all 32 London boroughs, all 36 metropolitan boroughs, 74 district/borough councils, 19 unitary authorities and various mayoral posts in England and elections to the new councils in Northern Ireland.
The 2016 United Kingdom local elections held on Thursday 5 May 2016 were a series of local elections which were held in 124 local councils and also saw 4 mayoral elections in England which also coincided with elections to the Scottish Parliament, the Welsh Assembly, the Northern Ireland Assembly, the London Assembly, the London mayoral election and the England and Wales Police and crime commissioners. By-elections for the Westminster seats of Ogmore and Sheffield Brightside and Hillsborough were also held. These proved to be David Cameron's last local elections as leader of the Conservative Party and Prime Minister as he resigned two months later following the defeat of Remain in the referendum on Britain's continuing membership of the European Union which was held seven weeks later.
The 2017 United Kingdom local elections were held on Thursday 4 May 2017. Local elections were held across Great Britain, with elections to 35 English local authorities and all councils in Scotland and Wales.
The 2019 United Kingdom local elections took place on Thursday 2 May 2019, with 248 English local councils, six directly elected mayors in England, and all 11 local councils in Northern Ireland being contested.
The 2022 London local elections took place on 5 May 2022, as part of the 2022 United Kingdom local elections. All London borough councillor seats were up for election. Mayoral elections took place in Hackney, Lewisham, Newham and Tower Hamlets, with Croydon electing a mayor for the first time following a local referendum in October 2021.
The 2022 United Kingdom local elections took place on Thursday 5 May 2022. These included elections for all London borough councils, for all local authorities in Wales and Scotland. Most seats in England were last up for election in 2018 and in Scotland and Wales in 2017. The elections coincided with the 2022 Northern Ireland Assembly election. In 91 cases, most of them in Wales, council seats were uncontested, each having only one candidate. Three seats in Scotland remained unfilled as no one nominated to fill them.
The 2022 Birmingham City Council election took place on 5 May 2022, with all 101 council seats up for election across 37 single-member and 32 two-member wards. The election was held alongside other local elections across Great Britain and town council elections in Sutton Coldfield.
The 2022 City of Bradford Metropolitan District Council election took place on 5 May 2022 to elect one third of councillors to the City of Bradford Metropolitan District Council. The election took place at the same time as other local elections across the United Kingdom.
The 2022 Oldham Metropolitan Borough Council election took place on 5 May 2022. One third—20 out of 60—of councillors on Oldham Council was elected. The election took place alongside other local elections across the United Kingdom.