2014 United Kingdom local elections

Last updated

2014 United Kingdom local elections
Flag of the United Kingdom.svg
  2013 22 May 2014 2015  

All 32 London boroughs, all 36 metropolitan boroughs,
19 out of 55 unitary authorities, 74 out of 201 district councils,
all 11 Northern Irish councils, and 5 directly elected mayors
 First partySecond partyThird party
  Ed Miliband election infobox.jpg David Cameron official.jpg Nick Clegg official portrait.jpg
Leader Ed Miliband David Cameron Nick Clegg
Party Labour Conservative Liberal Democrats
Leader since25 September 20106 December 200518 December 2007
Popular vote31% [lower-alpha 1] 29%13%
SwingIncrease2.svg2% [lower-alpha 2] Increase2.svg4%Decrease2.svg1%
Councils82416
Councils +/–Increase2.svg6Decrease2.svg11Decrease2.svg2
Councillors2,1211,364427
Councillors +/–Increase2.svg324Decrease2.svg236Decrease2.svg310

 Fourth party
  Nigel Farage MEP 1, Strasbourg - Diliff (cropped).jpg
Leader Nigel Farage
Party UKIP
Leader since5 November 2010
Popular vote17%
SwingDecrease2.svg5%
Councils0
Councils +/–Steady2.svg
Councillors166 [lower-alpha 3]
Councillors +/–Increase2.svg163 [lower-alpha 3]

UK council results 2014.svg
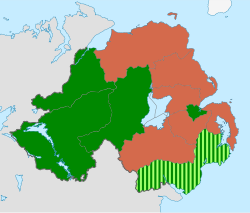
Map showing results of English and Northern Irish local elections, 2014. Council control in England and in Northern Ireland the largest parties are shown (where all councils had no overall control). Black represents No Overall Control, white represents areas that did not hold an election, blue represents the Conservative Party, red represents the Labour Party and gold represents the Liberal Democrats. Areas in light red represent the Democratic Unionist Party. Dark green represents Sinn Féin and light green represents the SDLP. Areas shown in grey are outside England and Northern Ireland

The 2014 United Kingdom local elections were held on 22 May 2014. Usually these elections are held on the first Thursday in May but were postponed to coincide with the 2014 European Parliament Elections. Direct elections were held for all 32 London boroughs, all 36 metropolitan boroughs, 74 district/borough councils, 19 unitary authorities and various mayoral posts in England and elections to the new councils in Northern Ireland.

Contents

All registered electors (British, Irish, Commonwealth and European Union citizens) who were aged 18 or over on the day of the election were entitled to vote in the local elections.

The BBC's projected national vote share (PNV) put Labour on 31%, the Conservatives on 29%, UKIP on 17%, and the Liberal Democrats on 13%. [1] Rallings and Thrasher of Plymouth University's national equivalent vote share (NEV) estimated 31% for Labour, 30% for the Conservatives, 18% for UKIP, and 11% for the Liberal Democrats. [2]

For the fourth year running, the Labour Party enjoyed the largest share of the vote in local elections, but its share of the vote was its smallest since 2010. UKIP, which topped the same day's European Parliament elections, finished third in vote share, claiming council seats from Labour, the Conservatives and Liberal Democrats.

Overview of results

UK-wide results

PartyCouncillorsCouncils
NumberChangeNumberChange
Labour 2,121Increase2.svg32482Increase2.svg5
Conservative 1,364Decrease2.svg23641Decrease2.svg11
Liberal Democrats 427Decrease2.svg3106Decrease2.svg2
UKIP 166Increase2.svg1630Steady2.svg
DUP 130Decrease2.svg150Steady2.svg
Sinn Féin 105Decrease2.svg100Steady2.svg
Ulster Unionist 88Increase2.svg110Steady2.svg
Independent 71Increase2.svg180Steady2.svg
SDLP 66Decrease2.svg10Steady2.svg
Residents 53Increase2.svg140Steady2.svg
Green 38Increase2.svg180Steady2.svg
Alliance 32Decrease2.svg20Steady2.svg
Tower Hamlets First 18Increase2.svg180Steady2.svg
TUV 13Increase2.svg100Steady2.svg
Green (NI) 4Increase2.svg10Steady2.svg
PUP 4Increase2.svg10Steady2.svg
NI21 1Increase2.svg10Steady2.svg
Liberal 2Decrease2.svg20Steady2.svg
BNP 1Decrease2.svg10Steady2.svg
Health Concern 1Decrease2.svg20Steady2.svg
No overall control n/an/a43Increase2.svg8

England results

PartyCouncillorsCouncils
NumberChangeNumberChange
Labour 2,121Increase2.svg32482Increase2.svg5
Conservative 1,364Decrease2.svg23641Decrease2.svg11
Liberal Democrats 427Decrease2.svg3106Decrease2.svg2
UKIP 163Increase2.svg1610Steady2.svg
Independent 71Increase2.svg180Steady2.svg
Residents 53Increase2.svg140Steady2.svg
Green 38Increase2.svg180Steady2.svg
Tower Hamlets First 18Increase2.svg180Steady2.svg
Liberal 2Decrease2.svg20Steady2.svg
BNP 1Decrease2.svg10Steady2.svg
Health Concern 1Decrease2.svg20Steady2.svg
No overall control n/an/a32Increase2.svg8

The Respect Party lost both their remaining councillors. [3]

English Councils - shift of control

This table depicts how the control of local councils shifted in this election.

The data along the diagonal represents no shift in control in that number of councils: for example, Chorley was among the solid colour no change 73 Labour controlled councils. The other cells represent the shifts of control: for example, Harrow was one of five councils of which Labour gained control from No Overall Control. The intensity of the colour in a table cell other than the diagonal reflects the relative number of losses in council control suffered by each party.

after electionN.O.C.LabourCons.Lib.
Dem.
Old
total
losses
before election
No Overall Control195--24 5
Labour473--77 4
Conservative8440-5212
Liberal Democrats1-168 2
New total3282416161-
gains+13+ 9 + 1---
Net change+ 8+ 5−11− 2--

Last updated at 11:30:10 on 27 May 2014 [4]

Northern Ireland results

PartyCouncillors % of councillorsFirst preference votes % of FP votes
2011 [5] 2014+/-2011 [5] 2014+/-2011 [6] 2014 [7] +/-20112014+/-
DUP 145130Decrease2.svg1531.4%28.1%Decrease2.svg3.3%179,436144,928Decrease2.svg27.2%23.1%Decrease2.svg4.1%
Sinn Féin 115105Decrease2.svg1024.9%22.7%Decrease2.svg2.2%163,712151,137Decrease2.svg24.8%24.1%Decrease2.svg0.7%
Ulster Unionist 7788Increase2.svg1116.7%19.0%Increase2.svg2.3%100,643101,385Increase2.svg15.2%16.1%Increase2.svg0.9%
SDLP 6766Decrease2.svg114.5%14.2%Decrease2.svg0.3%99,32585,237Decrease2.svg15.0%13.6%Decrease2.svg1.4%
Alliance 3432Decrease2.svg27.4%6.9%Decrease2.svg0.5%48,85941,769Decrease2.svg7.4%6.7%Decrease2.svg0.7%
TUV 313Increase2.svg100.6%2.8%Increase2.svg2.2%13,07928,310Increase2.svg2.0%4.5%Increase2.svg2.5%
PUP 14Increase2.svg30.2%0.8%Increase2.svg0.6%3,85812,753Increase2.svg0.6%2.0%Increase2.svg1.4%
Green (NI) 14Increase2.svg30.2%0.8%Increase2.svg0.6%6,3175,515Decrease2.svg1.0%0.8%Decrease2.svg0.2%
UKIP 13Increase2.svg20.2%0.6%Increase2.svg0.4%2,5509,311Increase2.svg0.4%1.4%Increase2.svg1.0%
NI21 01Increase2.svg10.0%0.2%Increase2.svg0.2%011,495Increase2.svg0.0%1.8%Increase2.svg1.8%
People Before Profit 01Increase2.svg10.0%0.2%Increase2.svg0.2%1,7211,923Increase2.svg0.3%0.3%Increase2.svg0.0%
NI Conservatives 00Steady2.svg0.0%0.0%Steady2.svg1,3212,527Increase2.svg0.2%0.4%Increase2.svg0.2%
éirígí 00Steady2.svg0.0%0.0%Steady2.svg2,0621,756Decrease2.svg0.3%0.3%Decrease2.svg0.0%
Workers' Party 00Steady2.svg0.0%0.0%Steady2.svg760985Increase2.svg0.10.2%Increase2.svg0.1%
Fermanagh Against Fracking00Steady2.svg0.0%0.0%Steady2.svg0555Increase2.svg0.0%0.1%Increase2.svg0.1%
Republican Network for Unity 00Steady2.svg0.0%0.0%Steady2.svg0502Increase2.svg0.0%0.1%Increase2.svg0.1%
Community Partnership00Steady2.svg0.0%0.0%Steady2.svg800388Decrease2.svg0.10.1%Decrease2.svg0.0%
Socialist Party 00Steady2.svg0.0%0.0%Steady2.svg682272Decrease2.svg0.1%0.0%Decrease2.svg0.1%
BNP 00Steady2.svg0.0%0.0%Steady2.svg491174Decrease2.svg0.1%0.0%Decrease2.svg0.1%
Democracy First00Steady2.svg0.0%0.0%Steady2.svg0173Increase2.svg0.0%0.0%Increase2.svg0.0%
Others00Steady2.svg0.0%0.0%Steady2.svg2,1420Decrease2.svg0.3%0.0%Decrease2.svg0.3%
Independent 1815Decrease2.svg 33.9%3.2%Decrease2.svg0.7%32,15126,682Decrease2.svg4.9%4.2%Decrease2.svg0.7%
Total462462Steady2.svg100%100%Steady2.svg660,631627,777Decrease2.svg100%100%Steady2.svg

London boroughs

All seats in the 32 London Borough Councils were up for election.

Summary of results

Party [8] Votes won % votesChangeSeats % seatsChangeCouncilsChange
Labour 944,96737.6+5.11,06057.3+18520+3
Conservative 663,84726.4−5.361233.1−1059−2
Liberal Democrats 267,76910.6−11.81166.3−1301−1
Green 246,8059.8+3.240.2+20±0
UKIP 239,0019.5+8.4120.6+120±0
Others152,6846.1+0.4472.5+260±0
No overall control 2−6

Individual council results

CouncilPrevious controlResult
Con Lab LD UKIP Green Ind Others
Barking and Dagenham Labour Labour 51
Barnet Conservative Conservative 32271
Bexley Conservative Conservative 45153
Brent Labour Labour 6561
Bromley Conservative Conservative 5172
Camden Labour Labour 124011
Croydon Conservative Labour 3040
Ealing Labour Labour 12534
Enfield Labour Labour 2241
Greenwich Labour Labour 843
Hackney Labour Labour 4503
Hammersmith and Fulham Conservative Labour 2026
Haringey Labour Labour 489
Harrow No overall control Labour 263412
Havering Conservative No overall control 221724
Hillingdon Conservative Conservative 4223
Hounslow Labour Labour 1149
Islington Labour Labour 471
Kensington and Chelsea Conservative Conservative 37121
Kingston upon Thames Liberal Democrats Conservative 28218
Lambeth Labour Labour 3591
Lewisham Labour Labour 531
Merton No overall control Labour 203613
Newham Labour Labour 60
Redbridge No overall control Labour 25353
Richmond upon Thames Conservative Conservative 3915
Southwark Labour Labour 24813
Sutton Liberal Democrats Liberal Democrats 945
Tower Hamlets Labour No overall control 42018
Waltham Forest Labour Labour 1644
Wandsworth Conservative Conservative 4119
Westminster Conservative Conservative 4416
Totals6121,052118124245
Councils whose control changed hands highlighted thus

Harrow's Council was elected in 2010 with a Labour majority but divisions within this majority in 2013 led to a coalition struck between the Conservatives and the Independent Labour Group (formed of eight ex-Labour councillors). Conservatives withdrew their support for Independent Labour on 16 September 2013 leading to a brief Conservative minority administration.

Metropolitan boroughs

One third of the seats in all 36 Metropolitan Boroughs were up for election (showing those elected and each party's total in the new council).

CouncilPrevious controlResult
ConLabLDUKIPOthers
Barnsley Labour Labour 1, 418, 522, 7
Birmingham Labour Labour 13, 3122, 775, 12
Bolton Labour Labour 5, 1513, 401, 32, 2
Bradford Labour Labour 7, 2117, 463, 81, 11,3Grn
2,11Ind
Bury Labour Labour 2, 1115, 380, 10, 1
Calderdale No overall control No overall control
(Lab minority, then
Con-Ind minority)
6, 199, 251, 61, 1
Coventry Labour Labour 6, 1113, 43
Doncaster Labour Labour 3, 815, 481, 12, 6
Dudley Labour Labour 7, 2010, 407, 90,1Grn
0,2Ind
Gateshead Labour Labour 18, 554, 11
Kirklees No overall control No overall control
(Lab minority)
6, 1810, 325, 111,5Grn
1,3Ind
Knowsley Labour Labour 21, 63
Leeds Labour Labour 6, 1920, 624, 91,3Grn
2,6Ind
Liverpool Labour Labour 27, 790, 32,4Grn
1,4Ind
Manchester Labour Labour 33, 951, 1
Newcastle upon Tyne Labour Labour 18, 528, 240, 2
North Tyneside Labour Labour 3, 1215, 441, 4
Oldham Labour Labour 0, 214, 453, 102, 21, 1
Rochdale Labour Labour 3, 1116, 481, 1
Rotherham Labour Labour 0, 211, 5010, 100, 1
St Helens Labour Labour 1, 314, 431, 2
Salford Labour Labour 3, 817, 52
Sandwell Labour Labour 0, 123, 701, 1
Sefton Labour Labour 2, 713, 406, 171, 2
Sheffield Labour Labour 18, 606, 173, 3 2,4Grn
Solihull Conservative Conservative 9, 290, 23, 81, 1 4,10Grn
South Tyneside Labour Labour 0, 117, 490, 11, 3
Stockport No overall control No overall control
(Lib Dem minority)
4, 107, 229, 281, 3
Sunderland Labour Labour 3, 821, 631, 4
Tameside Labour Labour 2, 617, 51
Trafford Conservative Conservative 12, 339, 271, 3
Wakefield Labour Labour 1, 617, 542, 21, 1
Walsall No overall control No overall control
(Lab minority)
6, 219, 300, 33, 31, 3
Wigan Labour Labour 1, 223, 621, 11
Wirral Labour Labour 8, 2211, 372, 6 1,1Grn
Wolverhampton Labour Labour 4, 1215, 450, 21, 1
Totals117,
373
563,
1,741
62,
189
33,
37
28,
104

Unitary authorities

Two unitary authorities had all of their seats up for election following boundary changes.

CouncilPrevious controlResult
ConLabLDUKIP
Milton Keynes No overall control No overall control (Lab minority)1825131
Slough Labour Labour 8331

One third of the council seats were up for election in 17 unitary authorities (elected and totals shown).

Council Previous controlResult
ConLabLDUKIPIndOthers
Blackburn with Darwen  Labour won the most seats4161
Labour Labour 12484
Bristol   61061-3 Green
No overall control No overall control 153116116 Green
Derby   6831-
Labour Labour 1427721
Halton  Labour won the most seats161
Labour Labour 2513
Hartlepool  Labour won the most seats1622
Labour Labour 31929
Kingston upon Hull  Labour won the most seats1127--
Labour Labour 2371514
North East Lincolnshire   3327
Labour No overall control
(Labour minority)
102138
Peterborough   102332
Conservative No overall control
(Conservative minority)
28124310
Plymouth   973
Labour Labour 24303
Portsmouth   5-36-
Liberal Democrats No overall control (Con
with UKIP & Lab support)
1241961
Reading  Labour won the most seats21112 Green
Labour Labour 103123 Green
Southampton   881
Labour Labour 18282
Southend-on-Sea   44154-
Conservative No overall control
(Ind/Lab/LD coalition)
1995510
Swindon  Conservatives won most seats1181
Conservative Conservative 30234
Thurrock   565-
Labour No overall control
(Labour minority)
182362
Warrington  Labour won the most seats1155
Labour Labour 34311
Wokingham  Conservatives won most seats1512- [9]
Conservative Conservative 44172
Totals seats won in May 201491133363395 Green
Total membership of new councils26443810037429 Green
source: BBC News, retrieved June 2014ConsLabLDUKIPIndothers

Non-metropolitan districts

Whole council

CouncilPrevious controlResult
ConLabLDOthers
Hart No overall control No overall control 14910
Three Rivers Liberal Democrats Liberal Democrats 10323

Half of council

CouncilPrevious controlResult
ConLabLDUKIPOthers
Adur Conservative Conservative 9, 200, 14, 61, 2
Cheltenham Liberal Democrats Liberal Democrats 4, 1113, 242, 5
Fareham Conservative Conservative 11, 233, 51, 11, 2
Gosport Conservative Conservative 12, 212, 62, 60, 1
Hastings Labour Labour 5, 811, 24
Nuneaton and Bedworth Labour Labour 2, 314, 281,2Grn
0,1Ind
Oxford Labour Labour 17, 335, 83,6Grn
0,1Ind
Totals43, 8644, 9223, 435, 87, 19

Third of council

CouncilPrevious controlResult
ConLabLDUKIPOthers
Amber Valley Conservative Labour 4, 2111, 230, 1
Basildon Conservative No overall control Con minority4, 170, 100, 111, 120, 2
Basingstoke and Deane No overall control No overall control Con minority8, 288, 173, 91, 22, 4
Bassetlaw Labour Labour 3, 1112, 341, 3
Brentwood Conservative No overall control LibDem/Ind/Lab coalition6, 181, 35, 110, 5
Broxbourne Conservative Conservative 9, 261, 31, 1
Burnley Labour Labour 1, 510, 284, 12
Cambridge No overall control Labour 0, 110, 254, 141, 2
Cannock Chase Labour Labour 1, 66, 251, 24, 61, 2
Carlisle Labour Labour 7, 199, 290, 21, 2
Castle Point Conservative No overall control Con minority20, 205, 50, 16
Cherwell Conservative Conservative 12, 404, 71, 20, 1
Chorley Labour Labour 3, 1313, 321, 2
Colchester No overall control No overall control LibDem/Lab/Ind coalition8, 232, 89, 251, 4
Craven Conservative Conservative 7, 180, 22, 10
Crawley Conservative Labour 5, 168, 200, 1
Daventry Conservative Conservative 10, 280, 40, 12, 3
Eastleigh Liberal Democrats Liberal Democrats 2, 413, 40
Elmbridge Conservative Conservative 12, 332, 64, 21
Epping Forest Conservative Conservative 0, 370, 12, 30, 20,1Grn
5,14Ind
Exeter Labour Labour 2, 1010, 271, 3
Gloucester No overall control No overall control Con minority8, 183, 94, 9
Great Yarmouth Labour No overall control Lab minority2, 141, 1510, 10
Harlow Labour Labour 3, 114, 175, 5
Harrogate Conservative Conservative 9, 348, 152, 5
Havant Conservative Conservative 10, 311, 41, 12, 2
Hertsmere Conservative Conservative 11, 342, 5
Huntingdonshire Conservative Conservative 11, 340, 11, 63, 70,4Grn
2,3Ind
Hyndburn Labour Labour 2, 87, 230, 22, 2
Ipswich Labour Labour 4, 1012, 351, 3
Lincoln Labour Labour 2, 69, 27
Maidstone Conservative No overall control Con minority5, 251, 29, 194, 41, 5
Mole Valley No overall control No overall control 6, 194, 151, 13, 6
Newcastle-under-Lyme Labour Labour 5, 1611, 325, 60,50,1Grn
North Hertfordshire Conservative Conservative 12, 335, 120, 30, 1
Norwich Labour Labour 8, 211, 35,15Grn
Pendle No overall control No overall control 5, 197, 183, 111, 1
Preston Labour Labour 6, 197, 322, 50, 1
Purbeck No overall control No overall control Con minority6, 122, 110, 1
Redditch Labour Labour 3, 96, 172, 20, 1
Reigate and Banstead Conservative Conservative 12, 371, 21, 11,3Grn
2,8Ind
Rochford Conservative Conservative 6, 261, 11, 33, 31,2Grn
1,4Ind
Rossendale Labour Labour 5, 106, 241, 2
Rugby Conservative Conservative 7, 233, 103, 72, 2
Runnymede Conservative Conservative 12, 350, 12, 6
Rushmoor Conservative Conservative 8, 244, 121, 3
St Albans No overall control No overall control Con minority12, 293, 107, 170,1Grn
0,1Ind
South Cambridgeshire Conservative Conservative 10, 350, 17, 132, 8
South Lakeland Liberal Democrats Liberal Democrats 2, 150, 315, 33
Stevenage Labour Labour 2, 234, 343, 3
Stratford-on-Avon Conservative Conservative 15, 350, 13, 120, 5
Stroud No overall control No overall control Lab/Green/LibDem coalition10, 226, 200, 22,6Grn
0,1Ind
Tamworth Conservative Conservative 6, 163, 121, 10, 1
Tandridge Conservative Conservative 13, 341, 60, 2
Tunbridge Wells Conservative Conservative 14, 381, 31, 30, 20, 2
Watford Liberal Democrats Liberal Democrats 1, 14, 117, 231,1Grn
Welwyn Hatfield Conservative Conservative 13, 314, 141, 20, 1
West Lancashire Conservative No overall control Con minority11, 278, 27
West Oxfordshire Conservative Conservative 15, 401, 51, 30, 1
Weymouth and Portland No overall control No overall control Lab/LibDem coalition4, 115, 151, 61, 11, 1
Winchester No overall control No overall control Con minority11, 281, 37, 250, 1
Woking Conservative Conservative 7, 231, 13, 111, 1
Worcester No overall control No overall control Con minority6, 176, 160, 10,1Grn
Worthing Conservative Conservative 9, 271, 71, 11,1Grn
0,1Ind
Wyre Forest No overall control No overall control 5, 152, 95, 51, 13
Totals446, 1,348283, 796163, 42166, 8847, 211

† Elected councillors will hold office for one year only as Purbeck District will adopt whole council elections from 2015. [10] [11]

Mayoral elections

There were five mayoral elections.

Local AuthorityPrevious MayorNew Mayor
Hackney Jules Pipe (Labour) Jules Pipe (Labour)
Lewisham Sir Steve Bullock (Labour) Sir Steve Bullock (Labour)
Newham Robin Wales (Labour) Robin Wales (Labour)
Tower Hamlets Lutfur Rahman (Independent) Lutfur Rahman (Tower Hamlets First)
Watford Dorothy Thornhill (Liberal Democrat) Dorothy Thornhill (Liberal Democrat)

In Copeland, there was a referendum to establish a post of directly elected mayor, which passed.

Northern Ireland

These were the first elections to the 11 new 'super-councils' in Northern Ireland, following a reorganisation. These will operate in shadow form for one year, with the current 26 councils existing in parallel. [12]

Sinn Féin (dark green) won more seats than any other party in (1) Belfast, (9) Mid-Ulster, (10) Derry & Strabane and (11) Fermanagh & Omagh. Sinn Féin and the SDLP elected more councillors (14 each) than did any other party in (5) Newry, Mourne & Down . The Democratic Unionist Party (dark orange) won more seats than any other party in each of the other six councils, and won as many as all the other parties combined in (4) Lisburn & Castlereagh.

The eleven new districts NI11w.jpg
The eleven new districts
Leading party in each new council Northern Ireland local elections, 2014.svg
Leading party in each new council

Party composition of new councils

The party abbreviations in this table are explained in the total-vote table that follows it.

Seats won [7]
CouncilTotal
seats
SF SDLP Alliance UUP DUP TUV Ind Others
3 Antrim and Newtownabbey 4034412152
6 Armagh, Banbridge & Craigavon 4186121311 UKIP
1 Belfast City 60197871315 *
8 Causeway Coast and Glens 407611011311 PUP
10 Derry and Strabane 401610284
11 Fermanagh and Omagh 40178951
4 Lisburn and Castlereagh 403782011 NI21
7 Mid and East Antrim 40313916521 UKIP
9 Mid-Ulster 40186781
5 Newry, Mourne and Down 41141423431 UKIP
2 North Down and Ards 4017917123 Green(NI)
Total462105663288130131513
1* Belfast other: 3 Progressive Unionist, 1 Green Party Northern Ireland & 1 People Before Profit
source: [7]

Votes cast

These elections used the Single Transferable Vote method of proportional representation. Votes and percentages for each party reflect the first preference on each ballot.

PartyCouncillors % of councillorsFirst preference votes % of FP votes
2011 (notional) [13] 2014+/-2011 (notional)2014+/-2011 [6] 2014 [7] +/-20112014+/-
DUP 145130Decrease2.svg1531.4%28.1%Decrease2.svg3.3%179,436144,928Decrease2.svg27.2%23.1%Decrease2.svg4.1%
Sinn Féin 115105Decrease2.svg1024.9%22.7%Decrease2.svg2.2%163,712151,137Decrease2.svg24.8%24.1%Decrease2.svg0.7%
Ulster Unionist 7788Increase2.svg1116.7%19.0%Increase2.svg2.3%100,643101,385Increase2.svg15.2%16.1%Increase2.svg0.9%
SDLP 6766Decrease2.svg114.5%14.2%Decrease2.svg0.3%99,32585,237Decrease2.svg15.0%13.6%Decrease2.svg1.4%
Alliance 3432Decrease2.svg27.4%6.9%Decrease2.svg0.5%48,85941,769Decrease2.svg7.4%6.7%Decrease2.svg0.7%
TUV 313Increase2.svg100.6%2.8%Increase2.svg2.2%13,07928,310Increase2.svg2.0%4.5%Increase2.svg2.5%
PUP 14Increase2.svg30.2%0.8%Increase2.svg0.6%3,85812,753Increase2.svg0.6%2.0%Increase2.svg1.4%
Green (NI) 14Increase2.svg30.2%0.8%Increase2.svg0.6%6,3175,515Decrease2.svg1.0%0.8%Decrease2.svg0.2%
UKIP 13Increase2.svg20.2%0.6%Increase2.svg0.4%2,5509,311Increase2.svg0.4%1.4%Increase2.svg1.0%
NI21 01Increase2.svg10.0%0.2%Increase2.svg0.2%011,495Increase2.svg0.0%1.8%Increase2.svg1.8%
People Before Profit 01Increase2.svg10.0%0.2%Increase2.svg0.2%1,7211,923Increase2.svg0.3%0.3%Increase2.svg0.0%
NI Conservatives 00Steady2.svg0.0%0.0%Steady2.svg1,3212,527Increase2.svg0.2%0.4%Increase2.svg0.2%
éirígí 00Steady2.svg0.0%0.0%Steady2.svg2,0621,756Decrease2.svg0.3%0.3%Decrease2.svg0.0%
Workers' Party 00Steady2.svg0.0%0.0%Steady2.svg760985Increase2.svg0.10.2%Increase2.svg0.1%
Fermanagh Against Fracking00Steady2.svg0.0%0.0%Steady2.svg0555Increase2.svg0.0%0.1%Increase2.svg0.1%
Republican Network for Unity 00Steady2.svg0.0%0.0%Steady2.svg0502Increase2.svg0.0%0.1%Increase2.svg0.1%
Community Partnership00Steady2.svg0.0%0.0%Steady2.svg800388Decrease2.svg0.10.1%Decrease2.svg0.0%
Socialist Party 00Steady2.svg0.0%0.0%Steady2.svg682272Decrease2.svg0.1%0.0%Decrease2.svg0.1%
BNP 00Steady2.svg0.0%0.0%Steady2.svg491174Decrease2.svg0.1%0.0%Decrease2.svg0.1%
Democracy First00Steady2.svg0.0%0.0%Steady2.svg0173Increase2.svg0.0%0.0%Increase2.svg0.0%
Others00Steady2.svg0.0%0.0%Steady2.svg2,1420Decrease2.svg0.3%0.0%Decrease2.svg0.3%
Independent 1815Decrease2.svg 33.9%3.2%Decrease2.svg0.7%32,15126,682Decrease2.svg4.9%4.2%Decrease2.svg0.7%
Total462462Steady2.svg100%100%Steady2.svg660,631627,777Decrease2.svg100%100%Steady2.svg

Electoral administration

Eligibility to vote

All registered electors (British, Irish, Commonwealth and European Union citizens) who were aged 18 or over on the day of the election were entitled to vote in the local elections. Those who were temporarily away from their ordinary address (for example, away working, on holiday, in student accommodation or in hospital) were also entitled to vote in the local elections, [14] although those who have moved abroad and registered as overseas electors cannot vote in the local elections. Those who were registered to vote at more than one address (such as a university student who has a term-time address and lives at home during holidays) were entitled to vote in the local elections at each address, as long as they were not in the same local government area. [15] [16]

Enacting legislation

These elections were held on 22 May 2014 as provided by 'The Local Elections (Ordinary Day of Elections in 2014) Order 2013' (S.I. Tooltip Statutory Instrument (UK) 2013/2277). [12] [17] [18] [19]

See also

Notes

  1. All vote shares in the infobox are projected national vote shares calculated by the BBC.
  2. Swing figures are between the BBC national projected vote share extrapolation from 2013 local elections, and the BBC equivalent vote share projection from these local elections held in different areas
  3. 1 2 England: 163 councillors (+161 net). Northern Ireland: 3 councillors (+2 net)

Related Research Articles

In the context of local authorities in the United Kingdom, no overall control is a situation in which no single political group achieves a majority of seats, analogous to a hung parliament. Of the 248 councils who had members up for election in the 2019 local elections, 73 resulted in a NOC administration. In the 2021 election, 14 resulted in no overall control. The term can still be used for several other countries, such as for two local councils of Malta and the General Assembly of Budapest in Hungary.

<span class="mw-page-title-main">2006 United Kingdom local elections</span>

The 2006 United Kingdom local elections were held on Thursday 4 May 2006.

This article lists the British National Party's election results in the UK parliamentary, Scottish parliamentary and Welsh Assembly elections, as well as in the European Parliament elections and at a local level.

<span class="mw-page-title-main">2013 United Kingdom local elections</span>

The 2013 United Kingdom local elections took place on Thursday 2 May 2013. Elections were held in 35 English councils: all 27 non-metropolitan county councils and eight unitary authorities, and in one Welsh unitary authority. Direct mayoral elections took place in Doncaster and North Tyneside. These elections last took place on the 4 June 2009 at the same time as the 2009 European Parliament Elections, except for County Durham, Northumberland and the Anglesey where elections last took place in 2008.

<span class="mw-page-title-main">2013 West Sussex County Council election</span>

The West Sussex County Council election, 2013 took place on 2 May 2013, as part of the 2013 United Kingdom local elections. All 71 electoral divisions were up for election, which returned one county councillor each by first-past-the-post voting for a four-year term of office. At this election, the Conservative Party was seeking to retain overall control of the council, and the Liberal Democrats to maintain their position as the main opposition party.

<span class="mw-page-title-main">2013 East Sussex County Council election</span> 2013 UK local government election

The East Sussex County Council election, 2013 took place on 2 May 2013 as part of the 2013 United Kingdom local elections. All 49 councillors of East Sussex County Council were elected from 44 electoral divisions, which return either one or two councillors each by first-past-the-post voting for a four-year term of office. The electoral divisions were the same as those used at the previous election in 2009. No elections were held in Brighton and Hove, which is a unitary authority outside the area covered by the County Council.

<span class="mw-page-title-main">2013 Hampshire County Council election</span> 2013 UK local government election

An election to Hampshire County Council took place on 2 May 2013 as part of the 2013 United Kingdom local elections. 78 councillors were elected from 75 electoral divisions, which returned either one or two county councillors each by first-past-the-post voting for a four-year term of office. The electoral divisions were the same as those of the previous election in 2009. No elections were held in Portsmouth and Southampton, which are unitary authorities outside the area covered by the County Council. The election saw the Conservative Party retain overall control of the council, with a reduced majority of five councillors.

<span class="mw-page-title-main">2013 Kent County Council election</span> 2013 UK local government election

The Kent County Council election, 2013 was an election to all 84 seats on Kent County Council held on Thursday 2 May as part of the 2013 United Kingdom local elections. 84 councillors were elected from 72 electoral divisions, which returned either one or two county councillors each by first-past-the-post voting for a four-year term of office. The electoral divisions were the same as those used at the previous election in 2009. No elections were held in Medway, which is a unitary authority outside the area covered by the County Council. The election saw the Conservative Party narrowly retain overall control of the council.

<span class="mw-page-title-main">2013 Cambridgeshire County Council election</span>

An election to Cambridgeshire County Council took place on 2 May 2013 as part of the 2013 United Kingdom local elections. 69 councillors were elected from 60 electoral divisions, which returned either one or two county councillors each by first-past-the-post voting for a four-year term of office. The electoral divisions were the same as those used at the previous election in 2009. No elections were held in Peterborough, which is a unitary authority outside the area covered by the County Council. The election saw the Conservative Party lose overall control of the council.

<span class="mw-page-title-main">2013 Gloucestershire County Council election</span>

Elections to Gloucestershire County Council took place on 2 May 2013 as part of the 2013 United Kingdom local elections. 53 electoral divisions elected one county councillor each by first-past-the-post voting for a four-year term of office. No elections were held in South Gloucestershire, which is a unitary authority outside the area covered by the County Council.

<span class="mw-page-title-main">2013 Essex County Council election</span> 2013 UK local government election

An election to Essex County Council took place on 2 May 2013 as part of the 2013 United Kingdom local elections. 75 councillors were elected from 70 electoral divisions, which returned either one or two county councillors each by first-past-the-post voting for a four-year term of office. The electoral divisions were the same as those used at the previous election in 2009. No elections were held in Thurrock or Southend-on-Sea, which are unitary authorities outside the area covered by the County Council.

<span class="mw-page-title-main">2013 Staffordshire County Council election</span> UK local elections

An election to Staffordshire County Council took place on 2 May 2013 as part of the 2013 United Kingdom local elections. 62 electoral divisions returned one county councillor each by first-past-the-post voting for a four-year term of office. Following a boundary review, new electoral division boundaries were established for this election. No elections were held in Stoke-on-Trent, which is a unitary authority outside the area covered by the County Council. The council continues to be administered on the Leader and Cabinet model.

<span class="mw-page-title-main">2013 Dorset County Council election</span>

An election to Dorset County Council took place on 2 May 2013 as part of the United Kingdom local elections. 45 councillors were elected from 42 electoral divisions, which returned either one or two county councillors each by first-past-the-post voting for a four-year term of office. The electoral divisions were the same as those used at the previous election in 2009. No elections were held in Bournemouth or Poole, which are unitary authorities outside the area covered by the County Council. The election saw the Conservative Party maintain overall control of the council.

<span class="mw-page-title-main">2015 United Kingdom local elections</span>

The 2015 United Kingdom local elections were held on Thursday 7 May 2015, the same day as the general election for the House of Commons of the United Kingdom.

<span class="mw-page-title-main">2015 Cheshire West and Chester Council election</span>

The 2015 Cheshire West and Chester Council election took place on 7 May 2015, electing members of Cheshire West and Chester Council in England. This was on the same day as other local elections across the country as well as the general election.

<span class="mw-page-title-main">2017 United Kingdom local elections</span>

The 2017 United Kingdom local elections were held on Thursday 4 May 2017. Local elections were held across Great Britain, with elections to 35 English local authorities and all councils in Scotland and Wales.

<span class="mw-page-title-main">2017 Essex County Council election</span> 2017 UK local government election

Elections to Essex County Council took place on 4 May 2017 as part of the 2017 local elections. All 75 councillors were elected from 70 electoral divisions, which each returned either one or two councillors by first-past-the-post voting for a four-year term of office.

<span class="mw-page-title-main">2018 United Kingdom local elections</span>

The 2018 United Kingdom local elections were held on Thursday 3 May 2018, with local council elections taking place in all 32 London boroughs, 34 metropolitan boroughs, 67 district and borough councils and 17 unitary authorities. There were also direct elections for the mayoralties of Hackney, Lewisham, Newham, Tower Hamlets and Watford.

<span class="mw-page-title-main">2019 United Kingdom local elections</span> Elections to local councils and mayoralties

The 2019 United Kingdom local elections took place on Thursday 2 May 2019, with 248 English local councils, six directly elected mayors in England, and all 11 local councils in Northern Ireland being contested.

<span class="mw-page-title-main">2022 United Kingdom local elections</span> Elections to local councils and mayoralties

The 2022 United Kingdom local elections took place on Thursday 5 May 2022. These included elections for all London borough councils, for all local authorities in Wales and Scotland. Most seats in England were last up for election in 2018 and in Scotland and Wales in 2017. The elections coincided with the 2022 Northern Ireland Assembly election. In 91 cases, most of them in Wales, council seats were uncontested, each having only one candidate. Three seats in Scotland remained unfilled as no one nominated to fill them.

References

  1. "BBC Projected National Share of Vote 2014". Elections Etc. Steve Fisher and Jonathan Jones. 24 May 2014. Retrieved 30 April 2018.
  2. Elise Uberoi; Chris Watson; Richard Keen (19 May 2016). "Local elections 2016" (PDF). House of Commons Library. UK Parliament. Retrieved 8 April 2020.
  3. "England Council Results". Vote 2014. BBC News. 28 May 2014. Retrieved 28 May 2014.
  4. "Council Elections 2014". The Guardian. Retrieved 8 April 2020.
  5. 1 2 (Notional)
  6. 1 2 "Northern Ireland Council Elections". Vote 2011. BBC News. 11 May 2011. Retrieved 8 April 2020.
  7. 1 2 3 4 "Northern Ireland council results". Vote 2014. BBC News. 25 May 2014. Retrieved 8 April 2020.
  8. "Year Tables". The Elections Centre. 19 December 2015.
  9. "Wokingham Borough election results for 22 May 2014". Wokingham Borough Council. 22 May 2014. Archived from the original on 29 November 2014. Retrieved 16 November 2014.
  10. Riglar, Kirsty (3 March 2014). "District Council Elections in Purbeck". Purbeck District Council Central Services. Archived from the original on 3 March 2014. Retrieved 3 March 2014.
  11. "Minutes of the special meeting of the Purbeck District Council". Dorset for You. Dorset Council. 21 February 2012. Retrieved 3 March 2014.
  12. 1 2 "European Parliament and council polls on same day". Belfast Telegraph. Independent News & Media. Archived from the original on 20 August 2013. Retrieved 22 August 2013.
  13. Whyte, Nicholas (6 April 2014). "The 11 new district councils – projecting the 2011 votes". Slugger O'Toole. Retrieved 23 April 2014.
  14. "The Representation of the People (Form of Canvass) (England and Wales) Regulations 2006, Schedule Part 1". Legislation.gov.uk. 13 October 2011. Retrieved 7 December 2012.
  15. "Students". About my Vote. Electoral Commission. Archived from the original on 22 August 2013. Retrieved 22 August 2013.
  16. "I have two homes. Can I register at both addresses?". Electoral Commission. Archived from the original on 28 September 2008. Retrieved 5 January 2011.
  17. "The Local Elections (Ordinary Day of Elections in 2014) Order 2013". Legislation.gov.uk. Open Government. Retrieved 19 May 2014.
  18. "Ukip chances of 2014 euro election win 'strengthened by polling date change'". The Daily Telegraph. 26 June 2013. Retrieved 27 June 2013.(subscription required)
  19. "England local elections 2014". Local Government Information Unit. Archived from the original on 10 November 2013. Retrieved 12 March 2013.