1979 European Parliament election in the United Kingdom

Last updated

1979 European Parliament election in the United Kingdom
Flag of the United Kingdom.svg
7 June 1979 1984  

81 seats to the European Parliament
Turnout32.4%
 First partySecond party
  Mme Barbara Castle, Ministre britannique du developpement outre-mer.jpg
Leader James Scott-Hopkins Barbara Castle
Party Conservative Labour
Alliance ED PES
Leader's seat Hereford and Worcester Greater Manchester North
Seats won6017
Popular vote6,508,4924,253,247
Percentage48.4%31.6%

1979 United Kingdom EU Election.svg

1979 UK European Parliament election.svg

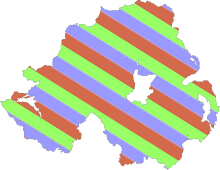
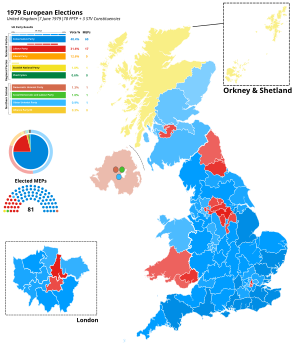
The 1979 European Parliament election, was the first European election to be held in the United Kingdom after the European Communities (EC) decided to directly elect representatives to the European Parliament. It was held on 7 June. Elections were also held in eight other EC states. European elections were incorporated into UK law by the European Assembly Elections Act 1978. Out of the 410 members of the European Parliament, 81 were elected from the UK. The electoral system was First past the post in England, Scotland and Wales (electing 78 MEPs in total) and Single Transferable Vote in Northern Ireland (electing 3 MEPs).

Contents

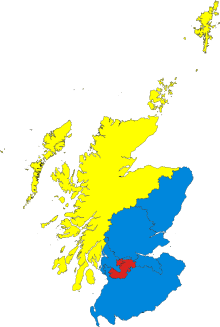
The result was a landslide victory for the Conservative Party, which won 60 of the 78 seats available in England, Wales and Scotland. Their decisive victory in the general election of the previous month and divisions within the Labour party on whether to stay in the EC probably helped the Conservatives to such a comprehensive victory. There was a very low turnout in the election compared with other states, the lowest in Europe. Voter apathy was an explanation, but it is likely the large number of elections in 1979 had a significant negative effect on turnout. There were referendums in Scotland and Wales on devolution in March and the general election in May, as well as local elections in England (not including London) and Wales.

Result (UK-wide)

Source: UK Parliament Briefing

PartyVotes won % of voteSeats % of seats
Conservative 6,508,49248.46075.0
Labour 4,253,24731.61721.3
Liberal 1,690,63812.60Steady2.svg
SNP 247,8361.811.3
DUP 170,6881.311.3
SDLP 140,6221.011.3
Ulster Unionist 125,1690.911.3
Plaid Cymru 83,3990.60Steady2.svg
Alliance 39,0260.30Steady2.svg
Ind. Unionist 38,1980.30Steady2.svg
Independent Republican 33,9690.30Steady2.svg
United Against
the Common Market
27,5060.20Steady2.svg
Independent 23,5390.20Steady2.svg
Ecology 17,9530.10Steady2.svg
Mebyon Kernow 10,2050.10Steady2.svg
United Community9,3830.10Steady2.svg
United Labour 6,1220.00Steady2.svg
Ind. Conservative 4,8040.00Steady2.svg
Workers' Party 4,4180.00Steady2.svg
Unionist Party NI 3,7120.00Steady2.svg
Independent Democratic2,4730.00Steady2.svg
International Marxist 1,6350.00Steady2.svg
Ulster Liberal Party9320.00Steady2.svg
EFP4970.00Steady2.svg
Others1,6280.00Steady2.svg

Results Breakdown

England, Scotland and Wales

Map of the Scottish results. European Parliament election, 1979 (Scotland).svg
Map of the Scottish results.
Map of the Northern Irish results European Parliament election, 1979-1999 (Northern Ireland, UK).svg
Map of the Northern Irish results

Source: UK Parliament Briefing

PartyVotes won % of voteSeats % of seats
Conservative 6,508,49250.66076.9
Labour 4,253,24733.01721.8
Liberal 1,690,63813.10Steady2.svg
SNP 247,8361.911.3
Plaid Cymru 83,3990.60Steady2.svg
United Against
the Common Market
27,5060.20Steady2.svg
Independent 23,5390.20Steady2.svg
Ecology 17,9530.10Steady2.svg
Mebyon Kernow 10,2050.10Steady2.svg
Ind. Conservative 4,8040.00Steady2.svg
Ind. Democratic2,4730.00Steady2.svg
International Marxist 1,6350.00Steady2.svg
EFP4970.00Steady2.svg
Others1,6280.00Steady2.svg

Total votes cast – 12,873,852.

Northern Ireland

Source Northern Ireland Social and Political Archive

PartyCandidate(s)SeatsFirst Preference Votes
Number % of vote
DUP Ian Paisley 1170,68829.8
SDLP John Hume 1140,62225.5
Ulster Unionist John Taylor, Harry West 1125,16921.9
Alliance Oliver Napier 039,0266.8
Ind. Unionist James Kilfedder 038,1986.7
Independent Republican Bernadette McAliskey 033,9695.9
United Community David Bleakley 09,3831.6
United Labour Paddy Devlin 06,1221.1
Workers' Party Brian Brennan, Francis Donnelly04,4180.8
Unionist Party NI Eddie Cummings03,7120.6
Ulster Liberal James Murray09320.2

Total votes cast – 572,239.

Constituency results

ConstituencyCon%Lab%Lib%PC%SNP%Others
Bedfordshire 102,05458.848,45427.921,94312.61,1980.7
Birmingham North 68,50747.860,16342.014,58310.2
Birmingham South 66,01247.560,77543.712,1608.8
Bristol 100,16054.259,44332.125,30813.7
Cambridgeshire 94,49759.042,03826.323,50114.7
Cheshire East 89,64056.050,32431.519,95212.5
Cheshire West 93,58956.847,27628.723,81614.5
Cleveland 76,51450.651,68834.118,12512.04,9603.3
Cornwall and Plymouth 94,65055.136,68121.423,10513.517,16410.0
Cotswolds 109,13958.637,71320.327,91615.011,4226.1
Cumbria 104,47156.462,48533.716,6319.01,5960.9
Derbyshire 81,04650.962,34739.215,7759.9
Devon 127,03261.837,38018.241,01020.0
Durham 53,04335.181,98254.216,09410.7
Essex North East 99,13760.733,49620.526,29816.14,4972.7
Essex South West 78,05953.946,24431.920,51614.2
Glasgow 41,14427.373,84649.011,0737.324,77616.4
Greater Manchester North 62,45639.279,92050.216,91010.6
Greater Manchester South 70,68847.563,21442.514,86910.0
Greater Manchester West 67,12743.366,82543.121,02113.6
Hampshire West 114,97858.934,47217.745,78623.4
Hereford and Worcester 106,27158.549,88827.525,42114.0
Hertfordshire 97,17450.249,61925.646,75724.2
Highlands and Islands 30,77626.110,8469.236,10930.739,99134.0
Humberside 79,53151.756,52136.817,64311.5
Kent East 117,26764.740,06022.120,19011.13,7882.1
Kent West 113,96160.746,48224.827,12713.5
Lancashire Central 91,35554.163,70937.713,8218.2
Lancashire East 77,08749.962,72940.612,2687.92,4731.6
Lancashire West 79,88851.360,39938.712,1167.83,4862.2
Leeds 54,40539.862,47545.620,00514.6
Leicester 91,67555.157,81134.717,02710.2
Lincolnshire 104,46061.544,61626.320,81512.2
Liverpool 49,64645.242,41938.717,65016.1
London Central 84,91554.445,72129.319,01012.26,4484.1
London East 77,95548.864,92540.716,78310.5
London North 74,04249.759,07739.715,83810.6
London North East 36,20034.261,00457.58,8398.3
London North West 87,59655.349,26831.121,61813.6
London South 98,29858.944,96727.023,52614.1
London South East 94,18055.054,79832.021,49412.58900.5
London South Inner 60,65243.667,83048.810,5097.6
London South West 83,49852.051,74232.221,25113.23,8102.6
London West 89,43351.067,19338.317,0779.81,6350.9
Lothians 66,76135.661,18032.629,51815.829,93516.0
Mid and West Wales 67,22636.077,47441.417,6289.422,73012.21,8261.0
Mid Scotland and Fife 66,25535.158,76831.218,1129.645,42624.1
Midlands Central 94,60657.946,55728.515,8599.76,3803.9
Midlands East 85,09855.353,93535.114,8199.6
Midlands West 69,91647.368,02446.09,9366.7
Norfolk 102,98159.852,40630.416,8059.8
North East Scotland 51,93033.038,13924.238,51624.528,88618.3
North Wales 74,17341.946,62726.421,98912.434,17119.3
Northamptonshire 103,63859.647,02927.123,13413.3
Northumbria 67,06639.975,17244.825,71315.3
Nottingham 64,72844.866,27945.913,5159.3
Salop and Stafford 90,54557.545,54728.916,46910.54,8043.1
Sheffield 64,15742.177,21950.710,9517.2
Somerset 120,05757.041,93119.948,60023.1
South East Wales 51,47830.393,09354.810,5346.212,4697.42,1821.3
South of Scotland 66,81643.043,14527.716,82510.828,69418.5
South Wales 66,85237.977,78444.117,81110.114,0297.9
Staffordshire East 70,83648.764,23044.110,4097.2
Strathclyde East 41,48228.672,26349.810,3257.121,01314.5
Strathclyde West 65,60837.263,78136.117,95510.229,11516.5
Suffolk 101,96660.445,64227.121,13112.5
Surrey 113,78654.428,89713.862,27229.74,4502.1
Sussex East 123,50665.733,58117.930,84716.4
Sussex West 131,07765.926,89413.535,59317.95,3032.7
Thames Valley 110,78863.139,86522.724,87714.2
Tyne South and Wear 67,47544.973,93649.28,9585.9
Upper Thames 103,48859.439,90022.930,90717.7
Wessex 130,74463.342,91020.831,22015.11,7060.8
Wight and Hampshire East 128,41464.734,90117.635,24817.7
Wiltshire 86,87347.535,45719.460,40433.1
Yorkshire North 98,46459.141,40824.826,81216.1
Yorkshire South 46,65632.683,49058.313,0259.1
Yorkshire South West 52,15735.875,47351.917,85012.3
Yorkshire West 73,55544.476,55246.315,4609.3

See also

Related Research Articles

<span class="mw-page-title-main">2001 United Kingdom general election</span>

The 2001 United Kingdom general election was held on Thursday 7 June 2001, four years after the previous election on 1 May 1997, to elect 659 members to the House of Commons. The governing Labour Party was re-elected to serve a second term in government with another landslide victory with a 167 majority, returning 412 members of Parliament versus 418 from the 1997 general election, a net loss of six seats, though with a significantly lower turnout than before—59.4%, compared to 71.6% at the previous election. The number of votes Labour received fell by nearly three million. Tony Blair went on to become the only Labour Prime Minister to serve two consecutive full terms in office. As Labour retained almost all of their seats won in the 1997 landslide victory, the media dubbed the 2001 election "the quiet landslide".

<span class="mw-page-title-main">Politics of the United Kingdom</span> Political system of the United Kingdom of Great Britain and Northern Ireland

The politics of the United Kingdom functions within a constitutional monarchy where executive power is delegated by legislation and social conventions to a unitary parliamentary democracy. From this a hereditary monarch, currently Charles III, serves as head of state while the Prime Minister of the United Kingdom, currently Rishi Sunak since 2022, serves as the elected head of government.

<span class="mw-page-title-main">Legislatures of the United Kingdom</span> Parliamentary bodies of the United Kingdom and its component jurisdictions

The legislatures of the United Kingdom are derived from a number of different sources. The parliament of the United Kingdom is the supreme legislative body for the United Kingdom and the British overseas territories with Scotland, Wales and Northern Ireland each having their own devolved legislatures. Each of the three major jurisdictions of the United Kingdom has its own laws and legal system.

<span class="mw-page-title-main">1970 United Kingdom general election</span>

The 1970 United Kingdom general election was held on Thursday 18 June 1970. It resulted in a surprise victory for the Conservative Party under leader Edward Heath, which defeated the governing Labour Party under Prime Minister Harold Wilson. The Liberal Party, under its new leader Jeremy Thorpe, lost half its seats. The Conservatives, including the Ulster Unionist Party (UUP), secured a majority of 30 seats. This general election was the first in which people could vote from the age of 18, after passage of the Representation of the People Act the previous year, and the first UK election where party, and not just candidate names were allowed to be put on the ballots.

<span class="mw-page-title-main">October 1974 United Kingdom general election</span>

The October 1974 United Kingdom general election took place on Thursday 10 October 1974 to elect 635 members of the British House of Commons. It was the second general election held that year; the first year that two general elections were held in the same year since 1910; and the first time that two general elections were held less than a year apart from each other since the 1923 and 1924 elections, which took place 10 months apart. The election resulted in the Labour Party, led by Prime Minister Harold Wilson, winning a bare majority of three seats. That enabled the remainder of the Labour government to take place, but it saw a gradual loss of its majority.

<span class="mw-page-title-main">Referendums in the United Kingdom</span>

Referendums in the United Kingdom are occasionally held at a national, regional or local level. Historically, national referendums are rare due to the long-standing principle of parliamentary sovereignty. There is no constitutional requirement to hold a national referendum for any purpose or on any issue however the UK Parliament is free to legislate through an Act of Parliament for a referendum to be held on any question at any time.

<span class="mw-page-title-main">1984 European Parliament election in the United Kingdom</span> Second European election to be held in the United Kingdom

The 1984 European Parliament election was the second European election to be held in the United Kingdom. It was held on 14 June. The electoral system was First Past the Post in England, Scotland and Wales and Single transferable vote in Northern Ireland. The turnout was again the lowest in Europe. In England, Scotland and Wales, the Liberal Party and Social Democratic Party were in alliance, collecting 2,591,635 votes but not a single seat.

<span class="mw-page-title-main">1989 European Parliament election in the United Kingdom</span> European Parliament elections in the United Kingdom

The 1989 European Parliament election, was the third European election to be held in the United Kingdom. It was held on 15 June. The electoral system was First Past the Post in England, Scotland and Wales and Single Transferable Vote in Northern Ireland. The turnout was again the lowest in Europe.

<span class="mw-page-title-main">1994 European Parliament election in the United Kingdom</span> European Parliament elections in the United Kingdom

The 1994 European Parliament election was the fourth European election to be held in the United Kingdom. It was held on Thursday 9 June, though, as usual, the ballots were not counted until the evening of Sunday 12 June. The electoral system was, for the final European election, first past the post in England, Scotland and Wales and single transferable vote in Northern Ireland. This was the first election with 87 MEPs, the European Parliamentary Elections Act 1993 having increased the number of seats for the UK from 81. For the first time, the UK did not have the lowest turnout in Europe. Turnout was lower in the Netherlands and Portugal.

<span class="mw-page-title-main">1999 European Parliament election in the United Kingdom</span>

The 1999 European Parliament election was the United Kingdom's part of the European Parliament election 1999. It was held on 10 June 1999. Following the European Parliamentary Elections Act 1999, it was the first European election to be held in the United Kingdom where the whole country used a system of proportional representation. In total, 87 Members of the European Parliament were elected from the United Kingdom across twelve new regional constituencies.

<span class="mw-page-title-main">2004 European Parliament election in the United Kingdom</span> Election

The 2004 European Parliament election was the United Kingdom's part of the wider 2004 European Parliament election which was held between 10 and 13 June 2004 in the 25 member states of the European Union. The United Kingdom's part of this election was held on Thursday 10 June 2004. The election also coincided with the 2004 local elections and the London Assembly and mayoral elections. In total, 78 Members of the European Parliament were elected from the United Kingdom using proportional representation.

There are four types of elections in Wales: elections to the House of Commons of the United Kingdom, elections to the devolved Senedd, local elections to community councils and the 22 principal areas, and the Police and Crime Commissioner elections. In addition there are by-elections for each aforementioned election. Elections are held on Election Day, which is conventionally a Thursday. Since the passing of the Fixed-term Parliaments Act 2011 for UK general elections, all four types of elections are held after fixed periods, though early elections to the UK parliament can occur in certain situations, with Senedd elections being postponed to avoid elections to the UK parliament and Senedd coinciding with each other.

<span class="mw-page-title-main">2009 European Parliament election in the United Kingdom</span> European Parliament elections in the United Kingdom

The 2009 European Parliament election was the United Kingdom's component of the 2009 European Parliament election, the voting for which was held on Thursday 4 June 2009. The election was held concurrently with the 2009 local elections in England. In total, 72 Members of the European Parliament were elected from the United Kingdom using proportional representation.

<span class="mw-page-title-main">1984 European Parliament election</span> Election to the European Parliament

The 1984 European Parliament election was the first since the inaugural election of 1979 and the 1981 enlargement of the European Community to include Greece. It was also the last before the accession of Spain and Portugal in 1986.

<span class="mw-page-title-main">Elections in the United Kingdom</span> Overview of the procedure of elections in the United Kingdom

There are five types of elections in the United Kingdom: elections to the House of Commons of the United Kingdom, elections to devolved parliaments and assemblies, local elections, mayoral elections, and police and crime commissioner elections. Within each of those categories, there may also be by-elections. Elections are held on Election Day, which is conventionally a Thursday, and under the provisions of the Dissolution and Calling of Parliament Act 2022 the timing of general elections can be held at the discretion of the prime minister during any five-year period. All other types of elections are held after fixed periods, though early elections to the devolved assemblies and parliaments can occur in certain situations. The five electoral systems used are: the single member plurality system (first-past-the-post), the multi-member plurality, the single transferable vote, the additional member system, and the supplementary vote.

<span class="mw-page-title-main">2014 European Parliament election in the United Kingdom</span> Election

The 2014 European Parliament election was the United Kingdom's component of the 2014 European Parliament election, held on Thursday 22 May 2014, coinciding with the 2014 local elections in England and Northern Ireland. In total, 73 Members of the European Parliament were elected from the United Kingdom using proportional representation. England, Scotland and Wales use a closed-list party list system of PR, while Northern Ireland used the single transferable vote (STV).

<span class="mw-page-title-main">2019 European Parliament election in the United Kingdom</span> 2019 election of members of the European Parliament for the United Kingdom

The 2019 European Parliament election was the United Kingdom's component of the 2019 European Parliament election, held on Thursday 23 May 2019 and the results were announced on Sunday 26 and Monday 27 May 2019, after all the other EU countries had voted. This was the United Kingdom's final participation in a European Parliament election before leaving the European Union on 31 January 2020, and was also the last election to be held under the provisions of the European Parliamentary Elections Act 2002 before its repeal under the European Union (Withdrawal) Act 2018.

<span class="mw-page-title-main">Results of the 2016 United Kingdom European Union membership referendum</span>

The 2016 United Kingdom European Union membership referendum took place in the United Kingdom and Gibraltar on 23 June 2016. Membership of the European Union had been a topic of political debate in the United Kingdom since the country joined the European Communities in 1973. This referendum was conducted very differently from the European Communities membership referendum in 1975; a more localised and regionalised counting procedure was used, and the ballot was overseen by the Electoral Commission, a public body which did not exist at the time of the first vote. This article lists, by voting area for Great Britain and Gibraltar and by parliamentary constituency for Northern Ireland, all the results of the referendum, each ordered into national and regional sections.

<span class="mw-page-title-main">2019 United Kingdom general election in Wales</span> United Kingdom general election held in Wales

The 2019 United Kingdom general election was held on 12 December 2019 to elect all 650 members of the House of Commons, including the 40 Welsh seats.

References

  1. Ayres, Steven (3 April 2014). "Standard Note SN06865: European Parliament Elections: Turnout trends, 1979-2009" (PDF). House of Commons Library . London. Archived (PDF) from the original on 3 June 2021.