1994 European Parliament election

Last updated

1994 European Parliament election
Flag of Europe.svg
  1989 9–12 June 1994 1999  

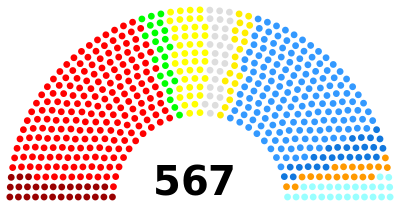
All 567 seats to the European Parliament
285 seats needed for a majority
Turnout56.8% Decrease2.svg 1.7 pp
 Majority partyMinority party
  Pauline Green 20050423 (cropped).jpg Wilfried Martens.jpg
Leader Pauline Green Wilfried Martens
Party PES EPP
Leader's seat London North Belgium (Dutch)
Last election180121
Seats won198157
Seat changeIncrease2.svg18Increase2.svg36

1994 European Parliament election, political grouping breakdown by countries.svg
Post-election composition of each member state's delegation

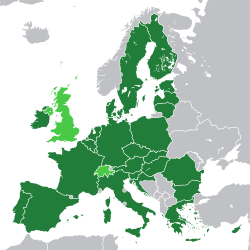
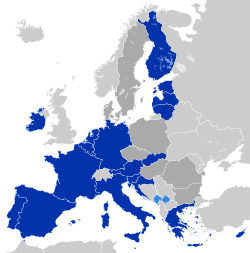
The 1994 European Parliamentary election was a European election held across the 12 European Union member states in June 1994.

Contents

This election saw the merge of the European People's Party and European Democrats, an increase in the overall number of seats (567 members were elected to the European Parliament) and a fall in overall turnout to 57%.

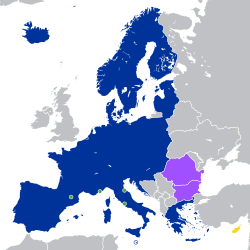
The five years which had passed since the previous election had seen enormous political upheavals across the continent. These changes included the end of communism in Europe, German reunification, the dissolution of the Soviet Union, the Velvet Divorce in Czechoslovakia and the breakup of Yugoslavia. The integration of five former East German states and Berlin into the Federal Republic of Germany had constituted the first physical expansion of the EC since 1986. The end of the Cold War meant three politically neutral states in Europe had begun a process of acceding to the EU that would culminate in the 1995 enlargement of the European Union. The EU itself had assumed its current name through adoption of the Treaty of Maastricht in 1993.

Results

European Parliament election, 1994 - Final results at 18–21 July 1994
Group DescriptionChaired by MEPs
  PES Social democrats Pauline Green 198 European Parliament Composition 1994.svg
  EPP Conservatives and Christian democrats Wilfried Martens 157
  ELDR Liberals and liberal democrats Gijs De Vries 43
  EUL Communists and the far left Alonso José Puerta 28
  FE Conservatives and Christian democrats Giancarlo Ligabue 27
  EDA National conservatives Jean-Claude Pasty 26
  G Greens Alexander Langer
Claudia Roth
23
  ERA Radicals, social liberals and regionalists Catherine Lalumière 19
  EN Eurosceptics James Goldsmith 19
  NI Independentsnone27Total: 567Sources:
Seats summary
PES
34.92%
EPP
27.69%
ELDR
7.58%
EUL
4.94%
FE
4.76%
EDA
4.59%
G
4.06%
ERA
3.35%
EN
3.35%
NI
4.76%

The Technical Group of the European Right no longer had enough MEPs to qualify as a Group, and its MEPs returned for the time being to the ranks of the independents. The members of the European Democrats joined the European People's Party (EPP), some as associate members such as the British Conservatives who did not wish to subscribe to the EPP's pro-federalist position. Despite the merger, the EPP failed one more to become the largest party; the Party of European Socialists once more claimed victory, with a 41-seat lead over the People's Party.

Forza Italia was elected for the first time in 1994; it formed its own shortlived group, Forza Europa, before this merged with the European Democratic Alliance a year after the election to become the Group Union for Europe. In addition to Forza Europa, another new group was founded following the fall of the European Right group: the Europe of Nations Group (Coordination Group)—the first Eurosceptic group in the Parliament, which lasted until 1996.

Results by country

The national results as at 9–12 June 1994 are as follows:

Group
Nation
PES EPP ELDR EUL FE EDA G ERA EN NI Total
Belgium 3 PS
3 SP
4 CVP
2 PSC
1 CSP
3 VLD
3 PRLFDF
1 ECOLO
1 AGALEV
1 VU 2 VB
1 FN
25
Denmark 3 A 3 C 4 V
1 B
1 SF 2 J
2 N
16
France 15 PS 13 UDF 1 UDF 7 PCF 14 RPR 13 MRG 13 UDF diss. 11 FN 87
Germany 40 SPD 39 CDU
8 CSU
12 GRÜNE 99
Greece 10 PASOK 9 ND 2 KKE
2 Synaspismos
2 PA 25
Ireland 1 Lab 4 FG 1 Ind. 7 FF 2 GP 15
Italy 16 PDS
2 PSI
8 PPI
3 Patto
1 SVP
6 LN
1 PRI
5 PRC 27 FI 3 FdV
1 Rete
2 LP 11 AN
1 PSDI
87
Luxembourg 2 LSAP 2 CSV 1 DP 1 Gréng 6
Netherlands 8 PvdA 10 CDA 6 VVD
4 D66
1 GL 1 SGP
1 GPV
31
Portugal 10 PS 9 PSD 3 CDU 3 CDS–PP 25
Spain 22 PSOE 28 PP
2 CiU (UDC)
2 CN (EAJ)
2 CiU (CDC)9 IU 1 CN (CC)64
United Kingdom 62 LAB
1 SDLP
18 CON
1 UUP
2 LD 2 SNP 1 DUP 87
Total1981653528272623191927567

Statistics

European Parliament election, 1994 - Statistics
AreaDatesSeatsElectorateTurnoutPreviousNextElection methodsSources
European Union
(EU-12)
9, 12 June
1994
567269,261,00056.8% 1989 1995 All PR, except UK (not NI)
which used FPTP
Archived 2008-02-27 at the Wayback Machine
European Parliament election, 1994 - Timeline
Third Parliament1994 ElectionRegroupingFourth Parliament
GroupsPre-elections
May 30
ChangeResults
June 13
ChangeResults
July 19
New
Groups
First session
July 19
 PES198+1199-1198 PES198
 EPP162-14148+9157 EPP157
 LDR45-243+043 ELDR43
 LU13+013+1528 EUL28
 DR12+214-1427 NI27
 NI27+1037-10
 Others0+5959-1319 EN19
27 FE27
 EDA20+424+226 EDA26
 G27-522+123 G23
 RBW14-68+1119 ERA19
Total518+49567+0567Total567
Sources: Archived 2006-09-12 at the Wayback Machine
European Parliament election, 1994 - Delegation at 19 July 1994
GroupDescriptionDetails%MEPs
  PES Social democrats Germany 40, Belgium 6, Denmark 3, France 15, Ireland 1, Italy 18, Luxembourg 2, Netherlands 8, UK 63, Greece 10, Spain 22, Portugal 1035%198
  EPP Conservatives and Christian democrats Germany 47, Belgium 7, Denmark 3, France 13, Ireland 4, Italy 12, Luxembourg 2, Netherlands 10, UK 19, Greece 9, Spain 30, Portugal 128%157
  ELDR Liberals and liberal democratsBelgium 6, Denmark 5, France 1, Ireland 1, Italy 7, Luxembourg 1, Netherlands 10, UK 2, Spain 2, Portugal 88%43
  EUL Socialists and communists France 7, Italy 5, Greece 4, Spain 9, Portugal 35%28
  NI IndependentsBelgium 3, France 11, Italy 12, UK 15%27
  FE Conservatives and Christian democrats Italy 275%27
  EDA National conservatives France 14, Ireland 7, Greece 2, Portugal 35%26
  G Greens Germany 12, Belgium 2, Denmark 1, Ireland 2, Italy 4, Luxembourg 1, Netherlands 14%23
  ERA Liberals and liberal democratsBelgium 1, France 13, Italy 2, UK 2, Spain 13%19
  EN Eurosceptics Denmark 4, France 13, Netherlands 23%19
Sources: Archived 2008-05-13 at the Wayback Machine 100%567

Seat distribution

The number of seats in Parliament was increased from 518 to 567. The reason for this was the accession of the German Democratic Republic to the Federal Republic of Germany. The number of seats for the other larger states was also increased because the smaller states are entitled to a disproportionate number of seats compared to their population.

National Distribution of Seats
State19891994State19891994
Flag of Germany.svg  Germany 8199Flag of Belgium (civil).svg  Belgium 2425
Flag of the United Kingdom.svg  United Kingdom 8187Flag of Portugal.svg  Portugal 2425
Flag of France.svg  France 8187Flag of Greece.svg  Greece 2425
Flag of Italy.svg  Italy 8187Flag of Denmark.svg  Denmark 1616
Flag of Spain.svg  Spain 6064Flag of Ireland.svg  Ireland 1515
Flag of the Netherlands.svg  Netherlands 2531Flag of Luxembourg.svg  Luxembourg 66

Until 1996 the number of seats was further increased to 626 to accommodate Austria, Finland and Sweden who were joining, holding elections in 1995 and 1996. They were granted 21,16 and 22 seats respectively.