![]() | |||||||||||||||||||||||||||||||||||||||||||||||||||||||||||||||||||||||||
| |||||||||||||||||||||||||||||||||||||||||||||||||||||||||||||||||||||||||
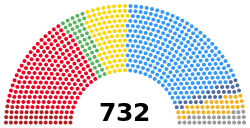
All 732 seats to the European Parliament 367 seats needed for a majority | |||||||||||||||||||||||||||||||||||||||||||||||||||||||||||||||||||||||||
---|---|---|---|---|---|---|---|---|---|---|---|---|---|---|---|---|---|---|---|---|---|---|---|---|---|---|---|---|---|---|---|---|---|---|---|---|---|---|---|---|---|---|---|---|---|---|---|---|---|---|---|---|---|---|---|---|---|---|---|---|---|---|---|---|---|---|---|---|---|---|---|---|---|
Turnout | 45.47% [1] ![]() | ||||||||||||||||||||||||||||||||||||||||||||||||||||||||||||||||||||||||
| |||||||||||||||||||||||||||||||||||||||||||||||||||||||||||||||||||||||||
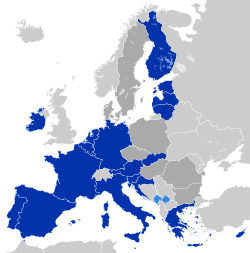
![]() Post-election composition of each member state's delegation | |||||||||||||||||||||||||||||||||||||||||||||||||||||||||||||||||||||||||
|
This article is part of a series on |
![]() |
---|
![]() |
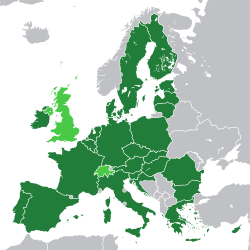
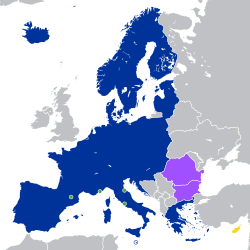
The 2004 European Parliament election was held between 10 and 13 June 2004 in the 25 member states of the European Union, using varying election days according to local custom. The European Parliamental parties could not be voted for, but elected national parties aggregated in European Parliamental parties after the elections.
Votes were counted as the polls closed, but results were not announced until 13 and 14 June so results from one country would not influence voters in another where polls were still open; however, the Netherlands, voting on Thursday 10, announced nearly complete provisional results as soon as they were counted, on the evening of its election day, a move heavily criticized by the European Commission.
342 million people were eligible to vote, the second-largest democratic electorate in the world after India. It was the biggest transnational direct election in history, and the 10 new member states elected MEPs for the first time. The new (6th) Parliament consisted of 732 Members of the European Parliament (MEPs).
Results showed a general defeat of governing parties and an increase in representatives from eurosceptic parties. No majority was achieved. The balance of power in the Parliament remained the same (largest party EPP-ED, second largest PES) despite the 10 new member states.
European Parliament election, 2004 - Final results on 20 July 2004 | ||||||
---|---|---|---|---|---|---|
Group | Description | Chaired by | MEPs | |||
EPP-ED | Conservatives and Christian democrats | Hans-Gert Pöttering | 268 | ![]() | ||
PES | Social democrats | Martin Schulz | 200 | |||
ALDE | Liberals and liberal democrats | Graham Watson | 88 | |||
G–EFA | Greens and regionalists | Daniel Cohn-Bendit Monica Frassoni | 42 | |||
EUL–NGL | Democratic socialists and communists | Francis Wurtz | 41 | |||
ID | Eurosceptics | Jens-Peter Bonde Nigel Farage | 37 | |||
UEN | National conservatives | Brian Crowley Cristiana Muscardini | 27 | |||
NI | Independents and far right | none | 29 | Total: 732 | Sources: Archived 27 March 2009 at the Wayback Machine |
European Parliament election, 2004 - Statistics | ||
---|---|---|
Area | European Union (EU-25) | Sources |
Dates |
| |
Seats | 732 | |
Candidates | over 14,600 | |
Electorate | 342 million | Archived 12 December 2007 at archive.today |
Turnout | 45.6% | |
Previous | 1999 European Parliament election | n/a |
Next | 2009 European Parliament election | n/a |
Election methods | All proportional representation. | |
Preference voting allowed? | ||
Cutoff? |
| |
Seat allocation |
| |
Constituency boundaries |
| |
Minimum voting age | 18 | |
Presidential election |
|
European Parliament election, 2004 - Timeline | ||||||||||
---|---|---|---|---|---|---|---|---|---|---|
Fifth Parliament | 2004 Election | Regrouping | Sixth Parliament | |||||||
Groups | Pre-enlargement April 30 | Pre-elections May 5 | Change | Results June 30 | Change | Results July 20 | New Groups | First session July 20 | ||
EPP-ED | 232 | 295 | -16 | 279 | -11 | 268 | EPP-ED | 268 | ||
PES | 175 | 232 | -33 | 199 | +1 | 200 | PES | 200 | ||
ELDR | 52 | 67 | 0 | 67 | +21 | 88 | ALDE | 88 | ||
G/EFA | 45 | 47 | -7 | 40 | +2 | 42 | G/EFA | 42 | ||
EUL-NGL | 49 | 55 | -16 | 39 | +2 | 41 | EUL-NGL | 41 | ||
EDD | 18 | 18 | -3 | 15 | +22 | 37 | ID | 37 | ||
NI | 32 | 44 | 22 | 66 | -37 | 29 | NI | 29 | ||
UEN | 23 | 30 | -3 | 27 | 0 | 27 | UEN | 27 | ||
Total | 626 | 788 | -56 | 732 | 0 | 732 | Total | 732 | ||
Sources: Archived 27 March 2009 at the Wayback Machine |
European Parliament election, 2004 - Delegation at 20 July 2004 | |||||
---|---|---|---|---|---|
Group | Description | Details | % | MEPs | |
EPP-ED | Conservatives and Christian democrats | Germany 49, Belgium 6, Denmark 1, France 17, Ireland 5, Italy 24, Luxembourg 3, Netherlands 7, UK 28, Greece 11, Spain 24, Portugal 9, Austria 6, Finland 4, Sweden 5, Cyprus 3, Estonia 1, Hungary 13, Latvia 3, Lithuania 2, Malta 2, Poland 19, Czech Republic 14, Slovakia 8, Slovenia 4 | 37% | 268 | |
PES | Social democrats | Germany 23, Belgium 7, Denmark 5, France 31, Ireland 1, Italy 16, Luxembourg 1, Netherlands 7, UK 19, Greece 8, Spain 24, Portugal 12, Austria 7, Finland 3, Sweden 5, Estonia 3, Hungary 9, Lithuania 2, Malta 3, Poland 8, Czech Republic 2, Slovakia 3, Slovenia 1 | 27% | 200 | |
ALDE | Liberals and liberal democrats | Germany 7, Belgium 6, Denmark 4, France 11, Ireland 1, Italy 12, Luxembourg 1, Netherlands 5, UK 12, Spain 2, Finland 5, Sweden 3, Cyprus 1, Estonia 2, Hungary 2, Latvia 1, Lithuania 7, Poland 4, Slovenia 2 | 12% | 88 | |
G/EFA | Greens and regionalists | Germany 13, Belgium 2, Denmark 1, France 6, Italy 2, Luxembourg 1, Netherlands 4, UK 5, Spain 3, Austria 2, Finland 1, Sweden 1, Latvia 1 | 6% | 42 | |
EUL/NGL | Left-wing group | Germany 7, Denmark 1, France 3, Ireland 1, Italy 7, Netherlands 2, UK 1, Greece 4, Spain 1, Portugal 3, Finland 1, Sweden 2, Cyprus 2, Czech Republic 6 | 6% | 41 | |
IND/DEM | Eurosceptics | Denmark 1, France 3, Ireland 1, Italy 4, Netherlands 2, UK 11, Greece 1, Sweden 3, Poland 10, Czech Republic 1 | 5% | 37 | |
NI | Independents | Belgium 3, France 7, Italy 4, UK 2, Austria 3, Poland 6, Czech Republic 1, Slovakia 3 | 4% | 29 | |
UEN | National conservatives | Denmark 1, Ireland 4, Italy 9, Latvia 4, Lithuania 2, Poland 7 | 4% | 27 | |
Sources: | 100% | 732 |
The national results as at 21 July 2004 are as follows:
Party group Country | EPP-ED | PES | ELDR | Greens-EFA | EUL-NGL | ID | UEN | others | MEPs | % | Turnout |
---|---|---|---|---|---|---|---|---|---|---|---|
Austria | 6 (ÖVP) | 7 (SPÖ) | 2 (GRÜNE) | 2 (Martin) 1 (FPÖ) | 18 | 2.5% | 42.43% | ||||
Belgium | 4 (CD&V/N-VA) 1 (CDH) 1 (CSP) | 4 (PS) 3 (SP.A) | 3 (VLD) 3 (MR) | 1 (Groen!) 1 (Ecolo) | 3 (VB) | 24 | 3.3% | 90.81% | |||
Cyprus | 2 (DISY) 1 (GTE) | 1 (DIKO) | 2 (AKEL) | 6 | 0.8% | 71.19% | |||||
Czech Republic | 9 (ODS) 2 (SNK) [a] 2 (KDU–ČSL) 1 (ED) [a] | 2 (ČSSD) | 6 (KSČM) | 1 (Ind.) | 1 (Ind.) | 24 | 3.3% | 28.32% | |||
Denmark | 1 (C) | 5 (S) | 3 (V) 1 (B) | 1 (SF) | 1 (N) | 1 (J) | 1 (DF) | 14 | 1.9% | 47.9% | |
Estonia | 1 (IL) | 3 (SDE) | 1 (K) 1 (ER) | 6 | 0.8% | 26.83% | |||||
Finland | 4 (Kok.) | 3 (SDP) | 4 (Kesk.) 1 (SFP) | 1 (Vihr.) | 1 (VAS) | 14 | 1.9% | 41.1% | |||
France | 17 (UMP) | 31 (PS) | 11 (UDF) | 6 (Verts) | 3 (PCF) | 3 (MPF) | 7 (FN) | 78 | 10.7% | 42.76% | |
Germany | 40 (CDU) 9 (CSU) | 23 (SPD) | 7 (FDP) | 13 (GRÜNE) | 7 (PDS) | 99 | 13.5% | 43.0% | |||
Greece | 11 (ND) | 8 (PASOK) | 3 (KKE) 1 (Synaspismós) | 1 (LAOS) | 24 | 3.3% | 63.4% | ||||
Hungary | 12 (FIDESZ) 1 (MDF) | 9 (MSZP) | 2 (SZDSZ) | 24 | 3.3% | 38.5% | |||||
Ireland | 5 (FG) | 1 (LAB) | 1 (Ind.) | 1 (SF) | 1 (Ind.) | 4 (FF) | 13 | 1.8% | 59.7% | ||
Italy | 16 (FI) 5 (UDC) 1 (SVP) 1 (UDEUR) 1 (PP) | 12 (DS) [b] 2 (SDI) [b] 2 (Ind.) [b] | 7 (DL) [b] 2 (LB) 2 (IdV) 1 (MRE) [b] | 2 (FdV) | 5 (PRC) 2 (PdCI) | 4 (LN) | 9 (AN) | 2 (SUE) 1 (AS) 1 (FT) | 78 | 10.7% | 73.1% |
Latvia | 2 (JL) 1 (TP) | 1 (LC) | 1 (PCTVL) | 4 (TB/LNNK) | 9 | 1.2% | 41.34% | ||||
Lithuania | 2 (TS) | 2 (LSDP) | 5 (DP) 2 (LiCS) | 1 (VNDPS) 1 (LDP) | 13 | 1.8% | 48.38% | ||||
Luxembourg | 3 (CSV) | 1 (LSAP) | 1 (DP) | 1 (Gréng) | 6 | 0.8% | 90.0% | ||||
Malta | 2 (PN) | 3 (PL) | 5 | 0.7% | 82.37% | ||||||
Netherlands | 7 (CDA) | 7 (PvdA) | 4 (VVD) 1 (D66) | 2 (GL) 2 (ET) | 2 (SP) | 2 (CU-SGP) | 27 | 3.7% | 39.3% | ||
Poland | 15 (PO) 4 (PSL) | 5 (SLD) 3 (SDPL) | 4 (UW) | 10 (LPR) | 7 (PiS) | 6 (SRP) | 54 | 7.4% | 20.87% | ||
Portugal | 7 (PSD) 2 (CDS-PP) | 12 (PS) | 2 (PCP) [c] 1 (BE) | 24 | 3.3% | 38.6% | |||||
Slovakia | 3 (SDKÚ) 3 (KDH) 2 (MKP) | 3 (SMER) | 3 (ĽS-HZDS) | 14 | 1.9% | 16.96% | |||||
Slovenia | 2 (NSi) 2 (SDS) | 1 (ZLSD) | 2 (LDS) | 7 | 1.0% | 28.3% | |||||
Spain | 24 (PP) | 24 (PSOE) | 1 (CDC) [d] 1 (EAJ) [d] | 1 (Verdes) [e] 1 (ICV) [f] 1 (ERC) [g] | 1 (IU) [f] | 54 | 7.4% | 45.1% | |||
Sweden | 4 (M) 1 (KD) | 5 (SAP) | 2 (FP) 1 (C) | 1 (MP) | 2 (V) | 3 (JL) | 19 | 2.6% | 37.8% | ||
United Kingdom [h] | 27 (CON) 1 (UUP) | 19 (LAB) | 12 (LD) | 2 (GPEW) 2 (SNP) 1 (PC) | 1 (SF) | 11 (UKIP) | 1 (UKIP) 1 (DUP) | 78 | 10.7% | 38.9% | |
Total | 268 | 200 | 88 | 42 | 41 | 37 | 27 | 29 | 732 | 100.0% | 45.6% |
![]() | This table possibly contains original research .(September 2007) |
The estimated votes by EU party are as follows:
Group | Votes | % Votes | Seats | +/- | Party/Subgroup | Votes | % Votes | Seats | +/- | ||
---|---|---|---|---|---|---|---|---|---|---|---|
EPP-ED | 52,534,612 | 34.0% | 277 | EPP | 44,670,810 | 28.9% | 227 | ||||
ED | 5,189,196 | 3.4% | 37 | ||||||||
Independents | 2,674,606 | 1.7% | 13 | ||||||||
PES | 37,271,453 | 24.1% | 198 | PES | 36,716,593 | 23.8% | 193 | ||||
Independents | 554,860 | 0.4% | 5 | ||||||||
ELDR | 13,732,594 | 8.9% | 66 | ELDR | 10,835,213 | 7.0% | 59 | ||||
Independents | 2,897,381 | 1.9% | 7 | ||||||||
EUL/NGL | 9,999,413 | 6.5% | 41 | PEL | 5,512,904 | 3.6% | 17 | ||||
NGLA 1 | 623,401 | 0.4% | 4 | ||||||||
EACL² | 529,782 | 0.3% | 0 | ||||||||
Independents | 3,333,327 | 2.2% | 20 | ||||||||
G/EFA | 9,742,287 | 6.3% | 40 | EGP | 8,290,609 | 5.4% | 33 | ||||
EFA | 946,834 | 0.6% | 4 | ||||||||
Independents | 504,844 | 0.3% | 3 | ||||||||
NI | 13,745,847 | 8.9% | 68 | Independents | 13,745,847 | 8.9% | 68 | ||||
UEN | 6,141,614 | 4.0% | 27 | UEN | 6,141,614 | 4.0% | 27 | ||||
EDD | 3,611,803 | 2.3% | 15 | ECPM 3 | 341,895 | 0.2% | 1 | ||||
Independents | 3,269,908 | 2.1% | 14 | ||||||||
Not elected | 7,094,142 | 4.6% | 0 | Not elected | 7,094,142 | 4.6% | 0 | ||||
Total | 154,317,718 | 100% | 732 | Total | 154,317,718 | 100% | 732 |
Registered voters: 353,460,958 (est.)
Votes cast: 154,317,718 (43.66%) (est.)
Total seats: 732
1. The figures for the Nordic Green Left Alliance and the European Anticapitalist Left include only those members that are not full members of the Party of the European Left.
2. See above.
![]() | This table possibly contains original research .(September 2007) |
The notional results by EU party as at 8 January 2007 are as follows:
Group | Votes | % Votes | Seats | +/- | Party/Subgroup | Votes | % Votes | Seats | +/- | ||
---|---|---|---|---|---|---|---|---|---|---|---|
EPP-ED | 52,567,771 | 34.1% | 277 | 0 | EPP | 46,183,932 | 27.5% | 232 | +5 | ||
ED 1 | 5,628,052 | 3.3% | 39 | +2 | |||||||
Independents | 755,786 | 1.6% | 6 | −7 | |||||||
PES | 43,327,099 | 25.8% | 218 | +20 | PES | 41,598,383 | 24.7% | 211 | +18 | ||
Independents | 1,728,716 | 1.0% | 7 | +2 | |||||||
ALDE | 21,375,247 | 12.7% | 106 | +40 | ELDR | 14,106,116 | 8.4% | 76 | +17 | ||
EDP | 6,037,453 | 3.6% | 25 | +25 | |||||||
Independents | 1,231,678 | 0.7% | 5 | −2 | |||||||
EUL/NGL | 9,873,587 | 5.9% | 41 | 0 | PEL | 6,842,489 | 4.1% | 28 | +10 | ||
NGLA² | 623,401 | 0.4% | 4 | 0 | |||||||
EACL 3 | 345,962 | 0.2% | 0 | 0 | |||||||
Independents | 2,061,735 | 1.2% | 9 | −10 | |||||||
G/EFA | 10,182,153 | 6.1% | 42 | +2 | EGP | 8,457,969 | 5.0% | 33 | 0 | ||
EFA | 1,277,042 | 0.8% | 6 | +2 | |||||||
Paul van Buitenen | 174,578 | 0.1% | 1 | ||||||||
Independents | 272,564 | 0.2% | 2 | −1 | |||||||
NI | 10,218,366 | 6.1% | 14 | -54 | Hans-Peter Martin | 262,272 | 0.2% | 1 | 1 | ||
Roger Helmer | 185,681 | 0.1% | 1 | 1 | |||||||
Jim Allister | 175,761 | 0.1% | 1 | 1 | |||||||
Independents | 1,658,374 | 1.0% | 11 | −57 | |||||||
UEN | 8,934,925 | 5.3% | 44 | +17 | AEN | 5,457,115 | 3.2% | 26 | +26 | ||
EUD 4 | 547,318 | 0.3% | 5 | +5 | |||||||
Independents | 2,980,491 | 1.8% | 13 | −14 | |||||||
IND/DEM | 5,265,991 | 3.1% | 23 | +8 | ADIE 5 | 1,687,718 | 1.0% | 7 | 7 | ||
ECPM 6 | 341,895 | 0.2% | 1 | 0 | |||||||
EUD 7 | 294,887 | 0.2% | 2 | 2 | |||||||
Independents | 2,941,491 | 1.7% | 13 | −1 | |||||||
ITS | 6,135,671 | 3.6% | 20 | 0 | Euronat 8 | 5,465,545 | 3.2% | 17 | 0 | ||
Ashley Mote | 215,556 | 0.1% | 1 | 0 | |||||||
Independents | 454,570 | 0.3% | 2 | 0 | |||||||
Not elected | 8,107,746 | 4.8% | 0 | Not elected | 8,107,746 | 4.8% | 0 | ||||
Total | 168,222,513 | 100% | 785 | +53 | Total | 168,222,513 | 100% | 785 | +53 |
Registered voters: 378,106,633 (est.)
Votes cast: 168,317,718 (44.49%) (est.)
Total seats: 785 (+53)
1. Roger Helmer was expelled from the EPP-ED group in 2005, but retains the whip of the British Conservative Party.
2. The figures for the Nordic Green Left Alliance and the European Anticapitalist Left include only those members that are not full members of the Party of the European Left.
3. See 2 above.
4. The EUDemocrats, while having a preference for the IND/DEM group, is currently split between UEN and IND/DEM.
5. In addition to the majority of AIDE MEPs which sit in the IND/DEM group, AIDE also includes Non-Inscrit MEP, Jim Allister, as an individual member.
6. The figures for the European Christian Political Movement exclude a number of members who hold concurrent membership of the European Peoples Party.
7. See 4 above.
Gibraltar participated as a result of the judgement in Matthews v. United Kingdom
The European Parliament (EP) is one of the two legislative bodies of the European Union and one of its seven institutions. Together with the Council of the European Union, it adopts European legislation, following a proposal by the European Commission. The Parliament is composed of 720 members (MEPs), after the June 2024 European elections, from a previous 705 MEPs. It represents the second-largest democratic electorate in the world, with an electorate of around 375 million eligible voters in 2024.
The Alliance of Liberals and Democrats for Europe Party is a European political party composed of 76 national-level parties from across Europe, mainly active in the European Union. The ALDE Party is affiliated with Liberal International and a recognised European political party, incorporated as a non-profit association under Belgian law.
The European People's Party Group is a political group of the European Parliament consisting of deputies (MEPs) from the member parties of the European People's Party (EPP). Sometimes it also includes independent MEPs and/or deputies from unaffiliated national parties. The EPP Group comprises politicians of Christian democratic, conservative and liberal-conservative orientation.
The European Democratic Group, more commonly known as European Democrats, was a conservative political group that operated in the European Parliament between 1979 and 1992. At its height in July 1979, it had 63 MEPs.
The 1999 European Parliament election was a European election for all 626 members of the European Parliament held across the 15 European Union member states on 10, 11 and 13 June 1999. The voter turn-out was generally low, except in Belgium and Luxembourg, where voting is compulsory and where national elections were held that same day. This was the first election where Austria, Finland and Sweden voted alongside the other member states, having joined in 1995 and voted separately. The next election was held in 2004.
The Greens/European Free Alliance (Greens/EFA) is a political group of the European Parliament composed primarily of green political parties.
The European Green Party (EGP), also referred to as European Greens, is a transnational, European political party representing national parties from across Europe who share Green values.
The June List was a Swedish left Eurosceptic political party. Founded in 2004, it received 14% in the European Parliament election of the same year - gaining three seats. In the elections of 2009, however, it saw a drop of 11 percentage points in support and lost all of its seats. Due to its subsequent decline the party has been inactive since the 2014 European Parliament election.
An election of Members of the European Parliament representing Netherlands constituency for the 2004–2009 term of the European Parliament was held on 10 June 2004. It was part of the wider 2004 European election. Fifteen parties competed in a D'Hondt type election for 27 seats.
The CDS – People's Party is a conservative and Christian democratic political party in Portugal. It is characterized as being between the centre-right and right-wing of the political spectrum. In voting ballots, the party's name appears only as the People's Party, with the abbreviation CDS–PP unchanged.
Independence/Democracy (IND/DEM) was a Eurosceptic political group that operated in the European Parliament between 2004 and 2009. At its height in 2004, it had 37 MEPs and it only existed during the European Parliament's 6th term. It was affiliated with the Eurosceptic Europeans United for Democracy party.
The European Democratic Party, also known as the European Democrats, is a centrist European political party in favour of European integration.
The political groups of the European Parliament are the officially recognised parliamentary groups consisting of legislators of aligned ideologies in the European Parliament.
The 2009 European Parliament election was held in the 27 member states of the European Union (EU) between 4 and 7 June 2009. A total of 736 Members of the European Parliament (MEPs) were elected to represent some 500 million Europeans, making these the biggest trans-national elections in history. An additional 18 observers were pre-elected.
The 1979 European Parliament election was a series of parliamentary elections held across all 9 European Community member states. They were the first European elections to be held, allowing citizens to elect 410 MEPs to the European Parliament, and also the first international election in history.
The Group of the Alliance of Liberals and Democrats for Europe was the liberal–centrist political group of the European Parliament from 2004 until 2019 when it merged into Renew Europe.
The sixth European Parliament was the sixth five-year term of the elected European Parliament. It began on Tuesday 20 July 2004 in Strasbourg following the 2004 elections and ended after the 2009 elections.
The European Conservatives and Reformists Group is a soft Eurosceptic, anti-federalist political group of the European Parliament. The ECR is the parliamentary group of the European Conservatives and Reformists Party European political party, but also includes MEPs from other European parties and MEPs without European party affiliation.
Renew Europe is a liberal, centrist to centre-right, pro-European political group of the European Parliament founded for the ninth European Parliament term. The group is the successor to the Alliance of Liberals and Democrats for Europe (ALDE) group which existed during the sixth, seventh and eighth terms from 2004 to 2019, and under a variety of other names in earlier Parliaments. Renew Europe in the European Committee of the Regions is the sister group of Renew Europe.
The 2024 European Parliament election was held in the European Union (EU) between 6 and 9 June 2024. It was the tenth parliamentary election since the first direct elections in 1979, and the first European Parliament election after Brexit. A total of 720 Members of the European Parliament (MEPs) were elected to represent more than 450 million people from 27 member states. This election also coincided with a number of other elections in some European Union member states.