| |||||||||||||||||||||||||||||||||||||||||||||||||||||||||||||||||||||||||||||||||||||||||||||||||
54 seats to the European Parliament | |||||||||||||||||||||||||||||||||||||||||||||||||||||||||||||||||||||||||||||||||||||||||||||||||
|---|---|---|---|---|---|---|---|---|---|---|---|---|---|---|---|---|---|---|---|---|---|---|---|---|---|---|---|---|---|---|---|---|---|---|---|---|---|---|---|---|---|---|---|---|---|---|---|---|---|---|---|---|---|---|---|---|---|---|---|---|---|---|---|---|---|---|---|---|---|---|---|---|---|---|---|---|---|---|---|---|---|---|---|---|---|---|---|---|---|---|---|---|---|---|---|---|---|
| Turnout | 20.87% | ||||||||||||||||||||||||||||||||||||||||||||||||||||||||||||||||||||||||||||||||||||||||||||||||
| |||||||||||||||||||||||||||||||||||||||||||||||||||||||||||||||||||||||||||||||||||||||||||||||||
 Election result and the plurality list's popular vote in each constituency | |||||||||||||||||||||||||||||||||||||||||||||||||||||||||||||||||||||||||||||||||||||||||||||||||


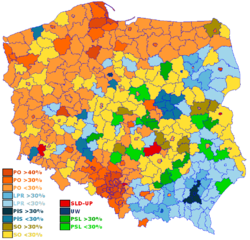
Elections to the European Parliament were held in Poland on 13 June 2004 as part of the wider 2004 European Parliament election. They were the first European Parliament elections held in Poland after the country's accession to the European Union in May 2004. Poland was allotted 54 members of the European Parliament. 20.87% of eligible citizens voted; of these, 97.33% of the votes cast were valid. The elections resulted in a heavy defeat for the governing Alliance of the Democratic Left and Labor Union parties, although the very low turnout makes a direct comparison with national election results difficult. As expected the most successful party was the Civic Platform. Second place was taken by the strongly anti-EU League of Polish Families.
Contents
- Opinion polls
- Results
- Elected members
- Civic Platform
- League of Polish Families
- Law and Justice
- Self-Defense of the Republic of Poland
- Democratic Left Alliance-Labor Union
- Freedom Union
- Polish People's Party
- Social Democratic Party of Poland
- Independent
- See also
- References
- External links
The radical populist Self-Defence of the Republic of Poland, which some opinion polls had predicted would come second, came fourth after the Law and Justice party. The election results were a success for Social Democracy of Poland, which managed to cross the required 5% threshold, and the Freedom Union, which got over twice the expected percentage of votes.