1994 European Parliament election in Germany

Last updated

1994 European Parliament election in Germany [1]
Flag of Germany.svg
  1989 12 June 1994 (1994-06-12) [1] 1999  

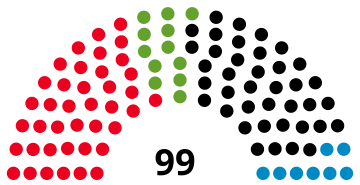
All 99 German seats in the European Parliament
Turnout60.0%
 First partySecond partyThird party
 
Party CDU/CSU SPD Greens
Alliance EPP PES G
Seats before32318
Seats won474012
Seat changeIncrease2.svg15Increase2.svg9Increase2.svg4
Popular vote13,739,44711,389,6973,563,268
Percentage38.8%32,2%10.1%
SwingIncrease2.svg1.1%Decrease2.svg5.1%Increase2.svg1.7%

An election of the delegation from Germany to the European Parliament (EP) was held in June 1994.

Due to the accession of the former East German states in 1990, these were the first EU elections in Germany to have East Germans voting. Additionally, the ratification of the 1992 Maastricht Treaty meant that for the first time, European Union citizens resident in Germany could vote on the German members of the European Parliament. [2]

The EP election was part of a "super election year" in Germany, which also saw the 1994 German federal election in October, alongside parliamentary elections in eight of sixteen German states. [3] Treating the EP election as a second-order election, [4] some commentators saw the good result for the reigning Christian Democratic Union (CDU) as a positive indicator of their chances in the subsequent federal elections (which the CDU did indeed win). [3] However, researchers later cast doubt on the notion that the 1994 EP election was a useful "test case" for subsequent national voting patterns. [5]

Results

1994 Europarliament election in Germany.svg
Party or allianceVotes%Seats+/–
PES Social Democratic Party 11,389,69732.1640+9
EPP Christian Democratic Union 11,346,07332.0439+14
G Alliance 90/The Greens 3,563,26810.0612+5
EPP Christian Social Union 2,393,3746.768+1
EUL Party of Democratic Socialism 1,670,3164.720New
ELDR Free Democratic Party 1,442,8574.070–4
NI The Republicans 1,387,0703.920–6
NI League of Free Citizens 385,6761.090New
NI The Grays – Gray Panthers 275,8660.780New
NI Ecological Democratic Party 273,7760.7700
NI Car-drivers' and Citizens' Interests Party 231,2650.650New
NI Statt Party 168,7380.480New
NI Party of the Willing to Work and Socially Vulnerable 127,1040.360New
NI Bavaria Party 110,7780.3100
NI New Forum 107,6150.300New
NI Party of Bible-abiding Christians 93,2100.260New
NI Natural Law Party 92,0310.260New
NI German Social Union 80,6180.230New
NI National Democratic Party 77,2270.2200
NI Christian Centre 66,7660.1900
NI Christian League 40,1150.1100
NI Die Unregierbaren – Autonome Liste 37,6720.110New
NI Bürgerrechtsbewegung Solidarität 23,8510.070New
NI Platform Europe for Workers and Democracy 12,9920.0400
NI Federation of Socialist Workers 10,6780.0300
NI Family Party of Germany 2,7810.010New
Total35,411,414100.0099+18
Valid votes35,411,41497.56
Invalid/blank votes884,1152.44
Total votes36,295,529100.00
Registered voters/turnout60,473,92760.02
Source: Federal Statistics Office

References

  1. 1 2 "Wahl zum 4. Europäischen Parlament am 12. Juni 1994" (in German). Bundeswahlleiter. Archived from the original on 2012-08-08. Retrieved 2012-05-05.
  2. "Ausländer können an deutscher Europawahl teilnehmen: Premiere für EU-Bürger". Berliner Zeitung (in German). 1994-03-15. Retrieved 2025-07-07.
  3. 1 2 "Europawahlen – Historisches Lexikon Bayerns". www.historisches-lexikon-bayerns.de. Retrieved 2025-07-07.
  4. Hix, Simon; Marsh, Michael (2011-03-01). "Second-order effects plus pan-European political swings: An analysis of European Parliament elections across time". Electoral Studies. Special Symposium: Electoral Democracy in the European Union. 30 (1): 4–15. doi:10.1016/j.electstud.2010.09.017. ISSN   0261-3794.
  5. Niedermayer, Oskar (1995). "Die Europawahl in der Bundesrepublik Deutschland im Kontext des Superwahljahres 1994". Integration. 18 (1): 22–30. ISSN   0720-5120.