1979 European Parliament election Last updated August 19, 2025 First election to the European Parliament
1979 European Parliament election Turnout 114,340,366 / 184,414,900 (62.0%) First party Second party Third party Leader Ernest Glinne [ fr ] Egon Klepsch James Scott-Hopkins Party S&D EPP ED Leader's seat Belgium (French) Germany Hereford and Worcester Seats won Popular vote 29,530,418 31,355,631 6,878,970 Percentage 26.62% 28.26% 6.20% Fourth party Fifth party Sixth party Leader Giorgio Amendola Martin Bangemann Christian de La Malène Party COM ELDR EPD Leader's seat Central Italy Germany France Seats won Popular vote 14,908,281 11,520,616 4,114,969 Percentage 13.44% 10.38% 3.71%
Post-election composition of each member state's delegation
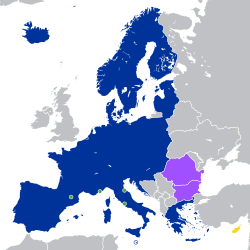
The 1979 European Parliament election was a series of parliamentary elections held across all 9 (at the time) European Community member states . They were the first European elections to be held, allowing citizens to elect 410 MEPs to the European Parliament , and also the first international election in history.
Seats in the Parliament had been allocated to the states according to population, and in some cases were divided into constituencies , but members sat according to political groups.
Background The Treaty of Rome which established the Communities specified that the European Parliament must be elected by universal suffrage using a common voting system . The Council of the European Union was responsible for setting up the elections but it had procrastinated. As a stop-gap measure, members were appointed to the Parliament by the member states from their own national parliaments, as they had done since the Common Assembly. [ 1] The Parliament was unhappy with this and threatened to take the Council to the European Court of Justice . The Council eventually agreed to elections and the first European Parliament elections were held in 1979 after proposals were put forward in the mid-1970s. [ 1] [ 2] The issue of a common voting method was left undecided, and even to this day the voting methods vary from member state to member state, although all have used some form of proportional representation since 1999.
Election In June, the 410 members were elected by universal suffrage. At the time there were no rules on the system of election to be used. The United Kingdom used a plurality voting system for multiple small constituencies in Great Britain but the other member states used proportional representation for fewer larger constituencies (usually the member state itself as a single constituency), albeit with different methods of seat allocation.
The electorate took little interest [ 3] but average voter turnout was 63%. The lowest turn out was in the United Kingdom with 32.2%: all others were above 50% apart from Denmark. Aside from Belgium and Luxembourg, where voting is compulsory , the highest turnout was in Italy with 84.9%. [ 4]
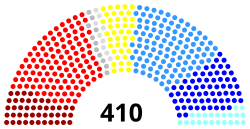
Result Socialist parties working together under the Europe-wide Confederation of Socialist Parties won the most seats: the resultant Socialist group had 113 MEPs. Christian Democrat parties united within the pan-European European People's Party came second, with the resultant group having 107 MEPs. The largest third force was the Conservative European Democrats with 64, followed by Communists with 44. The Liberal Democrats had 40 seats, although their candidate was elected as President.
The groups formed were loose coalitions based on the groups founded in previous years, but they soon became the basis for modern European political parties.
Party or alliance Votes % Seats Group of the European People's Party (EPP) Christian Democracy (Italy) (DC) 12,774,320 11.42 29 Christian Democratic Union of Germany (CDU) [ 5] 10,883,085 9.73 34 Christian Social Union in Bavaria (CSU) 2,817,120 2.52 8 Christian Democratic Appeal (CDA) 2,017,743 1.80 10 Union for French Democracy (UDF) [ 6] [ 7] [ 8] [ 9] 1,851,460 1.66 8 Christian People's Party (Flanders) (CVP) 1,607,941 1.44 7 Christian Social Party (Wallonia) (PSC) 445,912 0.40 3 Fine Gael 443,652 0.40 4 Christian Social People's Party (Luxembourg) (CSV) 352,296 0.31 3 South Tyrolean People's Party (SVP) 196,373 0.18 1 Christian Democrats (Denmark) [ 10] 30,985 0.03 0 Total 33,420,887 29.88 107 Socialist Group (SOC) Social Democratic Party of Germany (SPD) [ 11] 11,370,045 10.17 35 Socialist Party (France) (PS) – Movement of Radicals of the Left (MRG) 4,763,026 4.26 22 Labour Party (UK) 4,253,247 3.80 17 Italian Socialist Party (PSI) 3,866,946 3.46 9 Labour Party (Netherlands) (PvdA) 1,722,240 1.54 9 Italian Democratic Socialist Party (PSDI) 1,514,272 1.35 4 Belgian Socialist Party (Flanders) (BSP) 698,889 0.62 3 Belgian Socialist Party (Wallonia) (PSB) 575,824 0.51 4 Social Democrats (Denmark) 382,487 0.34 3 Luxembourg Socialist Workers' Party (LSAP) 211,106 0.19 1 Labour Party (Ireland) 193,898 0.17 4 Social Democratic and Labour Party (SDLP) 140,622 0.13 1 Siumut 5,118 0.00 1 Total 29,697,720 26.55 113 Communists and Allies Group (COM) Italian Communist Party (PCI) 10,361,344 9.26 24 French Communist Party (PCF) 4,153,710 3.71 19 Communist Party of Belgium (KPB/PCB) 145,796 0.13 0 German Communist Party (DKP) [ 12] 112,055 0.10 0 Communist Party of the Netherlands (CPN) [ 13] 97,343 0.09 0 Socialist People's Party (Denmark) (SF) 81,991 0.07 1 Communist Party of Luxembourg (KPL) 48,813 0.04 0 Total 15,001,052 13.41 44 Liberal and Democratic Group (LD) Union for French Democracy (UDF) [ 7] [ 8] 3,815,524 3.41 17 Liberal Party (UK) [ 14] 1,690,638 1.51 0 Free Democratic Party (Germany) (FDP) 1,662,621 1.49 4 Italian Liberal Party (PLI) 1,271,159 1.14 3 People's Party for Freedom and Democracy (VVD) 914,787 0.82 4 Italian Republican Party (PRI) 896,139 0.80 2 Party for Freedom and Progress (Flanders) (PVV) 512,363 0.46 2 Liberal Reformist Party (Wallonia) (PRL) 372,904 0.33 2 Democratic Party (Luxembourg) (DP) 274,307 0.25 2 Venstre (Denmark) 252,767 0.23 3 Thomas Joseph Maher (Independent from Ireland) [ 15] [ 16] 86,208 0.08 1 Total 11,749,467 10.50 40 European Democratic Group (ED) Conservative Party (UK) 6,508,492 5.82 60 Conservative People's Party (Denmark) (DKF) [ 17] 245,309 0.22 2 Ulster Unionist Party (UUP) 125,169 0.11 1 Centre Democrats (Denmark) (CD) 107,790 0.10 1 Total 6,986,760 6.25 64 Group of European Progressive Democrats (EPD) Rally for the Republic (France) (RPR) 3,301,980 2.95 15 Fianna Fáil 464,451 0.42 5 Scottish National Party (SNP) 247,836 0.22 1 Progress Party (Denmark) (FrP) 100,702 0.09 1 Total 4,114,969 3.68 22 Group for the Technical Coordination and Defence of Independent Groups and Members (CDI) Radical Party (Italy) (PR) 1,285,065 1.15 3 Proletarian Unity Party (Italy) (PdUP) 406,656 0.36 1 People's Movement against the EEC (Denmark) 365,760 0.33 4 People's Union (Flanders) (VU) 324,540 0.29 1 Proletarian Democracy (DP) 252,342 0.23 1 Independent Fianna Fáil 81,522 0.07 1 Total 2,715,885 2.43 11 Non-Inscrits (NI) Italian Social Movement (MSI) 1,909,055 1.71 4 Democrats 66 (D66) 511,967 0.46 2 Democratic Front of Francophones –Walloon Rally (DéFI-RW) 414,603 0.37 2 Democratic Unionist Party (DUP) 170,688 0.15 1 Total 3,006,313 2.69 9 Other parties and independents 5,154,957 4.61 0 Total 111,847,960 100.00 410 Source: Belgian Elections , Folketingsårbog , France Politique , jcautran.free.fr , France Politique , ElectionsIreland.org , Irish Elections , Italian Ministry of the Interior , Public.lu , Kiesraad , UK Parliament Briefing , House of Commons Library , CAIN Archive , Federal Statistics Office , Wahlen-in-Deutschland.de , Europe Politique
Votes summary EPP
29.88% SOC
26.55% COM
13.41% LD
10.50% ED
6.25% EPD
3.68% NI
2.69% CDI
2.43% Others
4.61%
Post election Simone Veil , elected as the first female President Louise Weiss , who was born in 1893 and thus 86 at the time, was found to be Parliament's oldest member and hence presided over the chamber while the election of the President took place (July 1979). Before that could happen however, she immediately had to deal with Ian Paisley MEP who, in the first speech of the session, protested that the British flag outside the building was flying upside down. [ 22] She dealt with the interruption swiftly. [ 23] The confrontation was seen as one of her finest hours and she later confided that, as a grandmother, she was used to dealing with "recalcitrant youngsters". [ 24]
There were five candidates for President of the European Parliament : Giorgio Amendola , Italian Communist ; Emma Bonino , Italian Technical Independent ; Christian de La Malène, French Progressive Democrat ; Simone Veil , French Liberal , and Mario Zagari, Italian Socialist . [ 25]
In the first ballot, Veil secured 183 of the 380 votes cast – eight short of the absolute majority needed. The next closest contender was Zagari with 118 votes, then Amendola with 44, de la Malène with 26 and Bonino with 9. Bonino and de la Malène dropped out and Veil secured an absolute majority in the second ballot with 192 of the 377 votes cast (Zagari gained 128 and Amendola 47). Veil was elected as the first President of the elected Parliament, and first female President of the Parliament since it was founded in 1952. [ 25]
The following were elected as Vice-Presidents: Danielle De March, Basil de Ferranti , Bruno Friedrich, Guido Gonella, Gérard Jacquet, Hans Katzer, Poul Møller, Pierre Pflimlin , Bríd Rodgers , Marcel Albert Vandewiele, Anne Vondeling and Mario Zagari . [ 25]
Previously the Parliament was a weak consultative assembly, the members of which were part-time. With the elections the new body of MEPs were full-time, energetic and more diverse. As soon as the Parliament was established the "old guard" MEPs of the larger parties sought to raise the bar at which a European Parliament political group could be formed (the status gave financial support and representation in committees). This move was quickly blocked by smaller groups working together and filibustering the proposal. The ties formed at this time laid the foundations of the Rainbow group: an alliance of left-wing and green parties [ 1] which later became the European Greens–European Free Alliance group.
Statistics European Parliament election, 1979 - Statistics Area Dates Seats Electorate Turnout Previous Next Election methods Sources European Community 7, 10 June 410 191,783,528 63% Inaugural 1981 All PR , except UK (not NI )FPTP [ 26] [ 27] [ 28]
European Parliament election, 1979 - Timeline Appointed Parliament 1979 Election Regrouping First Parliament Groups Pre-elections Change Results Change Results New First session SOC 63 +48 111 +2 113 SOC 113 CD 52 +54 106 +1 107 EPP 107 C 18 +45 63 +1 64 ED 64 COM 17 +27 44 +0 44 COM 44 LD 24 +17 41 -1 40 LD 40 EPD 19 +2 21 +1 22 EPD 22 NI 3 +21 24 +11 11 CDI 11 -15 9 NI 9 Total 196 +214 410 +0 410 Total 410 Sources: [ 19] [ 29] [ 18] [ 20] [ 21]
European Parliament election, 1979 - Delegation at 17 July 1979 Group Description Details % MEPs SOC Social Democrats West Germany 35, Belgium 7, Denmark 4, France 22, Ireland 4, Italy 13, Luxembourg 1, Netherlands 9, UK 18 28% 113 EPP Christian Democrats West Germany 42, Belgium 10, France 8, Ireland 4, Italy 30, Luxembourg 3, Netherlands 10 26% 107 ED Conservatives Denmark 3, UK 61 16% 64 COM Communists and the Far Left Denmark 1, France 19, Italy 24 11% 44 LD Liberals and Liberal Democrats West Germany 4, Belgium 4, Denmark 3, France 17, Ireland 1, Italy 5, Luxembourg 2, Netherlands 4 10% 40 EPD National Conservatives Denmark 1, France 15, Ireland 5, UK 1 5% 22 CDI Heterogeneous Belgium 1, Denmark 4, Ireland 1, Italy 5 3% 11 NI Independents Belgium 2, Italy 4, Netherlands 2, UK 1 2% 9 Sources: [ 18] [ 19] [ 20] [ 21] 100% 410
European Parliament election, 1979 - Votes by national party at unknown 1979 date Country Party Abbr. Group Votes % (nat.) Seats Italy Christian Democracy DC EPP 12,753,708 36.45 29 West Germany Social Democratic Party of Germany SPD SOC 11,370,045 40.83 35 West Germany Christian Democratic Union CDU EPP 10,883,085 39.08 34 Italy Italian Communist Party PCI COM 10,345,284 29.57 24 United Kingdom Conservative Party CP ED 6,508,493 48.40 60 France Union for French Democracy UDF LD 5,666,984 27.87 25 France Socialist Party – Movement of Left Radicals PS-MRG SOC 4,763,026 23.43 22 United Kingdom Labour Party LP SOC 4,253,207 31.63 17 France French Communist Party PCF COM 4,153,710 20.43 19 Italy Italian Socialist Party PSI SOC 3,858,295 11.03 9 France Rally for the Republic RPR EPD 3,301,980 16.24 15 West Germany Christian Social Union of Bavaria CSU EPP 2,817,120 10.12 8 Netherlands Christian Democratic Appeal CDA EPP 2,017,743 35.60 10 Italy Italian Social Movement MSI NI 1,907,880 5.45 4 Netherlands Labour Party PvdA SOC 1,722,240 30.39 9 United Kingdom Liberal Party L 1,691,531 12.58 West Germany Free Democratic Party FDP LD 1,662,621 5.97 4 Belgium Christian People's Party CVP EPP 1,607,941 29.54 7 Italy Italian Democratic Socialist Party PSDI SOC 1,512,425 4.32 4 Italy Radical Party PR CDI 1,283,512 3.67 3 Italy Italian Liberal Party PLI LD 1,270,152 3.63 3 Netherlands People's Party for Freedom and Democracy VVD LD 914,787 16.14 4 Italy Italian Republican Party PRI LD 895,558 2.56 2 West Germany The Greens GRÜNE 893,683 3.21 France Ecological Europe VERTS 891,683 4.39 Belgium Socialist Party SP SOC 698,889 12.84 3 France Workers' Struggle – Revolutionary Communist League LO-LCR 623,663 3.07 Belgium Socialist Party PS SOC 575,824 10.58 4 Belgium Party for Freedom and Progress PVV LD 512,363 9.41 2 Netherlands Democracy 66 D66 NI 511,967 9.03 2 Ireland Fianna Fáil FF EPD 464,451 34.68 5 Belgium Christian Social Party PSC EPP 445,912 8.19 3 Ireland Fine Gael FG EPP 443,652 33.13 4 Belgium Democratic Front of Francophones FDF NI 414,603 7.62 2 Italy Proletarian Unity Party PdUP CDI 406,007 1.16 1 Denmark Social Democrats S SOC 382,487 21.80 3 France 5th List: Employment. Equality. Europe 5-EEE 373,259 1.84 Belgium Liberal Reformist Party PRL LD 372,904 6.85 2 Denmark People's Movement against the EU FolkeB CDI 365,760 20.85 4 Luxembourg Christian Social People's Party CSV EPP 352,296 36.12 3 Belgium People's Union VU CDI 324,540 5.96 1 France Inter-Professional Union for an UDIP-FIDES 290,555 1.43 Luxembourg Democratic Party DP LD 274,307 28.12 2 France Party of New Forces PFN 265,911 1.31 Denmark Venstre V LD 252,767 14.41 3 Italy Proletarian Democracy DP CDI 251,927 0.72 1 United Kingdom Scottish National Party SNP EPD 247,836 1.84 1 Denmark Conservative People's Party KF EPP 245,309 13.98 2 Luxembourg Luxembourg Socialist Workers' Party LSAP SOC 211,106 21.64 1 Italy South Tyrolean People's Party SVP EPP 196,277 0.56 1 Ireland Irish Labour Party ILP SOC 193,898 14.48 4 Ireland Independents Ind. NI 189,499 14.15 2 United Kingdom Democratic Unionist Party DUP NI 170,688 1.27 1 Italy Valdostan Union – Sardinian Action Party UV-PSd'Az 166,194 0.47 Belgium Communist Party of Belgium PCB-KPB 145,796 2.68 Italy National Democracy DN 142,354 0.41 United Kingdom Social Democratic and Labour Party SDLP SOC 140,622 1.05 1 Netherlands Reformed Political Party SGP 126,412 2.23 United Kingdom Ulster Unionist Party UUP ED 125,169 0.93 1 United Kingdom Independents Ind. 112,366 N/A West Germany German Communist Party DKP 112,055 0.40 Belgium Confederated Ecologists ECOLO 107,833 1.98 Denmark Centre Democrats CD ED 107,790 6.14 1 Denmark Progressive Party FP EPD 100,702 5.74 1 Netherlands Communist Party of the Netherlands CPN 97,343 1.72 Netherlands Pacifist Socialist Party PSP 97,243 1.72 Netherlands Political Party of Radicals PPR 92,055 1.62 United Kingdom Plaid Cymru PC 83,399 0.62 Denmark Socialist People's Party SF COM 81,991 4.67 1 Belgium Another way of Living AGALEV 77,986 1.43 Luxembourg Social Democratic Party SDP 68,289 7.00 Netherlands Reformed Political League GPV 62,610 1.10 Denmark Justice League DR 60,954 3.47 Denmark Left Socialists VS 59,379 3.38 Denmark Radical Left RV 56,944 3.25 Luxembourg Communist Party of Luxembourg KPL 48,813 5.00 Belgium All Power to the Workers TPO-AMADA 45,423 0.83 West Germany Christian Bavarian People's Party CBV 45,311 0.16 Ireland Sinn Féin – The Workers Party SFWP 43,942 3.28 United Kingdom Alliance Party of Northern Ireland A 39,026 0.29 Belgium Flemish People's Party VVP 34,706 0.64 West Germany European Workers Party EAP 31,822 0.11 West Germany German Centre Party ZENTRUM 31,367 0.11 Denmark Christian People's Party KrF 30,985 1.77 United Kingdom United Against the Common Market UACM 27,506 N/A Netherlands Leschot List LL 24,903 0.44 Belgium E-NON E-NON 22,187 0.41 United Kingdom Ecology Party EP 17,953 0.13 Belgium PLW-PLE PLW-PLE 17,566 0.32 Belgium Workers Revolutionary League LRT-RAL 16,911 0.31 United Kingdom Mebyon Kernow MK 10,205 N/A Luxembourg Alternative List AL 9,845 1.01 Belgium PPB PPB 9,704 0.18 Belgium PFU PFU 7,273 0.13 United Kingdom United Labour Party ULP 6,122 1.1 Luxembourg Liberal Party LP 5,610 0.58 Luxembourg Revolutionary Socialist Party RSP 5,085 0.52 Belgium POE POE 4,617 0.08 United Kingdom Workers' Party WP 4,418 0.8 United Kingdom Unionist Party of Northern Ireland UPNI 3,712 0.6 Ireland CDI CDI 3,630 0.27 United Kingdom International Marxist Group IMG 1,635 N/A United Kingdom Ulster Liberal Party ULP 932 0.2 United Kingdom EFP EFP 497 N/A France Europe – Self-Management List PSU 382 0.00 France Regions-Europe RE 337 0.00 Source: [ 30]
References 1 2 3 Hoskyns, Catherine; Michael Newman (2000). Democratizing the European Union: Issues for the twenty-first Century (Perspectives on Democratization . Manchester University Press . ISBN 978-0-7190-5666-6 ↑ Patijn Report 1 2 Electing a New Parliament , Time Magazine 11 June 1979 ↑ Rates of participation in European elections (1979–2004) on CVCE website ↑ Including two indirectly elected members from West Berlin ↑ Only members of UDF who were part of the EPP group 1 2 Marius Autran and Jean-Claude Autran. "Elections européennes du 10 juin 1979 (1ère législature)" . jcautran.free.fr . Retrieved 25 June 2024 . 1 2 Laurent de Boissieu. "Élections européennes 1979" . www.france-politique.fr . France Politique. Retrieved 25 June 2024 . ↑ "Olivier LEFEVRE D'ORMESSON" . www.europarl.europa.eu . European Parliament. 5 August 1918. Retrieved 25 June 2024 . ↑ "ELECTION OF THE EUROPEAN PARLIAMENT 17 JUNE 1984 (in Italian)" (PDF) . lipari.istat.it . ISTAT. Retrieved 25 June 2024 . ↑ Including one indirectly elected member from West Berlin ↑ "ELECTION OF THE EUROPEAN PARLIAMENT 17 JUNE 1984 (in Italian)" (PDF) . lipari.istat.it . ISTAT. Retrieved 25 June 2024 . ↑ "HARTOG, Wessel (COM, NL)" . www.europarl.europa.eu . European Parliament. Retrieved 25 June 2024 . ↑ Dimitri Almeida (2012). The Impact of European Integration on Political Parties: Beyond the Permissive Consensus 102– 103. ISBN 978-1-136-34039-0 ↑ "Thomas Joseph MAHER" . www.europarl.europa.eu . European Parliament. 29 April 1922. Retrieved 25 June 2024 . ↑ "Munster: 1979 European Election" . irelandelection.com . Retrieved 25 June 2024 . ↑ "List of Danish MEPs (in Danish) on Wayback Machine" (PDF) . www.europarl.dk . European Parliament. Archived from the original (PDF) on 31 March 2012. Retrieved 25 June 2024 . 1 2 3 "Parlement européen 1979 - Parlement élu en 1979" . www.europe-politique.eu (in French). 1 2 3 "Elections Europeennes" (PDF) (in French). Archived from the original (PDF) on 11 September 2008. 1 2 3 "Democracy in the European Parliament" (PDF) . emlab.berkeley.edu . 1 2 3 "Power to the Parties: Cohesion and Competition in the European Parliament, 1979-2001" (PDF) . Archived from the original (PDF) on 11 September 2008. ↑ Matthew Tempest and agencies Paisley to stand down as MEP , The Guardian , 19 January 2004 ↑ How? Did she climb the flagpole and fixed it? ↑ A number of names worth remembering ... , European Voice , 26 November 1998 1 2 3 Election of the President of the European Parliament , European Parliament ↑ "Elections 1989 - Results and members" (PDF) . Archived from the original (PDF) on 25 March 2009. ↑ "Election '79 - Voting figures and winners" (PDF) . Archived from the original (PDF) on 19 August 2008. ↑ "Turnout trends at European elections" . European Parliament . 2004. ↑ "Elections '79 - The results" (PDF) . Archived from the original (PDF) on 17 May 2011. ↑ "Arxiu Històric Electoral - Unió Europea" . Archived from the original on 21 June 2012. External links
1979 1984 1989 1994 1999 2004 2009 2014 2019 2024 2029 Austria Belgium Bulgaria Croatia Cyprus Czech Republic Denmark Estonia Finland France Germany Greece Hungary Ireland Italy Latvia Lithuania Luxembourg Malta Netherlands Poland Portugal Romania Slovakia Slovenia Spain Sweden Off-year
This page is based on this
Wikipedia article Text is available under the
CC BY-SA 4.0 license; additional terms may apply.
Images, videos and audio are available under their respective licenses.