22 May 2014 | |||||||||||||||||||||||||||||||||||||||||||||||||||||||||||||||||||||||||||||||||||||||||||||||||||||||||||||||||
All 73 United Kingdom seats to the European Parliament | |||||||||||||||||||||||||||||||||||||||||||||||||||||||||||||||||||||||||||||||||||||||||||||||||||||||||||||||||
|---|---|---|---|---|---|---|---|---|---|---|---|---|---|---|---|---|---|---|---|---|---|---|---|---|---|---|---|---|---|---|---|---|---|---|---|---|---|---|---|---|---|---|---|---|---|---|---|---|---|---|---|---|---|---|---|---|---|---|---|---|---|---|---|---|---|---|---|---|---|---|---|---|---|---|---|---|---|---|---|---|---|---|---|---|---|---|---|---|---|---|---|---|---|---|---|---|---|---|---|---|---|---|---|---|---|---|---|---|---|---|---|---|---|
| Registered | 46,481,532 [n 1] | ||||||||||||||||||||||||||||||||||||||||||||||||||||||||||||||||||||||||||||||||||||||||||||||||||||||||||||||||
| Turnout | 35.6% [1] | ||||||||||||||||||||||||||||||||||||||||||||||||||||||||||||||||||||||||||||||||||||||||||||||||||||||||||||||||
| |||||||||||||||||||||||||||||||||||||||||||||||||||||||||||||||||||||||||||||||||||||||||||||||||||||||||||||||||
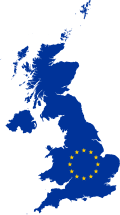
 Map of the 2014 European Parliamentary Election in the United Kingdom | |||||||||||||||||||||||||||||||||||||||||||||||||||||||||||||||||||||||||||||||||||||||||||||||||||||||||||||||||
 | |||||||||||||||||||||||||||||||||||||||||||||||||||||||||||||||||||||||||||||||||||||||||||||||||||||||||||||||||


| Part of a series of articles on |
| UK membership of the European Union (1973–2020) |
|---|
 |
The 2014 European Parliament election was the United Kingdom's component of the 2014 European Parliament election, held on Thursday 22 May 2014, [2] [3] coinciding with the 2014 local elections in England [4] and Northern Ireland. In total, 73 Members of the European Parliament were elected from the United Kingdom using proportional representation. England, Scotland and Wales use a closed-list party list system of PR (with the D'Hondt method), while Northern Ireland used the single transferable vote (STV).
Contents
- Voting system and regional representation
- Returning officers
- MEPs before the 2014 election, by European Parliament group
- Parties and candidates
- Retiring/resigned incumbents
- British Democratic Party
- Conservative
- Green
- Labour
- Liberal Democrats
- UKIP
- Debates
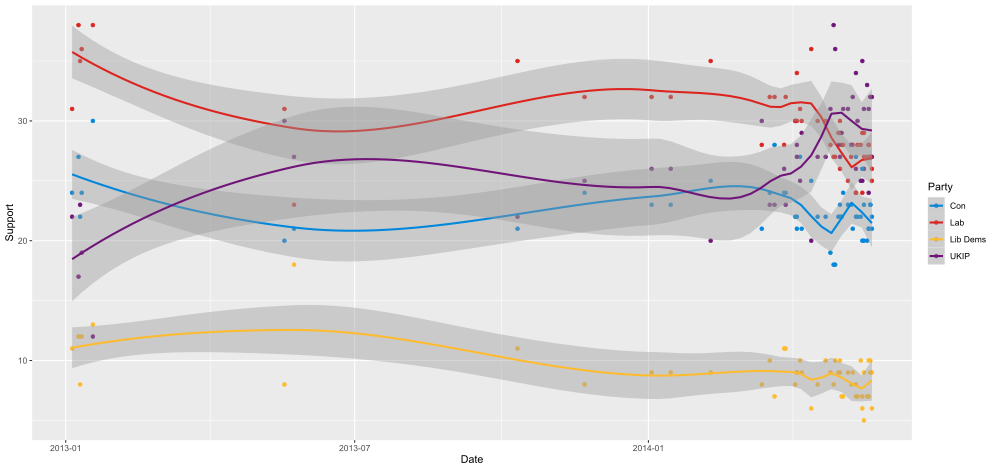
- Opinion polls
- Graphical summary
- 2014
- 2013
- Scottish polls
- Welsh polls
- London polls
- Results
- United Kingdom results
- Election results by constituency
- MEPs defeated
- Analysis
- See also
- Notes
- References
- External links
- Manifestos
Most of the election results were announced after 10pm on Sunday 25 May – with the exception of Scotland, which did not declare its results until the following day – after voting closed throughout the 28 member states of the European Union.
The most successful party overall was the UK Independence Party (UKIP) which won 24 seats and 27% of the popular vote, the first time a political party other than the Labour Party or Conservative Party had won the popular vote at a British election since the 1906 general election. [5] [6] It was also the first time a party other than Labour or Conservative had won the largest number of seats in a national election since the December 1910 general election. [7] [8] [9] In addition, the 23.1% of the vote won by the Conservatives was the lowest recorded vote share for the party in a national election until 2019.
The Labour Party became the first Official Opposition party since 1984 to fail to win a European Parliament election, although it did gain 7 seats, taking its overall tally to 20. The governing Conservative Party was pushed into third place for the first time at any European Parliament election, falling to 19 seats, while the Green Party of England and Wales saw its number of MEPs increase for the first time since 1999, winning 3 seats. In Scotland, the Scottish National Party won the largest share of the vote, taking 29% of the vote and 2 MEPs. The Liberal Democrats, who were in government in the UK with the Conservatives at the time, lost 10 of the 11 seats they were defending, and won just 7% of the popular vote.
Figures released in December 2014 showed that the Conservatives and UKIP each spent £2.96m on the campaign, the Liberal Democrats £1.5m, and the Labour Party approximately £1m. [10]