1868 United Kingdom general election

Last updated

1868 United Kingdom general election
Flag of the United Kingdom.svg
  1865 17 November – 7 December 1868 (1868-11-17 1868-12-07) 1874  

All 658 seats in the House of Commons
330 seats needed for a majority
Turnout2,333,251
 First partySecond party
  William Ewart Gladstone CDV 1861 for infobox.jpg Benjamin Disraeli, 1878 (cropped).jpg
Leader William Gladstone Benjamin Disraeli
Party Liberal Conservative
Leader since3 December 186827 February 1868
Leader's seat Greenwich
(Defeated at South West Lancashire)
Buckinghamshire
Last election369 seats, 59.5%289 seats, 40.5%
Seats won387 [a] 271
Seat changeIncrease2.svg18Decrease2.svg18
Popular vote1,428,776903,318
Percentage61.2%38.7%
SwingIncrease2.svg1.7 pp Decrease2.svg1.8 pp

United Kingdom general election 1868.svg
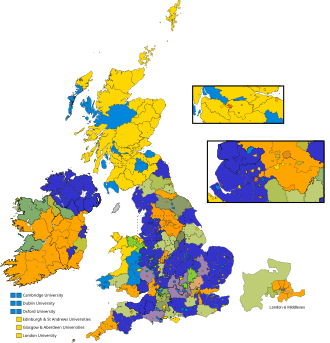
Colours denote the winning party

1868 UK GE Composition diagram.svg
Composition of the House of Commons after the election

Prime Minister before election

Benjamin Disraeli
Conservative

Prime Minister after
election

William Gladstone
Liberal

The 1868 United Kingdom general election was held between 17 November to 7 December 1868. The Liberal Party, under William Ewart Gladstone, defeated the governing Conservative minority government, led by Benjamin Disraeli.

Contents

This was the first general election to be held after the passage of the Reform Act 1867, which enfranchised many male householders, thus greatly increasing the number of men who could vote in elections in the United Kingdom. It was the first election held in the United Kingdom in which more than a million votes were cast; nearly triple the number of votes were cast compared to the previous election in 1865.[ citation needed ]

This was the last general election at which all seats were taken by only the two leading parties, although the parties at the time were loose coalitions and party affiliation was not listed on registration papers.[ citation needed ]

Results

1868 UK parliament.svg
UK General Election 1868
PartyCandidatesVotes
StoodElectedGainedUnseatedNet% of total%No.Net %
  Liberal 600387 [a] +1858.8161.241,428,776+2.0
  Conservative 4362711841.1938.71903,3182.1
 Others3000000.051,157N/A

Voting summary

Popular vote
Liberal
61.24%
Conservative
38.71%
Others
0.05%

Seats summary

Parliamentary seats
Liberal
58.81%
Conservative
41.19%
Others
0.0%

Regional results

Great Britain

PartyCandidatesUnopposedSeatsSeats changeVotes%% change
Liberal 51580321Increase2.svg71,374,31561.4
Conservative 38365234Decrease2.svg10864,55138.6
Other1009690.0
Total899145555Decrease2.svg32,239,835100
England
PartyCandidatesUnopposedSeatsSeats changeVotes%% change
Liberal 41246244Decrease2.svg71,192,09859.7
Conservative 33454211Decrease2.svg2803,63740.2
Other1009690.1
Total747100455Decrease2.svg91,996,704100
Scotland
PartyCandidatesUnopposedSeatsSeats changeVotes%% change
Liberal 702351Increase2.svg9125,35682.5
Conservative 2037Decrease2.svg423,98517.5
Total902658Increase2.svg5149,341100
Wales
PartyCandidatesUnopposedSeatsSeats changeVotes%% change
Liberal 291023Increase2.svg552,25662.1
Conservative 20410Decrease2.svg429,86637.9
Total491433Increase2.svg182,122100

Ireland

PartyCandidatesUnopposedSeatsSeats changeVotes%% change
Liberal 854166Increase2.svg854,46157.9+2.3
Irish Conservative 532637Decrease2.svg838,76541.9Decrease2.svg2.5
Other200Steady2.svg1880.2+0.2
Total14067103Steady2.svg149,341100

Universities

PartyCandidatesUnopposedSeatsSeats changeVotes%% change
Conservative 946Steady2.svg7,06355.4
Liberal 413Increase2.svg34,60544.6
Total135911,668100

See also

Notes

  1. 1 2 The seat and vote count figures for the Liberals given here include the Speaker of the House of Commons

References and further reading