Elections in Scotland Last updated November 24, 2025 Scottish Parliament Scottish Parliamentary elections use the Additional Member System (AMS). Under this system, voters are given two votes : one for their constituency, which elects a single MSP by first-past-the-post ; and one for their region, which elects seven MSPs by closed list . Five Scottish Parliamentary elections have been held since the reconvention of the Scottish Parliament in 1999. Elections are held every five years, on the first Thursday in May.
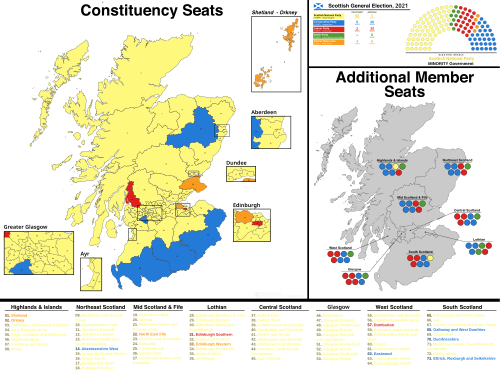
Scottish Parliament election results 2021 Party Seats Seats Constituency votes Constituency votes, of total (%) Constituency vote change (%) Regional votes Regional votes, of total (%) Regional vote change (%) Total votes Total votes, (%) Total votes change (%) Seats won, of total (%) SNP 64 1,291,204 47.7 1,094,374 40.3 2,385,578 43.89 49.6 Conservative 31 592,518 21.9 637,131 23.5 1,229,649 22.62 24.0 Labour 22 584,392 21.6 488,819 18.0 1,073,211 19.74 17.05 Green 8 34,990 1.3 220,324 8.1 255,314 4.69 6.2 Liberal Democrats 4 187,746 6.9 137,152 5.1 324,898 5.97 3.1 Other 0 15,833 0.58 137,984 5.1 153,817 2.83 0.0 2,706,761 100 2,712,784 100 5,434,851 100 Registered voters/Turnout 4,280,785 63.46 4,280,785 63.49 8,561,570 63.47
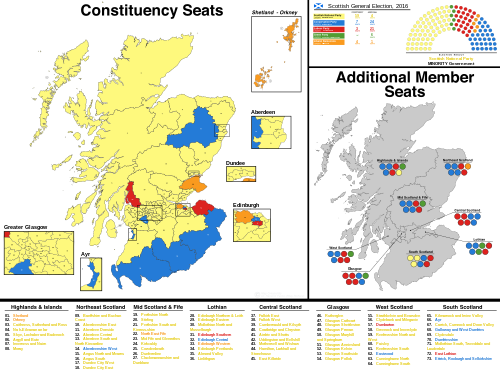
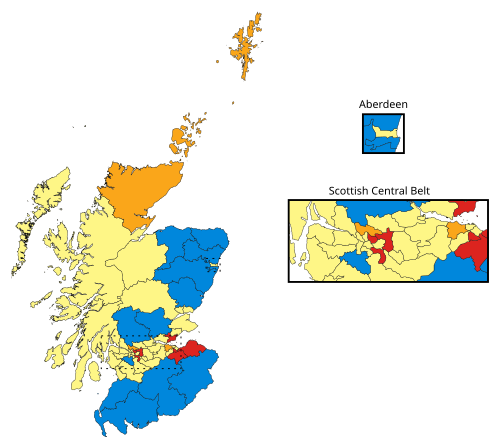
2016 A map showing the constituency winners of the Election by their party colours. Party Seats Seats Constituency votes Constituency votes, of total (%) Constituency vote change (%) Regional votes Regional votes, of total (%) Regional vote change (%) Total votes Total votes, (%) Total votes change (%) Seats won, of total (%) SNP 63 1,059,897 46.5 953,587 41.7 2,013,484 44.10 48.8 Conservative 31 501,844 22.0 524,222 22.9 1,026,066 22.47 24.03 Labour 24 514,261 22.6 435,919 19.1 950,180 20.81 18.60 Green 6 13,172 0.6 150,426 6.6 163,598 3.58 4.65 Liberal Democrats 5 178,238 7.8 119,284 5.2 297,522 6.51 3.87 Other 0 11,741 0.5 102,314 4.5 114,055 2.49 0 2,279,154 100 2,285,752 100 4,564,906 100 Registered voters/Turnout 4,099,907 55.90 4,099,907 55.75 5,434,851 55.67
2011 Party Seats Seats Constituency votes Constituency votes, of total (%) Constituency vote change (%) Regional votes Regional votes, of total (%) Regional vote change (%) Total votes Total votes, (%) Total votes change (%) Seats won, of total (%) SNP 69 902,915 45.5 876,421 44.0 1,779,336 44.70 53.48 Labour 37 630,461 31.7 523,469 26.3 1,153,930 28.99 28.68 Conservative 15 276,652 13.9 245,967 12.4 522,619 13.13 11.6 Liberal Democrats 5 157,714 7.9 103,472 5.2 261,186 6.56 3.87 Green 2 0 0.0 86,939 4.4 86,939 2.18 1.55 Other 1 21,534 1.08 149,809 7.52 171,343 4.30 0.77 1,989,276 100 1,990,836 100 3,980,112 100 Registered voters/Turnout 3,950,626 50.35 3,950,626 50.39 7,901,252 50.37
2007 Party Seats Seats Constituency votes Constituency votes, of total (%) Constituency vote change (%) Regional votes Regional votes, of total (%) Regional vote change (%) Total votes Total votes, (%) Total votes change (%) Seats won, of total (%) SNP 47 664,227 32.9 633,611 31.0 1,297,838 31.96 36.43 Labour 46 648,374 32.1 595,415 29.1 1,243,789 30.63 35.65 Conservative 17 334,743 16.6 284,035 13.9 614,778 15.14 13.17 Liberal Democrats 16 326,232 16.2 230,651 11.3 556,883 13.74 12.40 Green 2 2,971 0.1 82,577 4.0 85,584 2.10 1.55 Other 1 40,431 2.0 216,577 10.6 257,008 6.33 0.77 2,016,978 100 2,042,866 100 4,059,844 100 Registered voters/Turnout 3,950,626 51.05 3,950,626 51.70 7,901,252 51.38
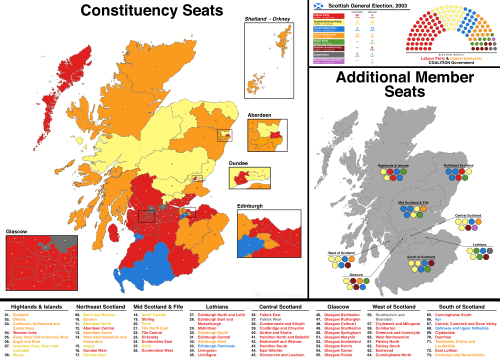
2003 Party Seats Seats Constituency votes Constituency votes, of total (%) Constituency vote change (%) Regional votes Regional votes, of total (%) Regional vote change (%) Total votes Total votes, (%) Total votes change (%) Seats won, of total (%) Labour 50 663,585 34.6 561,375 29.3 1,224,960 31.96 38.8 SNP 27 455,722 23.8 399,659 20.9 855,381 22.31 20.9 Conservative 18 318,279 16.6 296,929 15.5 615,208 16.05 14.0 Liberal Democrats 17 294,347 15.4 225,774 11.8 520,121 13.57 13.2 Green 7 - - - 132,138 6.9 132,138 3.44 5.4 Other 10 184,641 9.6 299,946 14.6 484,587 12.64 7.9 1,916,574 100 1,915,821 100 3,832,395 100 Registered voters/Turnout 3,877,460 49.42 3,877,460 49.40 7,754,920 49.49
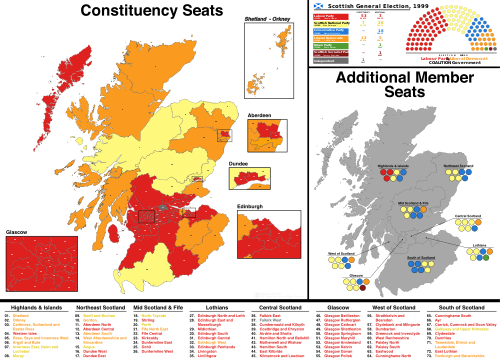
1999 Party Seats Constituency votes Constituency votes, of total (%) Regional votes Regional votes, of total (%) Total votes Total votes, (%) Seats won, of total (%) Labour 56 908,346 38.8 786,818 33.6 1,695,164 36.21 43.41 SNP 35 672,768 28.7 638,644 27.3 1,311,412 28.01 27.13 Conservative 18 364,425 15.6 359,109 15.4 723,534 15.45 13.95 Liberal Democrats 17 333,179 14.2 290,760 12.4 623,939 13.32 13.17 Green 1 - - 84,023 3.6 84,023 1.79 0.77 Other 2 63,770 2.7 179,481 7.5 243,251 5.19 1.55 2,342,488 100 2,338,835 100 4,681,323 100 Registered voters/Turnout 4,027,433 58.16 4,027,433 57.97 8,054,866 58.11
By-elections 2019 Shetland by-election , Lib Dem hold 2017 Ettrick, Roxburgh and Berwickshire by-election , Con hold 2014 Cowdenbeath by-election , Lab hold 2013 Dunfermline by-election , Lab gain from SNP 2013 Aberdeen Donside by-election , SNP hold 2006 Moray by-election , SNP hold 2005 Glasgow Cathcart by-election , Lab hold 2001 Banff and Buchan by-election , SNP hold 2001 Strathkelvin and Bearsden by-election , Lab hold 2000 Glasgow Anniesland by-election , Lab hold 2000 Ayr by-election , Con gain from Lab UK Parliament Scotland election results by percentage of popular vote, 1900–2019. Conservative total includes Liberal Unionists 1900–1910 and Liberal Nationals 1931–1964. Liberal total incorporates Liberal Party (1900–1979), Alliance (1983–1987) and Liberal Democrats (since 1992). 2024 2024 Map [ 1]
Party Seats Seats Seats Votes Votes, of total (%) Change (%) Labour 37 57 851,897 35.3 SNP 9 57 724,758 30.0 Conservative 5 57 307,344 12.7 Liberal Democrats 6 57 234,228 9.7 Reform 0 New 57 167,979 7.0 Green 0 44 92,685 3.8 Other 0 35,919 1.5 Turnout 2,414,810 59.2
2019 2019 Map [ 2]
Party Seats Seats Seats Votes Votes, of total (%) Change (%) SNP 48 59 [ note 1] 1,242,380 45.0 Conservative 6 59 [ note 2] 692,939 25.1 Liberal Democrats 4 59 263,417 9.5 Labour 1 59 [ note 3] 511,838 18.6 Green 0 22 [ 3] 28,122 1.0 Brexit Party 0 15 13,243 0.5 New UKIP 0 6 3,303 0.1 Other 0 3,819 0.1 Turnout 2,759,061 68.1
↑ Kirkcaldy and Cowdenbeath candidate Neale Hanvey was suspended before the election but appeared on ballot papers as an SNP candidate. ↑ Aberdeen North candidate Ryan Houghton and Glasgow Central candidate Flora Scarabello were both suspended before the election but appeared on the ballot paper as Conservative candidates. ↑ Falkirk candidate Safia Ali was suspended before the election but appeared on ballot papers as a Labour candidate.
2017 2017 Map [ 4]
Party Seats Seats Seats Votes Votes, of total (%) Change (%) SNP 35 59 977,569 36.9 Conservative 13 59 757,949 28.6 Labour 7 59* 717,007 27.1 Liberal Democrats 4 59 179,061 6.8 Green 0 3 5,886 0.2 UKIP 0 10 5,302 0.2 Other 0 6,921 0.3 Turnout 2,649,695 66.4
2015 2015 Map At the 2015 election the SNP won a majority of Scottish seats for the first time.
[ 5]
Party Seats Seats Seats, of total (%) Seats Votes Votes, of total (%) Change (%) SNP 56 94.6 59 1,454,436 50.0 Labour 1 1.7 59* 707,147 24.3 Conservative 1 0 1.7 59 434,097 14.9 Liberal Democrats 1 1.7 59 219,675 7.5 UKIP 0 0 41 47,078 1.6 Green 0 0 32 39,205 1.3 Other 0 0 37 8,827 0.3 Turnout 2,910,465 71.1
2010 2010 Map Party Seats Seats Seats, of total (%) Candidates Votes % % Labour 41 69.4 59 1,035,528 42.0 Liberal Democrats 11 18.6 59 465,471 18.9 SNP 6 10.16 59 491,386 19.9 Conservative 1 1.69 59* 412,855 16.7 UKIP 0 0 34 17,223 0.7 Green 0 0 20 16,827 0.7 Other 0 0 45 19,555 0.8 Turnout: 2,465,722 63.8
* Philip Lardner, the Conservative candidate for North Ayrshire and Arran was disowned by the Conservative Party for comments he posted on his website, calling homosexuality 'abnormal'. It was too late for him to be replaced and he still read as the Scottish Conservative & Unionist Party candidate on the ballot paper.
2005 2005 Map Party Seats Seats Seats, Votes % % Labour 41 69.4 922,402 39.5 Liberal Democrats 11 18.6 528,076 22.6 SNP 6 10.16 412,267 17.7 Conservative 1 1.7 369,388 15.8 Scottish Socialist 0 0 43,514 1.9 Green 0 0 25,760 1.1 UKIP 0 0 8,859 0.4 Other 0 0 15,490 0.66 Turnout: 2,333,887 60.6
2001 2001 Map 1997 1997 Map Party Seats Seats Votes % % Labour 56 1,283,350 45.6 Liberal Democrats 10 365,362 13.0 SNP 6 621,550 22.1 Conservative 0 493,059 17.5 Other 0 53,427 2.0 Turnout: 2,816,748 71.3
1992 1992 Map Party Seats Seats Votes % % Labour 49 1,142,911 39.0 Conservative 11 751,950 25.6 Liberal Democrats 9 383,856 13.1 SNP 3 629,564 21.5 Other 0 23,417 0.8 Turnout: 2,931,698 75.5
1987 1987 Map Party Seats Seats Votes % % Labour 50 1,258,132 42.4 Conservative 10 713,081 24.0 Alliance 9 570,053 19.2 SNP 3 416,473 14.1 Other 0 10,069 0.3 Turnout: 2,967,808 75.1
1983 1983 Map Party Seats Seats Votes % % Labour 41 990,654 35.1 Conservative 21 801,487 28.4 Alliance 8 [ 6] 692,634 24.5 SNP 2 331,975 11.8 Other 0 7,830 0.3 Turnout: 2,824,580 72.7
1979 1979 Map Party Seats Seats Votes % % Labour 44 1,211,455 41.5 Conservative 22 916,155 31.4 SNP 2 504,259 17.3 Liberal 3 262,224 9.0 SLP 0 13,737 0.5 New Other 0 2,881 0.1 Turnout: 2,916,637 76.84
October 1974 October 1974 Map February 1974 February 1974 Map Party Seats Seats Votes % % Labour 40 1,057,601 36.6 Conservative 21 950,668 32.9 SNP 7 633,180 21.9 Liberal 3 229,162 7.9 Communist 0 15,071 0.5 Other 0 1,393 0.1 Turnout: 2,887,075 78.86
1970 1970 Map Party Seats Seats Votes % % Labour 44 1,197,068 44.5 Conservative 23 1,020,674 38.0 SNP 1 306,802 11.4 Liberal 3 147,667 5.5 Communist 0 11,408 0.4 Other 0 4,616 0.2 Turnout: 2,688,235 73.91
1966 1966 Map Party Seats Seats Votes % % Labour 46 1,273,916 49.9 Conservative 20 960,675 37.6 Liberal 5 172,447 6.8 SNP 0 128,474 5.0 Communist 0 16,230 0.6 Other 0 638 0.0 Turnout: 2,552,380
1964 1964 Map Party Seats Seats change Votes % % Change Labour Party 43 1,283,667 48.7 Unionist 24 981,641 37.3 National Liberal & Conservative 0 88,054 3.3 Liberal 4 200,063 7.6 SNP 0 64,044 2.4 Communist 0 12,241 0.5 Other 0 4,829 0.2 Total 71 2,634,539 100
1959 1959 Map Party Seats Seats change Votes % % Change Labour Party 38 1,245,255 46.7 Unionist 25 1,060,609 39.8 National Liberal & Conservative 6 199,678 7.5 Liberal 1 108,963 4.1 Independent Unionist 1 12,163 0.5 New SNP 0 21,738 0.8 Communist 0 12,150 0.5 New Fife Socialist League 0 4,886 0.2 New Other 0 2,071 0.1 Total 71 2,667,513 100
1955 1955 Map Party Seats Seats change Votes % % Change Unionist 30 1,056,209 41.5 National Liberal & Conservative 6 217,733 8.6 Labour Party 34 1,188,058 46.7 Liberal 1 47,273 1.9 Communist 0 13,195 0.5 SNP 0 12,112 0.5 Other 0 8,674 0.3 Total 71 2,543,254 100
1951 1951 Map Party Seats Seats change Votes % % Change Unionist 29 1,108,321 39.9 National Liberal & Conservative 6 240,977 8.7 Labour Party 35 1,330,244 47.9 Liberal 1 76,291 2.7 Communist 0 10,947 0.4 SNP 0 7,299 0.3 Other 0 3,758 0.1 Total 71 2,777,837 100
1950 1950 Map Party Seats Seats change Votes % % Change Labour Party 37 1,259,410 46.2 Unionist 26 1,013,909 37.2 National Liberal & Conservative 5 208,101 7.6 Liberal 2 180,270 6.6 SNP 0 9,708 0.4 Communist 0 27,559 1.0 Other 1 27,727 1.0 Total 71 2,726,684 100
1945 1945 Map Party Seats Seats change Votes % % Change Labour Party 37 1,144,310 47.9 Unionist 24 878,206 36.7 National Liberal & Conservative 3 85,937 3.6 Independent Labour Party 3 40,725 1.7 Independent Liberal 2 26,127 1.1 Communist 1 - 33,265 1.4 Independent Unionist 1 13,647 0.6 Liberal 0 132,849 5.6 SNP 0 - 30,595 1.3 Common Wealth Party 0 - 4,231 0.2 Total 71 2,389,892 100
1935 1935 Map Party Seats Seats change Votes % % Change National Government (Total) 43 1,135,403 49.8 Unionist 35 962,595 42.0 National Liberal 7 149,072 6.7 National Labour 1 0 19,115 0.9 National 0 4,621 0.2 Labour Party 20 863,789 36.8 Liberal 3 174,235 6.7 Independent Labour Party 4 111,256 5.0 SNP 0 25,652 1.1 Communist 1 13,462 0.6 Total 71 2,323,797 100
1931 1931 Map Party Seats Seats change Votes % % Change National Government (Total) 64 1,385,385 64.0 Unionist 48 1,056,768 49.5 National Liberal & Conservative 8 New 101,430 4.9 New Liberal 7 205,384 8.6 National Labour 1 New 21,803 1.0 New Labour Party 7 696,248 32.6 Communist 0 35,618 1.4 National Party of Scotland 0 20,954 1.0 New Party 0 New 3,895 0.2 New Other 0 32,229 0.8 Total 71 2,174,329 100
1929 1929 Map 1924 1924 Map Party Seats Seats change Votes % % Change Unionist 36 688,299 40.7 Labour 26 697,146 41.1 Liberal 8 286,540 16.6 Communist 0 - 15,930 0.7 Other 1 - 29,193 0.9 Total 71 1,717,108 100
1923 1923 Map Party Seats Seats change Votes % % Change Labour 34 532,450 35.9 Liberal (Reunited) 22 422,995 28.4 Unionist 14 468,526 31.6 Communist 0 39,448 2.4 Other 1 - 37,908 1.7 Total 71 1,501,327 100
1922 1922 Map 1918 1918 Map Party Seats Seats change Votes % % Change Coalition (Total) 54 584,259 52.3 Coalition Unionist 28 336,530 30.8 Coalition Liberal 25 221,145 19.1 Coalition Labour 1 14,247 1.3 Coalition NDP 0 12,337 1.1 Labour 6 265,744 22.9 +19.3 Liberal 8 163,960 15.0 -36.6 Unionist 2 21,939 2.0 Co-operative Party 0 19,841 1.8 Highland Land League 0 8,710 0.8 Scottish Prohibition Party 0 5,212 0.5 NDP 0 4,297 0.4 Other 1 52,749 4.7 Total 71 1,126,711 100
1910 December December 1910 Map 1910 January January 1910 Map 1906 1906 Map 1900 1900 Map 1895 1895 Map 1892 1892 Map 1886 1886 Map 1885 1885 Map 1880 1880 Map Party Seats Seats change Votes % % Change Liberal 52 195,517 70.1 Conservative 6 75,145 29.9 Total 58 269,662 100
1874 Party Seats Seats change Votes % % Change Liberal 40 148,345 70.1 Conservative 18 63,193 29.9 Total 58 211,538 100
1868 Party Seats Seats change Votes % % Change Liberal 51 125,356 82.5 Conservative 7 23,985 17.5 Total 58 149,341 100
1865 Party Seats Seats change Votes % % Change Liberal 42 43,480 85.4 Conservative 11 4,305 14.6 Total 53 47,785 100
1852 Party Seats Seats change Votes % % Change Whig 33 - 21,015 72.6 Conservative & Liberal Conservative 20 - 6,955 27.4 Total 53 27,970 100
1847 Party Seats Seats change Votes % % Change Whig 33 - 20,092 81.7 Conservative & Liberal Conservative 20 - 3,509 18.3 Total 53 23,601 100
1841 Party Seats Seats change Votes % % Change Whig 31 16,356 60.8 Conservative 22 9,793 38.3 Chartist 0 385 0.9 Total 53 26,354 100
1837 Party Seats Seats change Votes % % Change Whig 33 22,082 54.0 Conservative 20 18,569 46.0 Total 53 - 40,651 100
1835 Party Seats Seats change Votes % % Change Whig 38 28,307 62.8 Conservative 15 15,733 37.2 Total 53 44,040 100
1832 Party Seats Seats change Votes % % Change Whig 43 44,003 79.0 Tory 10 9,752 21.0 Total 53 53,755 100
1831 Party Seats Seats change Votes % % Change Tory 23 Whig 21 Doubtful 1 Total 45 100
1830 Party Seats Seats change Votes % % Change Tory 33 Whig 12 Total 45 100
Local councils Since 1995, local elections in Scotland have been generally held every four years for all the 32 unitary authorities created under the Local Government etc. (Scotland) Act 1994 . Between 1975 and 1992, elections were held every two years for either district or regional council, which sat for four-year terms. Those arrangements were set up by the Local Government (Scotland) Act 1973 .
As one consequence of the Gould Report , [ 7] which was a response to the fiasco of the 2007 elections, the next council elections were scheduled for 2012 (one year after the Parliamentary elections in 2011).
2012 The election was contested for the second time under the STV system of proportional representation. It was the first time in 13 years that the elections had not been held on the same day as the Scottish Parliament elections.
By-elections 2008 date to be announced : Abbey (4-member ward), Dumfries and Galloway , 1 member elected by single transferable vote : result pending (result May 2007: 2 Con, 1 SNP, 1 Lab)1 May: Troup (3-member ward), Aberdeenshire , 1 member elected by single transferable vote: result pending (result May 2007: 1 SNP, 1 Con, 1 Ind) 6 March: Cambuslang East (3-member ward), South Lanarkshire , 1 member elected by single transferable vote: Lab gain from SNP (result May 2007: 2 Lab, 1 SNP; after by election: 3 Lab) 28 Feb: Lerwick South (4-member ward), Shetland , 1 member elected by single transferable vote: Ind hold (result May 2007: 4 Ind; after by election: 4 Ind) 21 Feb: Highland (3-member ward), Perth and Kinross , 1 member elected by single transferable vote: SNP hold (result May 2007: 2 SNP, 1 Con; after by election: 2 SNP, 1 Con) 14 Feb: Elgin City South (3-member ward), Moray , 1 member elected by single transferable vote: SNP gain from Ind (result May 2007: 1 SNP, 1 Lab, 1 Ind; after by election: 2 SNP, 1 Lab) 31 January: Kilsyth (3-member ward), North Lanarkshire , 1 member elected by single transferable vote: Lab hold (result May 2007: 2 Lab, 1 SNP; after by election: 2 Lab, 1 SNP) 2007 22 November: Lochee (4-member ward), Dundee , 1 member elected by single transferable vote: SNP hold (result May 2007: 2 SNP, 2 Lab; after by election: 2 SNP, 2 Lab) 4 October: Helensburgh and Lomond South (3-member ward), Argyll and Bute , 1 member elected by single transferable vote: Lib Dem gain from Ind (result May 2007: 1 Con, 1 Ind, 1 Lib Dem; after by election: 2 Lib Dem, 1 Con) 16 August: Midstocket/Rosemount (3-member ward), Aberdeen , 1 member elected by single transferable vote: SNP gain from Con (result May 2007: 1 Con, 1 SNP, 1 Lab; after by election: 2 SNP, 1 Lab) 2006 8 December: Elderslie, Renfrewshire , Lab hold (16% swing Lab to SNP) 28 September: Markinch and Woodside East, Fife , SNP gain from Lab 10 August: Lochardil, Highland , Lib Dem gain from Ind 15 June: Dumbarton West, West Dunbartonshire , SNP gain from Lab 18 May: Altonhill Hillhead and Longpark, East Ayrshire , SNP hold 11 May: Biggar, Symington and Black Mount, South Lanarkshire , Con gain from SNP 30 March: Avondale South, South Lanarkshire , Con hold 30 March: Borestone, Stirling , SNP gain from Lab 30 March: King's Park, Glasgow , Lib Dem gain from Lab 16 February: Milton, Glasgow , SNP gain from Lab 2 February: North Carrick and Maybole East, South Ayrshire , Ind gain from Lab 2005 8 December: Kirkshaws, North Lanarkshire , Lab hold 10 November: Knightswood Park, Glasgow , Lab hold 10 November: Loanhead, Midlothian , SNP gain from Ind 10 November: Murrayfield, Edinburgh , Con hold 13 October: Lochside, Dumfries and Galloway , Lab gain from Ind 29 September: Auchtertool and Burntisland East , Fife , SNP gain from Ind 11 August: Herbertshire, Falkirk , SNP gain from Lab 16 June: Kildrum and Park, North Lanarkshire , SNP gain from Ind 9 June: Huntly East, Aberdeenshire , Con hold 9 June: Kilnknowe and Clovenfords, Borders , SNP gain from Ind 17 March: Dalkeith/Woodburn, Midlothian , Lib Dem gain from Lab 17 March: Dumbarton West, West Dunbartonshire , Lab hold European Parliament In 1999 , a Scotland-wide constituency replaced eight first-past-the-post constituencies used in the elections between 1979 and 1994. This returned eight MEPs under the d'Hondt method of party-list proportional representation system. Since then the number of MEPs returned by Scotland has been reduced twice, to seven in 2004, and then to six in 2009.
Following the United Kingdom's exit from the European Union on 31 January 2020, Scotland no longer elects representatives to the European Parliament.
Elected candidates are shown in bold . Brackets indicate the number of votes per seat won.
2019 European Election 2019 : Scotland [ 8] [ 9] [ 10] [ 11] List Candidates Votes Of total (%) SNP Alyn Smith , Christian Allard , Aileen McLeod Margaret Ferrier , Heather Anderson, Alex Kerr [ 12] 594,553 (198,184.3) 37.8% +8.8 Brexit Party Louis Stedman-Bryce Karina Walker, James Ferguson-Hannah, Stuart Waiton , Paul Aitken, Calum Walker 233,006 14.8% New Liberal Democrats Sheila Ritchie Fred Mackintosh, Catriona Bhatia, Vita Zaporozcenko, John Edward , Clive Sneddon [ 13] 218,285 13.8% +6.8 Conservative Nosheena Mobarik Ian McGill, Shona Haslam, Iain Whyte, Andrea Gee, Michael Kusznir [ 14] 182,476 11.6% −5.6 Labour David Martin , Jayne Baxter , Craig Miller, Amy Lee Fraioli, Callum O’Dwyer, Angela Bretherton [ 15] 146,724 9.3% −16.6 Green Maggie Chapman , Lorna Slater , Gillian Mackay , Chas Booth, Mags Hall, Allan Faulds 129,603 8.2% +0.1 Change UK – The Independent Group David Macdonald,1 Kate Forman, Peter Griffiths, Heather Astbury, Colin McFadyen, Cathy Edgeworth 30,004 1.9% New UKIP Donald MacKay, Janice MacKay, Otto Inglis, Mark Meechan , Roy Hill [ 16] 28,418 1.8% −8.7 Independent Gordon Edgar [ 17] 6,128 0.4% N/A Independent Ken Parke [ 17] 2,049 0.1% N/A Turnout 1,561,226 39.9% + 6.4
2014 European Parliament election 2014 : Scotland [ 18] [ 19] [ 20] [ 21] List Candidates Votes Of total (%) SNP Ian Hudghton , Alyn Smith , Tasmina Ahmed-Sheikh , Stephen Gethins , Toni Giugliano, Chris Stephens 389,503(194,751.5) 29.0 –0.1 Labour David Martin , Catherine Stihler , Derek Munn, Katrina Murray, Asim Khan, Kirsty O'Brien 348,219(174,109.5) 25.9 +5.1 Conservative Ian Duncan , Belinda Don, Nosheena Mobarik, Jamie Gardiner, 231,330 16.8 +0.4 UKIP David Coburn , Kevin Newton, Otto Inglis, Denise Baykal, Hugh Hatrick, Malcolm Mackay 140,534 10.5 +5.3 Green Maggie Chapman, Chas Booth, Grace Murray, Alastair Whitelaw, Anne Thomas, Steen Parish 108,305 8.1 +0.8 Liberal Democrats George Lyon, Christine Jardine, Richard Brodie, Jade Holden, Mathers, Euan Davidson 95,319 7.1 –4.4 Britain First James Dowson, John Arthur Randall, Jayda Fransen, Geoffrey Clynch, Margaret Clynch, Jane Shepherd 13,551 2.0 [new] BNP Kenneth McDonald, David Orr, Victoria McKenzie, Angus Matthys, Paul Stafford, Stacey Fleming 10,150 0.8 –1.7 NO2EU John Foster. Andrew Elliott, Murdo Maclean, Gail Morrow, Brian Smith, Richard Veitch 6,388 0.5 –0.4 Turnout 1,343,299 33.5% +5.0%
2009 European Parliament election 2009 : Scotland [ 22] [ 23] List Candidates Votes Of total (%) SNP Ian Hudghton , Alyn Smith Aileen McLeod , Drew Hendry , Duncan Ross, Gordon Archer 321,007 (160,503.5) 29.1 +9.4 Labour David Martin , Catherine Stihler Mary Lockhart, Paul McAleavely, Kirsty Connell, Nasim Khan [ 24] 229,853 (114,926.5) 20.8 −5.6 Conservative Struan Stevenson Belinda Don, Helen Gardiner, Donald G. MacDonald, Gerald Michaluk, PJ Lewis [ 25] 185,794 16.8 −0.9 Liberal Democrats George Lyon Euan Robson , Robert Aldridge, Patsy Kenton, Douglas Herbison, Clive Sneddon [ 26] 127,038 11.5 −1.6 Green Elaine Morrison, Chas Booth, Kirsten Robb, Alastair Whitelaw, Ruth Dawkins, Peter McColl 80,442 7.3 +0.5 UKIP Peter Adams, Paul Hencke, Phillip Anderson, Matthew Desmond, Donald Mackay, Paul Wiffen, Kathleen Desmond [ 27] 57,788 5.2 −1.5 BNP Gary Raikes , Charlie Baillie, Deborah McKnight, Roy Jones, Max Dunbar, Elise Jones [ 28] 27,174 2.5 +0.8 Socialist Labour Louise McDaid, David Jacobsen, Katherine McGavigan, James Berrington, Claire Watt, James McDaid 22,135 2.0 +2.0 Scottish Christian Sheila McLaughlan, John Smart, Brian Ross, Archie Linnegan, Christine Cormack, Isobel Anne Macleod 16,738 1.5 +1.5 Scottish Socialist Colin Fox , Angela Gorrie, Johanna Dind, Nick McKerrell, Raphie de Santos, Felicity Garvie 10,404 0.9 −4.3 Independent Duncan Robertson 10,189 0.9 +0.9 NO2EU John Foster, Tommy Sheridan , Leah Ganley, Stuart Hyslop, Ajit Singh Uppal, Tom Morrison 9,693 0.9 +0.9 Jury Team Alan Wallace, John O'Callaghan, Stuart Brown, Kenneth Lees, Mev Brown, Austin Compson-Bradford [ 29] 6,257 0.6 +0.6 Turnout 1,104,512 28.5 − 2.4
2004 European Parliament election 2004 : Scotland [ 30] List Candidates Votes Of total (%) Labour David Martin , Catherine Stihler Bill Miller , Kirsty O'Brien, Colin Smyth, Catriona Renton, Gemma Doyle 310,865 (155,432.5) 26.4 −2.3 SNP Ian Hudghton , Alyn Smith Kenneth Gibson , Douglas Henderson , Alexander Nicholson, Alex Orr, Janet Law, Duncan Ross 231,505 (115,752.5) 19.7 −7.5 Conservative Struan Stevenson , John Purvis Cameron Buchanan, Sebastian Leslie, Anne Harper, Paul Nelson, Douglas Taylor 209,028 (104,514) 17.8 −2.0 Liberal Democrats Elspeth Attwooll Robert Aldridge, Alex Bruce, Karen Freel, Douglas Herbison, Clive Sneddon, Christine James, Jermaine Allison 154,178 13.1 +3.3 Green Chas Booth, Tara O'Leary, Martin Bartos, Moira Dunworth, Alastair Whitelaw, Katherine Joester, James Park 79,695 6.8 +1.0 UKIP Peter Troy, Philip Anderson, George Cormack, Michael Phillips, Janice Murdock, Donald Mackay, Peter Nielson 78,828 6.7 +5.4 Scottish Socialist Felicity Garvie, Nick McKerrel, Hugh Kerr , Catriona Grant , Lynn Sheridan, John Sangster, Andrew Rossiter 61,356 5.2 +1.2 Christian Vote George Hargreaves , William Thompson, Richard Russell, David Braid, Marion McNeill, Mary Hay, Rose Irtwange 21,056 1.8 N/A BNP Steven Blake, Scott McLean, David Kerr, Stephen Burns, Bryan Dickson, Craig McComb, John Bean [ 31] 19,427 1.7 +1.3 Scottish Wind Watch Brendan Hamill, Sylvia Thorne, Charles Bennie, Jennifer Scobie, Bennie Palmer, Helen Pass, Richard Hammock 7,255 0.6 N/A Independent Fergus Tait 3,624 0.3 N/A Turnout 1,176,817 30.9 +6.2
1999 European Parliament election 1999 : Scotland [ 32] List Candidates Votes Of total (%) Labour David Martin , Bill Miller , Catherine Taylor Christine May, Hugh McMahon , James Paton, John Clifford, Jeanette Bradley 283,490 (94,496.67) 28.7 N/A SNP Ian Hudghton , Neil MacCormick Anne Gillies , Gordon Wilson , Janet Law, Kris Browne, Ian Goldie, Josephine Docherty 268,528 (134,264) 27.2 N/A Conservative Struan Stevenson , John Purvis Anne Harper, Cameron Buchanan, Sebastian Leslie, Iain Mitchell, Peter Ramsay, Anthony Gilbey 195,296 (97,648) 19.8 N/A Liberal Democrats Elspeth Attwooll Robert Aldridge, Neil Mitchison, Heather Lyall, Clive Sneddon, Danus Skene , Karen Freel, Jayne Struthers 96,971 9.8 N/A Green Marion Coyne, Eleanor Scott , Phil O'Brien, Graeme Farmer, Linda Hendry, Chris Ballance , Kay Allan, Alastair Whitelaw 57,142 5.8 N/A Scottish Socialist Hugh Kerr , Rosie Kane , Harvey Duke, Catherine Stewart, Colin Fox , Shareen Blackall, Steve Arnott, Frances Curran 39,720 4.0 N/A Pro-Euro Conservative Paul Dwyer, Joanna Lavender, Douglas McConchie, Richard Ashurst, Neasa MacEarlean, Oliver Grant, Alexander Skinner, James Waters 17,781 1.8 N/A UKIP Alistair McConnachie, Donald Mackay, James McKenna, Stuart Brown, Matthew Henderson, Joseph Smith, Peter Nielson, John Mumford 12,459 1.3 N/A Socialist Labour Louise McDaid, Christopher Herriot, Katharine McGavigan, Stephen Mayes, Patricia Graham, Colin Turbett, Margaret Stead, James Galloway 9,385 1.0 N/A BNP Kenneth Smith, Scott McLean, [ 33] Russell Bradley, Mark Allen, Paul Wilkinson, Robert Currie, David Kerr, [ 34] James Mills 3,729 0.4 N/A Natural Law James McKissock, George Stidolph, Diana Kras, Kenneth Blair, David Pettigrew, Iain Petrie, Anna Rawlinson, Thomas Pringle 2,087 0.2 N/A Accountant for Lower Scottish Taxes Charles Lawson 1,632 0.2 N/A Turnout 988,310 24.7 N/A
Pre-1999 elections For full details of results please referee to related articles;
1994 Party Seats Seats Votes % % Labour 6 -1 635,955 42.51 +0.65 SNP 2 +1 487,239 32.57 +6.94 Conservative 0 216,669 14.48 –6.41 Liberal Democrats 0 107,811 7.21 +2.92 Green 0 23,304 1.56 –5.69 Scottish Militant Labour 0 – 12,113 0.81 – Natural Law 0 – 5,037 0.34 – Liberal 0 – 3,249 0.22 – Socialist (GB) 0 – 1,832 0.12 – UKIP 0 – 1,096 0.07 – Communist 0 689 0.05 –0.02 Independent 0 – 584 0.04 – International Communist 0 381 0.03 +0.02 Turnout: 1,495,959
1984 Party Seats Seats Votes % % Labour 5 +3 526,066 40.99 +8.00 Conservative 2 –3 332,771 25.72 –7.96 SNP 1 230,594 17.82 –1.56 Alliance 0 201,782 15.60 –1.65 Ecology 0 – 2,560 0.20 – Turnout: 1,293,773
1979 Party Seats Seats Votes % % Conservative 5 – 430,772 33.68 – Labour 2 – 421,968 32.99 – SNP 1 – 247,836 19.38 – Liberal 0 – 178,433 13.95 – Turnout: 1,279,009
Referendums To date eight referendums have been held in Scotland, covering a wide range of issues.
References ↑ "Scotland Election 2024 Results" . BBC News . Retrieved 9 July 2024 . ↑ "Results of the 2019 General Election in Scotland" . BBC. Retrieved 28 December 2019 . ↑ "Scottish Greens release list of 2019 general election candidates" . Holyrood . 14 November 2019. Retrieved 28 December 2019 . ↑ "Scotland Results" . BBC News. ↑ "Scotland Results" . BBC News. ↑ Compared to the Liberals in 1979 ↑ "Probe says May poll failed voters" . BBC News. 23 October 2007. Retrieved 1 May 2010 . ↑ "Who are the MEP candidates in Scotland?" . BBC. 25 April 2019. ↑ European elections: List of candidates for Scotland [ permanent dead link ] ↑ The UK’s European elections 2019 | Gains for The Brexit Party and Lib Dems BBC News ↑ EU Elections 2019 – The Results Ballot Box Scotland; N.B.: This also gives the number of votes for each party in each council area. ↑ "SNP reveal list for Euro elections as party go for three MEPs" . The National . 20 April 2019. ↑ "Scottish Lib Dems unveil Euro election candidates" . BBC News. Retrieved 19 April 2019 . ↑ "The list of Conservative MEP candidates for Scotland" . Conservative Home. ↑ "Scotland's main parties reveal candidates for European Parliament elections" . The Scotsman . 19 April 2019. ↑ "EU candidates" . UK Independence Party. Archived from the original on 5 August 2020. Retrieved 22 September 2019 . 1 2 "Who are the MEP candidates in Scotland?" . BBC News. 25 April 2019. Retrieved 26 April 2019 . ↑ The Scotsman , 25/26 May 2014 https://www.scotsman.com/news/politics/scottish-european-election-2014-results-1-3422454 N.B.: This also gives the number of votes for each party in each council area. ↑ European Parliament Information Office in Edinburgh, Newsletter Issue 2, October 2014 http://www.europarl.europa.eu/unitedkingdom/resource/static/files/epio-in-edinburgh---october-newsletter.pdf ↑ "Vote 2014: European election candidates for Scotland" . BBC News. 28 April 2014. ↑ Scotl, Ballot Box (28 May 2019). "EU Elections 2019 – The Results" . Ballot Box Scotland . ↑ "City of Edinburgh Council" (PDF) . [ permanent dead link ] ↑ "European Election 2009 | UK Results | Scotland" . BBC News. ↑ "Labour's 2009 EP candidates" . Jon Worth Euroblog . 4 April 2008. ↑ "Conservative Party website, accessed 17 July 2008" . Archived from the original on 25 February 2006. Retrieved 2 October 2010 . ↑ "CIX ONLINE, accessed 17 July 2008" . Archived from the original on 8 May 2009. ↑ "UK Independence Party" . Archived from the original on 8 December 2008. Retrieved 28 August 2008 . ↑ British National Party Scotland accessed 6 March 2009 ↑ "Scotland » Candidates » Politics Without Parties » JURY TEAM" . Archived from the original on 19 April 2010. Retrieved 2 October 2010 . ↑ "2004 Election candidates" . UK Office of the European Parliament . Archived from the original on 4 October 2009. Retrieved 4 June 2009 . ↑ "Scotcand" . Archived from the original on 3 June 2004. ↑ "1999 Election candidates" . UK Office of the European Parliament . Archived from the original on 28 August 2009. Retrieved 4 June 2009 . ↑ "BBC News | Programmes | Under the skin of the BNP" . BBC News. ↑ "BBC News | Programmes | Under the skin of the BNP" . BBC News. ↑ Black, Andrew (21 March 2013). "Scottish independence: Referendum to be held on 18 September, 2014" . BBC News. Retrieved 8 October 2016 . ↑ Carrell, Severin (21 March 2013). "Alex Salmond announces Scottish independence referendum date" . The Guardian . ISSN 0261-3077 . Retrieved 8 October 2016 . ↑ "Scotland decides on 18 September 2014" . 21 March 2013. Archived from the original on 24 September 2015. Retrieved 12 March 2015 . External links
Elections in Europe
Sovereign states States with limited Dependencies and Other entities
This page is based on this
Wikipedia article Text is available under the
CC BY-SA 4.0 license; additional terms may apply.
Images, videos and audio are available under their respective licenses.