Results maps
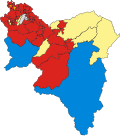 2003 results map
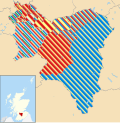 2007 results map
 2012 results map
South Lanarkshire Council in Scotland holds elections every five years, previously holding them every four years from its creation as a single-tier authority in 1995 to 2007.
| Year | SNP | Labour | Conservative | Liberal Democrats | Green | Independent |
|---|---|---|---|---|---|---|
| 1995 | 8 | 61 [a] | 2 | 2 | 0 | 0 |
| 1999 [b] | 10 | 54 | 2 | 1 | 0 | 0 |
| 2003 | 9 | 51 | 2 | 2 | 0 | 3 |
| 2007 [c] | 24 | 30 | 8 | 2 | 0 | 3 |
| 2012 | 28 | 33 | 3 | 1 | 0 | 2 |
| 2017 [d] | 27 | 22 | 14 | 1 | 0 | 0 |
| 2022 | 27 | 24 | 7 | 3 | 1 | 2 |


| Party | Candidate | Votes | % | ±% | |
|---|---|---|---|---|---|
| Conservative | Henry Mitchell [5] | 594 | 48.4 | +13.2 | |
| Labour | 377 | 30.7 | −18.1 | ||
| Liberal Democrats | 143 | 11.7 | +11.7 | ||
| SNP | 67 | 5.5 | −10.8 | ||
| Scottish Senior Citizens | 26 | 2.1 | +2.1 | ||
| Scottish Socialist | 20 | 1.6 | +1.6 | ||
| Majority | 217 | 17.7 | |||
| Turnout | 1,227 | ||||
| Conservative gain from Labour | Swing | ||||
| Party | Candidate | Votes | % | ±% | |
|---|---|---|---|---|---|
| Conservative | Stanley Hogarth | 775 | 50.9 | +9.2 | |
| Labour | Peter Duff | 315 | 20.6 | −6.9 | |
| SNP | William Holman | 221 | 14.5 | −7.3 | |
| Independent | Stuart Brown | 79 | 5.1 | +5.1 | |
| Green | Kirsten Robb | 71 | 4.6 | +4.6 | |
| Liberal Democrats | Bernard Hughes | 59 | 3.8 | −5.2 | |
| Majority | 460 | 30.3 | |||
| Turnout | 1,520 | ||||
| Conservative hold | Swing | ||||
| Party | Candidate | Votes | % | ±% | |
|---|---|---|---|---|---|
| Conservative | Hamish Stewart | 816 | 47.2 | +20.3 | |
| SNP | Tom Mitchell | 523 | 30.3 | −34.3 | |
| Independent | Peter Rae | 295 | 17.0 | +17.0 | |
| Labour | Ralph Barker | 87 | 5.0 | 3.6 | |
| Majority | 293 | 17.0 | |||
| Turnout | 1,721 | ||||
| Conservative gain from SNP | Swing | ||||
| Party | Candidate | FPv% | Count | ||||||||
|---|---|---|---|---|---|---|---|---|---|---|---|
| 1 | 2 | 3 | 4 | 5 | 6 | 7 | 8 | ||||
| Labour | Richard Tullett | 28.0 | 725 | 729 | 739 | 742 | 747 | 922 | 1,094 | 1,475 | |
| SNP | Christine Deanie | 23.5 | 609 | 614 | 621 | 625 | 638 | 728 | 962 | ||
| Liberal Democrats | Tunweer Malik | 22.4 | 580 | 584 | 589 | 593 | 616 | 669 | |||
| Independent | John McGuinness | 19.6 | 509 | 510 | 517 | 521 | 538 | ||||
| Conservative | Malcolm Macaskill | 3.1 | 80 | 82 | 82 | 94 | |||||
| Scottish Unionist | Jimi Moore | 1.5 | 38 | 39 | 40 | ||||||
| Scottish Socialist | David McClemont | 1.2 | 32 | 35 | |||||||
| Green | Susan Martin | 0.8 | 21 | ||||||||
| Labour gain from SNP | |||||||||||
| Valid: 2,044 Spoilt: 38 Quota: 1,298 Turnout: 2,082 | |||||||||||
| Party | Candidate | FPv% | Count | ||||||
|---|---|---|---|---|---|---|---|---|---|
| 1 | 2 | 3 | 4 | 5 | 6 | ||||
| Labour | Alan Scott | 41.4 | 847 | 863 | 873 | 892 | 973 | 1,297 | |
| SNP | Pat McGuire | 27.9 | 571 | 587 | 606 | 641 | 761 | ||
| Conservative | Ian Harrow | 19.7 | 403 | 427 | 442 | 455 | |||
| Green | Raymond Burke | 4.0 | 82 | 85 | 100 | ||||
| East Kilbride Alliance | Brian Jones | 3.5 | 71 | 76 | |||||
| Liberal Democrats | Gordon Smith | 3.4 | 70 | ||||||
| Labour hold | |||||||||
| Valid: 2,044 Quota: 1,023 | |||||||||
| Party | Candidate | FPv% | Count | |
|---|---|---|---|---|
| 1 | ||||
| SNP | John Menzies | 50.0 | 822 | |
| Labour | Stuart Gallacher | 36.9 | 607 | |
| Conservative | Connar McBain | 13.0 | 214 | |
| SNP gain from Independent | ||||
| Valid: 1,643 Spoilt: 16 Quota: 822 Turnout: 1,659 | ||||
| Party | Candidate | FPv% | Count | |||||||
|---|---|---|---|---|---|---|---|---|---|---|
| 1 | 2 | 3 | 4 | 5 | 6 | 7 | ||||
| Labour | Gerard Killen | 39.9 | 1,352 | 1,358 | 1,370 | 1,376 | 1,396 | 1,616 | 2,090 | |
| Liberal Democrats | David Baillie | 29.5 | 999 | 1,004 | 1,016 | 1,035 | 1,104 | 1,278 | ||
| SNP | Margaret Ferrier | 21.0 | 712 | 714 | 730 | 741 | 755 | |||
| Conservative | Aric Gilinisky | 3.8 | 128 | 133 | 134 | 170 | ||||
| UKIP | Donald Murdo MacKay | 3.3 | 111 | 115 | 120 | |||||
| Green | Susan Martin | 1.7 | 59 | 60 | ||||||
| Independent | Craig Smith | 0.9 | 31 | |||||||
| Labour gain from SNP | ||||||||||
| Valid: 3,392 Spoilt: 46 Quota: 1,697 Turnout: 3,438 | ||||||||||
| Party | Candidate | FPv% | Count | |
|---|---|---|---|---|
| 1 | ||||
| Labour | Stuart Gallacher | 51.7 | 1,781 | |
| SNP | Josh Wilson | 32.5 | 1,120 | |
| Conservative | Lynne Nailon | 9.4 | 322 | |
| Scottish Christian | Craig Martin | 3.9 | 133 | |
| UKIP | Josh Richardson | 2.5 | 86 | |
| Labour gain from SNP | ||||
| Valid: 3,442 Spoilt: 43 Quota: 1,722 Turnout: 3,485 | ||||
| Party | Candidate | FPv% | Count | |||||
|---|---|---|---|---|---|---|---|---|
| 1 | 2 | 3 | 4 | 5 | ||||
| Labour | Gordon Muir | 40.8 | 1,492 | 1,512 | 1,559 | 1,819 | 2,366 | |
| SNP | George Sneddon | 32.0 | 1,170 | 1,203 | 1,260 | 1,356 | ||
| Conservative | Donna Hood | 18.0 | 659 | 674 | 744 | |||
| UKIP | Donald MacKay | 6.4 | 233 | 247 | ||||
| Green | Ruth Thomas | 2.8 | 104 | |||||
| Labour gain from SNP | ||||||||
| Valid: 3,658 Spoilt: 52 Quota: 1,830 Turnout: 3,710 | ||||||||
| Party | Candidate | FPv% | Count | ||||||
|---|---|---|---|---|---|---|---|---|---|
| 1 | 2 | 3 | 4 | 5 | 6 | ||||
| SNP | John Ross | 48.0 | 1,881 | 1,883 | 1,888 | 1,905 | 1919 | 1,988 | |
| Labour | Jim Lee | 35.6 | 1,396 | 1,398 | 1,405 | 1,410 | 1,425 | 1,460 | |
| Conservative | Lynne Nailon | 8.9 | 349 | 349 | 354 | 365 | 389 | 394 | |
| Green | John Kane | 3.2 | 127 | 128 | 132 | 135 | 146 | ||
| Scottish Christian | Craig Smith | 2.0 | 77 | 80 | 81 | 84 | |||
| UKIP | Donald Murdo MacKay | 1.1 | 43 | 44 | 45 | ||||
| Liberal Democrats | Matthew Cockburn | 0.8 | 32 | 34 | |||||
| Pirate | Andrew McCallum | 0.3 | 13 | ||||||
| SNP hold | |||||||||
| Valid: 3,918 Spoilt: 52 Quota: 1,960 Turnout: 3,970 | |||||||||
| Party | Candidate | FPv% | Count | |||||
|---|---|---|---|---|---|---|---|---|
| 1 | 2 | 3 | 4 | 5 | ||||
| Labour | Mo Razzaq | 47.2 | 1,476 | 1,483 | 1,504 | 1,536 | 1,589 | |
| SNP | Gerry Chambers | 39.6 | 1,236 | 1,246 | 1,259 | 1,314 | 1,327 | |
| Conservative | Taylor Muir | 4.5 | 140 | 156 | 172 | 173 | ||
| Scottish Socialist | Sean Baillie | 3.9 | 122 | 125 | 133 | |||
| Liberal Democrats | Stephen Reid | 2.9 | 92 | 97 | ||||
| UKIP | Emma Jay Docherty | 1.9 | 59 | |||||
| Labour hold | ||||||||
| Valid: 3,125 Spoilt: 45 Quota: 1,563 Turnout: 3,170 | ||||||||
| Party | Candidate | FPv% | Count | |||||
|---|---|---|---|---|---|---|---|---|
| 1 | 2 | 3 | 4 | 5 | ||||
| SNP | Stephanie Callaghan | 42.9 | 1,089 | 1,096 | 1,138 | 1,206 | 1,569 | |
| Labour | Lyndsay Clelland | 33.6 | 855 | 861 | 878 | 1,052 | ||
| Conservative | James MacKay | 18.5 | 469 | 480 | 485 | |||
| Green | Steven Hannigan | 3.3 | 83 | 90 | ||||
| Liberal Democrats | Norman Rae | 1.8 | 45 | |||||
| SNP hold | ||||||||
| Valid: 2,541 Spoilt: 31 Quota: 1,271 Turnout: 2,572 | ||||||||
| Party | Candidate | FPv% | Count | |||||
|---|---|---|---|---|---|---|---|---|
| 1 | 2 | 3 | 4 | 5 | ||||
| Labour | Martin Lennon | 38.5 | 1,173 | 1,176 | 1,203 | 1,270 | 1,541 | |
| SNP | David Innes | 27.4 | 836 | 838 | 870 | 884 | 989 | |
| Liberal Democrats | Ellen Bryson | 18.2 | 554 | 558 | 574 | 711 | ||
| Conservative | Taylor Muir | 12.1 | 368 | 377 | 379 | |||
| Green | Brian Finlay | 2.9 | 88 | 93 | ||||
| UKIP | Janice MacKay | 0.9 | 28 | |||||
| Labour hold | ||||||||
| Valid: 3,047 Spoilt: 47 Quota: 1,524 Turnout: 3,094 | ||||||||
| Party | Candidate | FPv% | Count | |||||
|---|---|---|---|---|---|---|---|---|
| 1 | 2 | 3 | 4 | 5 | ||||
| SNP | Grant Ferguson | 46.5 | 1,582 | 1,582 | 1,588 | 1,650 | 1,743 | |
| Labour | Kirsty Williams | 20.3 | 690 | 692 | 695 | 715 | 837 | |
| Conservative | Graham Fisher | 14.6 | 498 | 499 | 513 | 519 | 606 | |
| Liberal Democrats | Paul McGarry | 12.4 | 422 | 424 | 428 | 456 | ||
| Green | Antony Lee | 4.5 | 153 | 154 | 159 | |||
| UKIP | David MacKay | 1.4 | 48 | 50 | ||||
| Scottish Libertarian | Stephen McNamara | 0.4 | 12 | |||||
| SNP hold | ||||||||
| Valid: 3,405 Spoilt: 51 Quota: 1,703 Turnout: 3,456 | ||||||||
| Party | Candidate | FPv% | Count | ||||||
|---|---|---|---|---|---|---|---|---|---|
| 1 | 2 | 3 | 4 | 5 | 6 | ||||
| Labour | Kirsty Williams | 40.5 | 1,386 | 1,392 | 1,434 | 1,469 | 1,500 | 1,845 | |
| Conservative | Bill Dorrian | 26.4 | 904 | 914 | 919 | 933 | 937 | 965 | |
| SNP | Robert Gillies | 22.7 | 778 | 778 | 785 | 806 | 899 | ||
| Green | Cameron Eadie | 3.8 | 131 | 131 | 139 | 155 | |||
| Independent | Kristofer Keane | 2.9 | 99 | 112 | 123 | ||||
| Liberal Democrats | Jake Stevenson | 2.4 | 83 | 85 | |||||
| Scottish Family | Jonathan Jack Richardson | 1.2 | 42 | ||||||
| Labour gain from SNP | |||||||||
| Valid: 3,450 Spoilt: 27 Quota: 1,712 Turnout: 3,477 | |||||||||