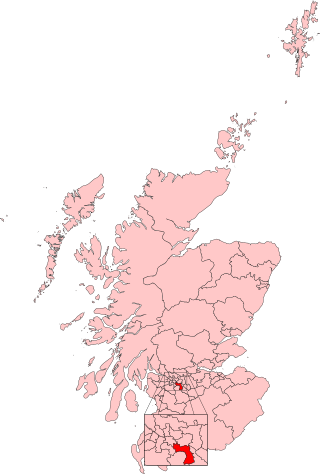
Rutherglen and Hamilton West was a burgh constituency of the House of Commons of the Parliament of the United Kingdom, which was created for the 2005 general election. It covered almost all of the former constituency of Glasgow Rutherglen and most of the former constituency of Hamilton South, and it elected one member of parliament (MP) by the first-past-the-post voting system.
South Lanarkshire Council is the unitary authority serving the South Lanarkshire council area in Scotland. The council has its headquarters in Hamilton, has 16,000 employees, and an annual budget of almost £1bn. The large and varied geographical territory takes in rural and upland areas, market towns such as Lanark, Strathaven and Carluke, the urban burghs of Rutherglen, Cambuslang, and East Kilbride which was Scotland's first new town. The area was formed in 1996 from the areas of Clydesdale, Hamilton and East Kilbride districts, and some outer areas of Glasgow district ; all were previously within the Strathclyde region from 1975 but in historic Lanarkshire prior to that.

Elections to South Lanarkshire Council took place on 3 May 2012 on the same day as the 31 other Scottish local government elections. As with other Scottish council elections, it was held using single transferable vote (STV) – a form of proportional representation – in which multiple candidates are elected in each ward and voters rank candidates in order of preference.
Elections to South Lanarkshire Council took place on 4 May 2017 on the same day as the 31 other Scottish local government elections. As with other Scottish council elections, it was held using single transferable vote (STV) – a form of proportional representation – in which multiple candidates are elected in each ward and voters rank candidates in order of preference.
Clydesdale West is one of the 20 electoral wards of South Lanarkshire Council. Created in 2007, the ward elects four councillors using the single transferable vote electoral system and covers an area with a population of 19,350 people.

Clydesdale South is one of the 20 electoral wards of South Lanarkshire Council. Created in 2007, the ward elects three councillors using the single transferable vote electoral system and covers an area with a population of 14,621 people.
Avondale and Stonehouse is one of the 20 electoral wards of South Lanarkshire Council. Created in 2007, the ward initially elected four councillors using the single transferable vote electoral system before a boundary review in 2017 reduced the number of councillors to three. It covers an area with a population of 17,749 people.
East Kilbride South is one of the 20 electoral wards of South Lanarkshire Council. Created in 2007, the ward elects three councillors using the single transferable vote electoral system and covers an area with a population of 16,985 people.

East Kilbride Central South is one of the 20 electoral wards of South Lanarkshire Council. Created in 2007, the ward elects three councillors using the single transferable vote electoral system and covers an area with a population of 16,985 people.

East Kilbride Central North is one of the 20 electoral wards of South Lanarkshire Council. Created in 2007, the ward initially elected four councillors using the single transferable vote electoral system and covers an area with a population of 16,547 people. Following a boundary review, the ward has elected three councillors since 2017.

East Kilbride West is one of the 20 electoral wards of South Lanarkshire Council. Created in 2007, the ward elects three councillors using the single transferable vote electoral system and covers an area with a population of 13,737 people.
East Kilbride East is one of the 20 electoral wards of South Lanarkshire Council. Created in 2007, the ward elects three councillors using the single transferable vote electoral system and covers an area with a population of 15,275 people.
Rutherglen South is one of the 20 electoral wards of South Lanarkshire Council. Created in 2007, the ward elects three councillors using the single transferable vote electoral system and covers an area with a population of 15,322 people.

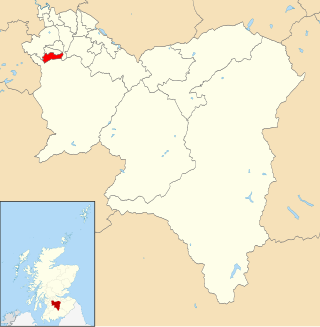
Cambuslang West is one of the 20 electoral wards of South Lanarkshire Council. Created in 2007, the ward elects three councillors using the single transferable vote electoral system and covers an area with a population of 14,096 people.

Cambuslang West is one of the 20 electoral wards of South Lanarkshire Council. Created in 2007, the ward elects three councillors using the single transferable vote electoral system and covers an area with a population of 17,418 people.

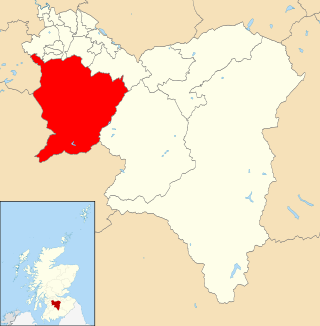
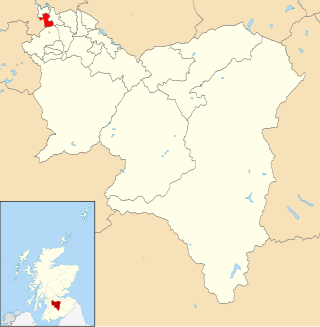
Blantyre is one of the 20 electoral wards of South Lanarkshire Council. Re-established in 2007, the ward initially elected four councillors using the single transferable vote electoral system before a boundary review in 2017 reduced the number of councillors to three. It covers an area with a population of 15,968 people.

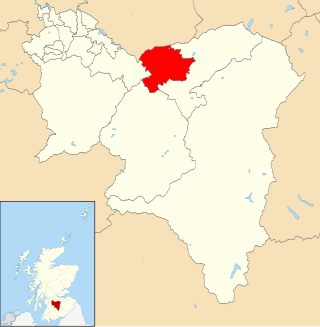
Hamilton North and East is one of the 20 electoral wards of South Lanarkshire Council. Created in 2007, the ward elects three councillors using the single transferable vote electoral system and covers an area with a population of 15,004 people.

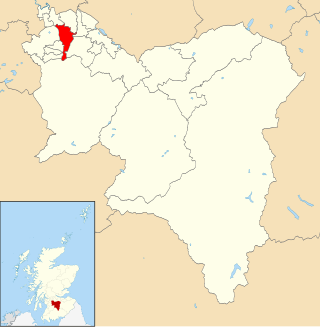
Hamilton West and Earnock is one of the 20 electoral wards of South Lanarkshire Council. Created in 2007, the ward elects four councillors using the single transferable vote electoral system and covers an area with a population of 18,503 people.

Hamilton South is one of the 20 electoral wards of South Lanarkshire Council. Created in 2007, the ward elects four councillors using the single transferable vote electoral system and covers an area with a population of 22,032 people.
Elections to South Lanarkshire Council took place on 5 May 2022 on the same day as the 31 other Scottish local government elections. As with other Scottish council elections, it was held using single transferable vote (STV) – a form of proportional representation – in which multiple candidates are elected in each ward and voters rank candidates in order of preference.
