This article needs additional citations for verification .(June 2019) |
| ||||||||||||||||||||||||||||||||||||||||||||||||||||||
All 41 seats to Perth and Kinross Council 21 seats needed for a majority | ||||||||||||||||||||||||||||||||||||||||||||||||||||||
---|---|---|---|---|---|---|---|---|---|---|---|---|---|---|---|---|---|---|---|---|---|---|---|---|---|---|---|---|---|---|---|---|---|---|---|---|---|---|---|---|---|---|---|---|---|---|---|---|---|---|---|---|---|---|
| ||||||||||||||||||||||||||||||||||||||||||||||||||||||
|
Elections to Perth and Kinross Council were held on 3 May 2007, the same day as the other Scottish local government elections and the Scottish Parliament general election. The election was the first one using 12 new wards created as a result of the Local Governance (Scotland) Act 2004, each ward will elect three or four councillors using the single transferable vote system form of proportional representation. The new wards replace 41 single-member wards which used the plurality (first past the post) system of election.
The Council continued to be controlled by a Liberal Democrat/Scottish National Party coalition administration.
Party | Seats | Gains | Losses | Net gain/loss | Seats % | Votes % | Votes | +/− | |
---|---|---|---|---|---|---|---|---|---|
SNP | 18 | N/A | N/A | +3 | 43.9 | 37.2 | 23,254 | ||
Conservative | 12 | N/A | N/A | +2 | 29.3 | 28.1 | 17,556 | ||
Liberal Democrats | 8 | N/A | N/A | -1 | 19.5 | 19.7 | 12,303 | ||
Labour | 3 | N/A | N/A | -2 | 7.3 | 8.5 | 5,311 | ||
Scottish Green | 0 | N/A | N/A | ±0 | 0.0 | 1.7 | 1,094 | ||
Independent | 0 | N/A | N/A | -2 | 0.0 | 4.8 | 3,020 | ||
Party | Candidate | FPv% | Count | |||||
---|---|---|---|---|---|---|---|---|
1 | 2 | 3 | 4 | 5 | ||||
Conservative | Mac Roberts | 28.6 | 1,192 | |||||
SNP | John Hulbert | 25.8 | 1,075 | |||||
SNP | Peter Mulheron | 20.7 | 862 | 882 | 905 | 975 | 1,353 | |
Liberal Democrats | Catherine Carruthers | 17.2 | 715 | 757 | 759 | 917 | ||
Independent | Richard Rattray | 7.8 | 323 | 355 | 356 | |||
Electorate: 6,775 Valid: 4,167 Spoilt: 80 Quota: 1,042 Turnout: 62.69% |
Party | Candidate | FPv% | Count | ||||||||
---|---|---|---|---|---|---|---|---|---|---|---|
1 | 2 | 3 | 4 | 5 | 6 | 7 | 8 | ||||
Conservative | Dennis Melloy | 24.9 | 1,764 | ||||||||
Liberal Democrats | Lewis Simpson | 19.6 | 1,390 | 1,444 | |||||||
SNP | Alan Grant | 15.0 | 1,066 | 1,087 | 1,088 | 1,103 | 1,147 | 1,262 | 1,365 | 1,651 | |
SNP | Ian Miller | 14.1 | 1,003 | 1,030 | 1,031 | 1,039 | 1,091 | 1,117 | 1,164 | 1,378 | |
SNP | Stan McMillan | 8.7 | 620 | 628 | 634 | 654 | 676 | 697 | 744 | ||
Labour | Lorna Ferguson | 6.6 | 470 | 483 | 486 | 506 | 553 | 606 | |||
Independent | Michael Gallagher | 4.3 | 308 | 334 | 335 | 401 | 449 | ||||
Scottish Green | Louise Ramsay | 4.0 | 285 | 317 | 321 | 337 | |||||
Independent | Hugh Anderson | 2.7 | 190 | 224 | 227 | ||||||
Electorate: 11,504 Valid: 7,096 Spoilt: 125 Quota: 1,420 Turnout: 62.77% |
Party | Candidate | FPv% | Count | ||
---|---|---|---|---|---|
1 | 2 | ||||
SNP | Bob Ellis | 33.8 | 1,680 | ||
Conservative | Caroline Shiers | 28.9 | 1,435 | ||
SNP | Liz Grant | 20.9 | 1,038 | 1,379 | |
Liberal Democrats | Alison Taylor | 9.2 | 459 | 487 | |
Labour | Roy Cameron | 7.2 | 357 | 371 | |
Electorate: 8,319 Valid: 4,969 Spoilt: 112 Quota: 1,243 Turnout: 61.08% |
Party | Candidate | FPv% | Count | |
---|---|---|---|---|
1 | ||||
SNP | Eleanor Howie | 32.9 | 1,489 | |
Conservative | Ian Campbell | 25.6 | 1,158 | |
SNP | Ken Lyall | 25.4 | 1,150 | |
Liberal Democrats | Danus Skene | 13.5 | 609 | |
Independent | Ron Rose | 2.5 | 115 | |
Electorate: 7,312 Valid: 4,531 Spoilt: 96 Quota: 1,131 Turnout: 63.14% |
Party | Candidate | FPv% | Count | ||||
---|---|---|---|---|---|---|---|
1 | 2 | 3 | 4 | ||||
Conservative | Barbara Vaughan | 32.7 | 1,400 | ||||
SNP | John Kellas | 32.6 | 1,398 | ||||
Liberal Democrats | Alan Livingstone | 17.4 | 747 | 892 | 930 | ||
SNP | Alisdair Wylie | 17.3 | 742 | 782 | 1,020 | 1,441 | |
Electorate: 6,998 Valid: 4,287 Spoilt: 80 Quota: 1,072 Turnout: 62.40% |
Party | Candidate | FPv% | Count | ||||||
---|---|---|---|---|---|---|---|---|---|
1 | 2 | 3 | 4 | 5 | 6 | ||||
SNP | Anne Younger | 25.18 | 1,210 | ||||||
Conservative | Ann Cowan | 23.80 | 1,144 | 1,145 | 1,200 | 1,329 | |||
Conservative | Helen McDonald | 18.39 | 884 | 885 | 935 | 998 | 1,094 | 1,500 | |
Independent | Rhona Brock | 13.28 | 638 | 640 | 723 | 985 | 996 | ||
Liberal Democrats | Russell Auld | 13.21 | 635 | 637 | 671 | ||||
Independent | Colin Crabbie | 6.14 | 295 | 296 | |||||
Electorate: 8,102 Valid: 4,806 Spoilt: 101 Quota: 1,202 Turnout: 60.58% |
Party | Candidate | FPv% | Count | ||||||||
---|---|---|---|---|---|---|---|---|---|---|---|
1 | 2 | 3 | 4 | 5 | 6 | 7 | 8 | ||||
SNP | John Law | 25.2 | 1,163 | ||||||||
Conservative | Murray Lyle | 15.6 | 842 | 845 | 847 | 870 | 897 | 1,379 | |||
Conservative | John Wilson | 14.8 | 666 | 667 | 673 | 683 | 696 | ||||
Independent | Colin Young | 13.5 | 609 | 611 | 636 | 658 | 697 | 773 | 882 | ||
Liberal Democrats | Ann Gaunt | 12.0 | 541 | 548 | 556 | 654 | 830 | 883 | 941 | 1,229 | |
Labour | Anne Chatt | 8.9 | 402 | 405 | 405 | 439 | |||||
Scottish Green | Hilary Halley | 5.0 | 225 | 231 | 234 | ||||||
Independent | Jock Stewart | 1.2 | 53 | 55 | |||||||
Electorate: 7,586 Valid: 4,501 Spoilt: 55 Quota: 1,126 Turnout: 60.06% |
Party | Candidate | FPv% | Count | |||||
---|---|---|---|---|---|---|---|---|
1 | 2 | 3 | 4 | 5 | ||||
SNP | Sandy Miller | 25.0 | 1,445 | |||||
Liberal Democrats | Willie Robertson | 22.7 | 1,314 | |||||
Conservative | Kathleen Baird | 21.0 | 1,217 | |||||
Liberal Democrats | Michael Barnacle | 16.3 | 942 | 1,010 | 1,094 | 1,115 | 1,242 | |
Labour | Kate Milliken | 11.2 | 650 | 692 | 713 | 717 | 774 | |
Scottish Green | Andrew Thompson | 3.7 | 216 | 278 | 295 | 302 | ||
Electorate: 9,664 Valid: 49 Spoilt: 5,784 Quota: 1,157 Turnout: 60.36% |
Party | Candidate | FPv% | Count | ||||
---|---|---|---|---|---|---|---|
1 | 2 | 3 | 4 | ||||
SNP | Wilma Lumsden | 36.6 | 1,790 | ||||
Conservative | Alan Jack | 30.2 | 1,477 | ||||
Liberal Democrats | George Hayton | 17.3 | 849 | 1,078 | 1,120 | 1,610 | |
Conservative | Pamella Roberts | 15.9 | 778 | 853 | 1,017 | ||
Electorate: 7,995 Valid: 4,894 Spoilt: 79 Quota: 1,224 Turnout: 62.20% |
Party | Candidate | FPv% | Count | |||||||
---|---|---|---|---|---|---|---|---|---|---|
1 | 2 | 3 | 4 | 5 | 6 | 7 | ||||
Liberal Democrats | Willie Wilson | 29.8 | 1,789 | |||||||
Conservative | Alexander Stewart | 29.4 | 1,768 | |||||||
SNP | Robert Band | 17.2 | 1,033 | 1,063 | 1,087 | 1,122 | 1,564 | |||
Labour | Jock Munro | 13.3 | 796 | 836 | 881 | 916 | 938 | 968 | ||
Liberal Democrats | Lorraine Caddell | 10.3 | 618 | 867 | 991 | 1,049 | 1,085 | 1,156 | 1,573 | |
SNP | Andrew Gadsden | 8.1 | 485 | 513 | 532 | 564 | ||||
Independent | Keith Mothersson | 3.2 | 191 | 201 | 222 | |||||
Electorate: 10,914 Valid: 6,680 Spoilt: 80 Quota: 1,337 Turnout: 61.94% |
Party | Candidate | FPv% | Count | |||||||
---|---|---|---|---|---|---|---|---|---|---|
1 | 2 | 3 | 4 | 5 | 6 | 7 | ||||
SNP | Elspeth Maclachlan | 23.5 | 1,217 | |||||||
SNP | Dave Scott | 19.3 | 1,001 | 1,127 | ||||||
Labour | John Flynn | 18.5 | 958 | 964 | 975 | 991 | 1,146 | |||
Conservative | Douglas Gratty | 13.4 | 694 | 698 | 703 | 725 | 842 | 847 | ||
Labour | Calum Gillies | 12.8 | 666 | 675 | 684 | 697 | 785 | 867 | 1,115 | |
Liberal Democrats | Philip Brown | 10.1 | 523 | 529 | 541 | 593 | ||||
Scottish Green | Adam Ramsay | 2.5 | 130 | 135 | 147 | |||||
Electorate: 11,189 Valid: 5,189 Spoilt: 153 Quota: 1,038 Turnout: 47.74% |
Party | Candidate | FPv% | Count | ||||||
---|---|---|---|---|---|---|---|---|---|
1 | 2 | 3 | 4 | 5 | 6 | ||||
SNP | Jack Coburn | 23.0 | 1,299 | ||||||
Liberal Democrats | Peter Barrett | 20.8 | 1,172 | ||||||
Conservative | Heather Stewart | 20.1 | 1,137 | ||||||
Labour | Archie MacLellan | 17.9 | 1,012 | 1,024 | 1,032 | 1,034 | 1,104 | 1,201 | |
SNP | Gordon Hunter | 8.6 | 488 | 598 | 604 | 604 | 664 | 745 | |
Independent | Ian Thomson | 5.3 | 298 | 305 | 312 | 313 | 364 | ||
Scottish Green | Jack Cockin | 4.2 | 238 | 249 | 258 | 259 | |||
Electorate: 11,109 Valid: 5,644 Spoilt: 115 Quota: 1,129 Turnout: 51.84% |
Party | Candidate | FPv% | Count | ||
---|---|---|---|---|---|
1 | |||||
SNP | Katie Howie | 59.90 | 1,891 | ||
Conservative | Graham Rees | 29.78 | 940 | ||
Liberal Democrats | Andrew Kenton | 7.25 | 229 | ||
Labour | Anne Chatt | 3.07 | 97 | ||
SNP hold | Swing | ||||
Electorate: 7,282 Valid: 3,157 Spoilt: 21 Quota: 1,579 Turnout: 43.6% |
Party | Candidate | FPv% | Count | |||||
---|---|---|---|---|---|---|---|---|
1 | 2 | 3 | 4 | 5 | ||||
Conservative | John Blackie | 33.42 | 1,713 | 1,724 | 1,785 | 2,208 | ||
SNP | Tom Gray | 30.34 | 1,555 | 1,569 | 1,769 | 2,299 | 3,302 | |
Liberal Democrats | Neil Gaunt | 20.33 | 1,042 | 1,057 | 1,321 | |||
Labour | Alistair Munro | 14.71 | 754 | 762 | ||||
Independent | Chris Rennie | 1.19 | 61 | |||||
SNP hold | Swing | |||||||
Electorate: 7,642 Valid: 5,125 Spoilt: 54 Quota: 2,563.5 Turnout: 67.8% |
Party | Candidate | FPv% | Count | ||
---|---|---|---|---|---|
1 | |||||
SNP | Mike Williamson | 54.43 | 1,449 | ||
Conservative | Graham Rees | 22.39 | 596 | ||
Liberal Democrats | Victor Clements | 12.06 | 321 | ||
Independent | William Leske | 10.11 | 269 | ||
Independent | Chris Rennie | 1.0 | 27 | ||
SNP hold | Swing | ||||
Electorate: 7,183 Valid: 2,662 Spoilt: 23 Quota: 1,332 Turnout: 2,685 (37.38%) |
Highland is a council area in the Scottish Highlands and is the largest local government area in the United Kingdom. It was the 7th most populous council area in Scotland at the 2011 census. It shares borders with the council areas of Aberdeenshire, Argyll and Bute, Moray and Perth and Kinross. Their councils, and those of Angus and Stirling, also have areas of the Scottish Highlands within their administrative boundaries.
Local government in Scotland comprises thirty-two local authorities, commonly referred to as councils. Each council provides public services, including education, social care, waste management, libraries and planning. Councils receive the majority of their funding from the Scottish Government, but operate independently and are accountable to their local electorates. Councils raise additional income via the Council Tax, a locally variable domestic property tax, and Business rates, a non-domestic property tax.
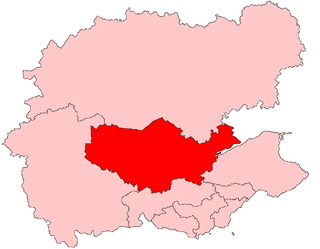
Ochil and South Perthshire was a county constituency of the House of Commons of the Parliament of the United Kingdom. It elected one Member of Parliament (MP) by the first-past-the-post system of election.
Perth and North Perthshire was a county constituency of the House of Commons of the Parliament of the United Kingdom. It elects one Member of Parliament (MP) by the first past the post system of election. The constituency was created in 2005.
Perth was a constituency of the Scottish Parliament (Holyrood). It elected one Member of the Scottish Parliament (MSP) by the plurality method of election. Also, however, it was one of nine constituencies in the Mid Scotland and Fife electoral region, which still elects seven additional members, in addition to nine constituency MSPs, to produce a form of proportional representation for the region as a whole.
Scotland has elections to several bodies: the Scottish Parliament, the United Kingdom Parliament, local councils and community councils. Before the United Kingdom left the European Union, Scotland elected members to the European Parliament.
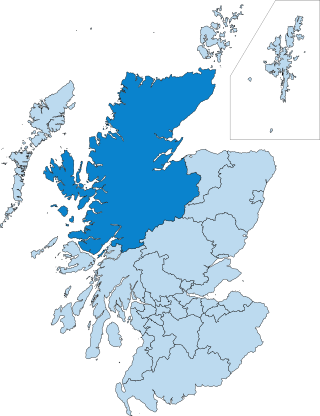
The politics of the Highland council area in Scotland are evident in the deliberations and decisions of the Highland Council, in elections to the council, and in elections to the House of Commons of the Parliament of the United Kingdom (Westminster) and the Scottish Parliament (Holyrood). In the European Parliament the area was within the Scotland constituency, which covers all of the 32 council areas of Scotland.
The Politics of Aberdeen, Scotland have changed significantly in recent years. In 1996, under the Local Government etc. (Scotland) Act 1994, Grampian Regional Council and Aberdeen District Council were dissolved, creating the new unitary Aberdeen City Council to represent the city's council area.
Elections to North Ayrshire Council were held on 3 May 2007, the same day as the 31 other Scottish local government elections and the Scottish Parliament elections. The election was the first one using eight new wards created as a result of the Local Governance (Scotland) Act 2004, each ward will elect three or four councillors using the single transferable vote system form of proportional representation. The new wards replaced the 30 single-member wards which used the plurality system of election.
The 2012 Scottish local elections were held on 3 May 2012 in all 32 local authorities. The Scottish National Party (SNP) overtook Labour to win the highest share of the vote, and retained and strengthened its position as the party with most councillors. Labour also made gains, while the Liberal Democrats experienced meltdown, losing over half their seats and falling behind the Conservatives. For the first time since the introduction of the Single Transferable Vote system, the SNP won majority control of 2 councils, from no overall control. Labour also won majority control of 2 councils from no overall control, while retaining majority control over 2 councils.
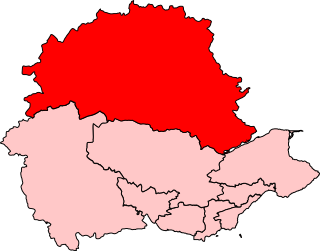
Perthshire North is a constituency of the Scottish Parliament (Holyrood) covering part of the council area of Perth and Kinross. It elects one Member of the Scottish Parliament (MSP) by the plurality method of election. It is one of nine constituencies in the Mid Scotland and Fife electoral region, which elects seven additional members, in addition to the nine constituency MSPs, to produce a form of proportional representation for the region as a whole.
Elections to Perth and Kinross Council were held on 3 May 2012, the same day as the other Scottish local government elections. The election used the twelve wards created as a result of the Local Governance (Scotland) Act 2004, with each ward electing three or four councillors using the single transferable vote system form of proportional representation, with 41 Councillors being elected.
The 2017 Scottish local elections were held on Thursday 4 May, in all 32 local authorities. The SNP retained its position as the largest party in terms of votes and councillors, despite suffering minor losses. The Conservatives made gains and displaced Labour as the second largest party, while the Liberal Democrats suffered a net loss of councillors despite increasing their share of the vote. Minor parties and independents polled well; and independent councillors retained majority control over the three island councils. For the first time since the local government reforms in 1995, all mainland councils fell under no overall control.
The sixth and last election to Tayside Regional Council was held on 5 May 1994 as part of the wider 1994 Scottish regional elections. The election saw the Scottish National Party overtaking Labour to become the council's largest party, and following the election the SNP formed a minority administration. The Conservatives lost 10 seats and became the third largest party. 8 weeks later, leader of the council Lena Graham resigned 'for personal reasons' and Ewan Dow took over as council leader.
Elections to Perth and Kinross Council were held on 4 May 2017, the same day as the other Scottish local government elections. The election covered the twelve wards created as a result of the Local Governance (Scotland) Act 2004, with each ward electing three or four councillors using the single transferable vote system form of proportional representation, with 40 Councillors being elected, a reduction of 1 member compared to 2012.
The 2017 Highland Council election was held on 4 May 2017 to elect members of the Highland Council. The election used the 21 wards created under the Local Governance (Scotland) Act 2004; each ward elected three or four councillors using the single transferable vote system. A total of 74 councillors were elected, six less than in 2012.
Highland is one of the twelve wards used to elect members of the Perth and Kinross Council. It elects three Councillors.
The 2022 Scottish local elections were held on 5 May 2022, as part of the 2022 United Kingdom local elections. All 1,226 seats across all 32 Scottish local authorities were up for election and voter turnout was 44.8%.
Elections to The Highland Council were held on 5 May 2022, the same day as the 31 other Scottish local government elections. As with other Scottish council elections, it was held using single transferable vote (STV) – a form of proportional representation – in which multiple candidates are elected in each ward and voters rank candidates in order of preference.
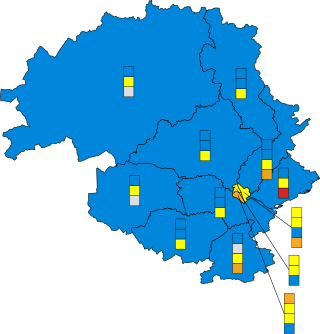
Elections to Perth and Kinross Council were held on 5 May 2022 as part of the 2022 Scottish local elections. 40 Councillors were elected from 12 multi-members electoral wards under the Single Transferable Vote electoral system. The Scottish Conservatives had run Perth and Kinross Council as a minority administration immediately prior to the election, with a previous coalition with the Scottish Liberal Democrats collapsing mid-way through the term. Twelve incumbent Councillors, including two group leaders, decided not to seek re-election whilst others stood again but lost their seats.