
The 2007 West Berkshire Council election took place on 3 May 2007 to elect members of West Berkshire Council in Berkshire, England. The whole council was up for election and the Conservative Party stayed in overall control of the council. [1]
The 2007 West Berkshire Council election took place on 3 May 2007 to elect members of West Berkshire Council in Berkshire, England. The whole council was up for election and the Conservative Party stayed in overall control of the council. [1]
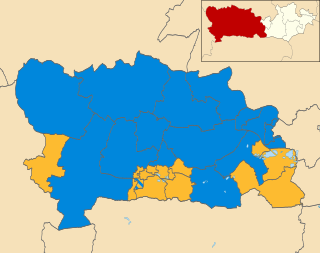
At the last election in 2003 both the Conservatives and Liberal Democrats won 26 seats and the Liberal Democrats kept control with the chairman's casting vote. [2] However the Conservatives took control in May 2005 after gaining a seat from the Liberal Democrats at a by-election. [3]
The Conservatives increased their majority to 20 seats after gaining seats from the Liberal Democrats. [4] Conservative gains included taking seats in Clay Hill, Falkland and Thatcham Central wards to win 36 seats on the council, but they did lose one seat in Thatcham North to leave the Liberal Democrats on 16 seats. [4] Overall turnout at the election improved to 45%. [4]
| Party | Seats | Gains | Losses | Net gain/loss | Seats % | Votes % | Votes | +/− | |
|---|---|---|---|---|---|---|---|---|---|
| Conservative | 36 | 10 | 1 | +9 | 69.2 | 59.4 | 52,047 | +9.1% | |
| Liberal Democrats | 16 | 1 | 10 | -9 | 30.8 | 35.3 | 30,962 | -10.3% | |
| Labour | 0 | 0 | 0 | 0 | 0 | 2.2 | 1,966 | -0.9% | |
| Independent | 0 | 0 | 0 | 0 | 0 | 1.5 | 1,330 | +1.1% | |
| Green | 0 | 0 | 0 | 0 | 0 | 0.9 | 831 | +0.4% | |
| BNP | 0 | 0 | 0 | 0 | 0 | 0.3 | 232 | +0.3% | |
| UKIP | 0 | 0 | 0 | 0 | 0 | 0.3 | 224 | +0.3% | |
| Party | Candidate | Votes | % | ±% | |
|---|---|---|---|---|---|
| Conservative | Irene Neill | 762 | 79.7 | +9.3 | |
| Liberal Democrats | Kath Evans | 194 | 20.3 | -9.3 | |
| Majority | 568 | 59.4 | +18.5 | ||
| Turnout | 956 | 46.5 | -1 | ||
| Conservative hold | Swing | ||||
| Party | Candidate | Votes | % | ±% | |
|---|---|---|---|---|---|
| Conservative | Alan Law | 968 | 83.2 | +27.3 | |
| Liberal Democrats | Silvia Boschetto | 195 | 16.8 | -27.3 | |
| Majority | 773 | 66.5 | +54.6 | ||
| Turnout | 1,163 | 51.2 | -4 | ||
| Conservative hold | Swing | ||||
| Party | Candidate | Votes | % | ±% | |
|---|---|---|---|---|---|
| Conservative | Joe Mooney | 1,390 | |||
| Conservative | Tony Linden | 1,340 | |||
| Conservative | Emma Webster | 1,265 | |||
| Labour | Sean Hartney | 509 | |||
| Liberal Democrats | Clive Hillman | 486 | |||
| Liberal Democrats | Susan Prime | 425 | |||
| Liberal Democrats | Paul Pritchard | 357 | |||
| Turnout | 5,772 | 34.6 | |||
| Conservative hold | Swing | ||||
| Conservative hold | Swing | ||||
| Conservative hold | Swing | ||||
| Party | Candidate | Votes | % | ±% | |
|---|---|---|---|---|---|
| Conservative | Graham Pask | 1,340 | |||
| Conservative | Quentin Webb | 1,283 | |||
| Liberal Democrats | Ben Morgan | 382 | |||
| Liberal Democrats | James Cullen | 283 | |||
| Turnout | 3,288 | 49.0 | |||
| Conservative hold | Swing | ||||
| Conservative hold | Swing | ||||
| Party | Candidate | Votes | % | ±% | |
|---|---|---|---|---|---|
| Liberal Democrats | Royce Longton | 991 | |||
| Conservative | Carol Jackson-Doerge | 956 | |||
| Conservative | Michael Wright | 946 | |||
| Liberal Democrats | John Farrin | 921 | |||
| Turnout | 3,814 | 44.9 | |||
| Liberal Democrats hold | Swing | ||||
| Conservative gain from Liberal Democrats | Swing | ||||
| Party | Candidate | Votes | % | ±% | |
|---|---|---|---|---|---|
| Conservative | Brian Bedwell | 1,507 | |||
| Conservative | Peter Argyle | 1,354 | |||
| Conservative | Manohar Gopal | 1,254 | |||
| Independent | Edmund Savage | 531 | |||
| Labour | Glenn Dennis | 504 | |||
| Liberal Democrats | Chris Day | 311 | |||
| Liberal Democrats | Gina Houghton | 282 | |||
| Green | Jacob Sanders | 270 | |||
| Liberal Democrats | Mark Thatcher | 197 | |||
| Turnout | 6,210 | 34.10 | |||
| Conservative hold | Swing | ||||
| Conservative hold | Swing | ||||
| Conservative hold | Swing | ||||
| Party | Candidate | Votes | % | ±% | |
|---|---|---|---|---|---|
| Conservative | Hilary Cole | 720 | 82.2 | +13.9 | |
| Liberal Democrats | John Steels | 156 | 17.8 | -13.9 | |
| Majority | 564 | 64.4 | +27.8 | ||
| Turnout | 876 | 46.8 | +9 | ||
| Conservative hold | Swing | ||||
| Party | Candidate | Votes | % | ±% | |
|---|---|---|---|---|---|
| Conservative | Jeff Beck | 986 | |||
| Conservative | Dave Goff | 892 | |||
| Liberal Democrats | Phil Barnett | 817 | |||
| Liberal Democrats | Pam Taylor | 717 | |||
| Labour | Barry Lambert | 88 | |||
| Turnout | 3,500 | 38.6 | +4 | ||
| Conservative gain from Liberal Democrats | Swing | ||||
| Conservative gain from Liberal Democrats | Swing | ||||
| Party | Candidate | Votes | % | ±% | |
|---|---|---|---|---|---|
| Conservative | Geoff Findlay | 834 | 69.0 | +13.8 | |
| Liberal Democrats | Rod King | 374 | 31.0 | -13.8 | |
| Majority | 460 | 38.1 | +27.8 | ||
| Turnout | 1,208 | 54.1 | +4.1 | ||
| Conservative hold | Swing | ||||
| Party | Candidate | Votes | % | ±% | |
|---|---|---|---|---|---|
| Conservative | Barbara Alexander | 798 | 68.3 | +7.9 | |
| Liberal Democrats | Peter Newman | 371 | 31.7 | -7.9 | |
| Majority | 427 | 36.5 | +15.7 | ||
| Turnout | 1,169 | 52.8 | +7 | ||
| Conservative hold | Swing | ||||
| Party | Candidate | Votes | % | ±% | |
|---|---|---|---|---|---|
| Conservative | George Chandler | 826 | 70.8 | +10.8 | |
| Liberal Democrats | Paul Walter | 160 | 13.7 | +13.7 | |
| Green | Adrian Hollister | 104 | 8.9 | +8.9 | |
| Labour | Yogi Johnston | 77 | 6.6 | -4.4 | |
| Majority | 666 | 57.1 | +26.1 | ||
| Turnout | 1,167 | 51.7 | +6 | ||
| Conservative hold | Swing | ||||
| Party | Candidate | Votes | % | ±% | |
|---|---|---|---|---|---|
| Conservative | Adrian Edwards | 1,537 | |||
| Conservative | Howard Bairstow | 1,510 | |||
| Liberal Democrats | Mavis Greenhalgh | 1,070 | |||
| Liberal Democrats | Peter Greenhalgh | 1,070 | |||
| Labour | Derek Brear | 100 | |||
| Turnout | 5,287 | 57.9 | +12 | ||
| Conservative gain from Liberal Democrats | Swing | ||||
| Conservative gain from Liberal Democrats | Swing | ||||
| Party | Candidate | Votes | % | ±% | |
|---|---|---|---|---|---|
| Liberal Democrats | Billy Drummond | 868 | |||
| Liberal Democrats | Julian Swift-Hook | 804 | |||
| Conservative | Chris Austin | 663 | |||
| Conservative | Ken Neal | 621 | |||
| Labour | Hannah Cooper | 101 | |||
| Turnout | 3,057 | 41.5 | +4 | ||
| Liberal Democrats hold | Swing | ||||
| Liberal Democrats hold | Swing | ||||
| Party | Candidate | Votes | % | ±% | |
|---|---|---|---|---|---|
| Conservative | Paul Hewer | 1,244 | |||
| Conservative | David Holtby | 1,189 | |||
| Liberal Democrats | Denise Gaines | 924 | |||
| Liberal Democrats | James Mole | 821 | |||
| Turnout | 4,178 | 49.0 | |||
| Conservative gain from Liberal Democrats | Swing | ||||
| Conservative gain from Liberal Democrats | Swing | ||||
| Party | Candidate | Votes | % | ±% | |
|---|---|---|---|---|---|
| Conservative | Andrew Rowles | 1,224 | |||
| Conservative | Anthony Stansfeld | 1,211 | |||
| Liberal Democrats | Christopher Doyle | 455 | |||
| Liberal Democrats | Ian O'Callaghan | 380 | |||
| Turnout | 3,270 | 46.5 | +10 | ||
| Conservative hold | Swing | ||||
| Conservative hold | Swing | ||||
| Party | Candidate | Votes | % | ±% | |
|---|---|---|---|---|---|
| Conservative | Graham Jones | 1,514 | |||
| Conservative | Gordon Lundie | 1,343 | |||
| Liberal Democrats | John Davies | 409 | |||
| Liberal Democrats | Joyce Easteal | 350 | |||
| Labour | Grahame Murphy | 85 | |||
| Turnout | 3,701 | 46.8 | +23 | ||
| Conservative hold | Swing | ||||
| Conservative hold | Swing | ||||
| Party | Candidate | Votes | % | ±% | |
|---|---|---|---|---|---|
| Liberal Democrats | Keith Lock | 1,183 | |||
| Liberal Democrats | Mollie Lock | 1,063 | |||
| Conservative | John Bull | 1,017 | |||
| Conservative | Ben Bovill | 928 | |||
| Turnout | 4,191 | 54.1 | +15 | ||
| Liberal Democrats hold | Swing | ||||
| Liberal Democrats hold | Swing | ||||
| Party | Candidate | Votes | % | ±% | |
|---|---|---|---|---|---|
| Liberal Democrats | Tony Vickers | 749 | |||
| Liberal Democrats | Gwen Mason | 712 | |||
| Conservative | John Tristam | 644 | |||
| Conservative | Charlie Farrow | 643 | |||
| Independent | David Yates | 342 | |||
| Independent | Lee Harris | 290 | |||
| Turnout | 3,380 | 45.5 | |||
| Liberal Democrats hold | Swing | ||||
| Liberal Democrats hold | Swing | ||||
| Party | Candidate | Votes | % | ±% | |
|---|---|---|---|---|---|
| Conservative | Pamela Bale | 742 | 82.8 | +8.6 | |
| Green | Katherine Kennet | 56 | 6.3 | +6.3 | |
| Liberal Democrats | Teresa Wareham | 50 | 5.6 | -10.3 | |
| Labour | Robert Tutton | 48 | 5.4 | -4.5 | |
| Majority | 686 | 76.6 | +18.4 | ||
| Turnout | 896 | 41.0 | +5 | ||
| Conservative hold | Swing | ||||
| Party | Candidate | Votes | % | ±% | |
|---|---|---|---|---|---|
| Conservative | Tim Metcalfe | 1,272 | |||
| Conservative | David Betts | 1,261 | |||
| Liberal Democrats | Stephen Bown | 278 | |||
| Green | Miriam Kennet | 264 | |||
| Labour | Riyad Abboushi | 261 | |||
| Liberal Democrats | David Wood | 238 | |||
| Turnout | 3,574 | 37.7 | +14 | ||
| Conservative hold | Swing | ||||
| Conservative hold | Swing | ||||
| Party | Candidate | Votes | % | ±% | |
|---|---|---|---|---|---|
| Conservative | Paul Bryant | 1,336 | |||
| Conservative | Marcus Franks | 1,295 | |||
| Liberal Democrats | Chris Hood | 517 | |||
| Liberal Democrats | Sam Elliott | 488 | |||
| Turnout | 3,636 | 44.2 | +5 | ||
| Conservative hold | Swing | ||||
| Conservative hold | Swing | ||||
| Party | Candidate | Votes | % | ±% | |
|---|---|---|---|---|---|
| Conservative | Mike Johnston | 1,269 | |||
| Conservative | Ieuan Tuck | 1,227 | |||
| Liberal Democrats | Malik Azam | 848 | |||
| Liberal Democrats | Cheryl McAlinn | 837 | |||
| Turnout | 4,181 | 48.9 | +9 | ||
| Conservative gain from Liberal Democrats | Swing | ||||
| Conservative hold | Swing | ||||
| Party | Candidate | Votes | % | ±% | |
|---|---|---|---|---|---|
| Conservative | Keith Chopping | 663 | 67.0 | +15.8 | |
| Liberal Democrats | James Kerry | 326 | 33.0 | -15.8 | |
| Majority | 337 | 34.1 | +31.8 | ||
| Turnout | 989 | 50.9 | +7 | ||
| Conservative hold | Swing | ||||
| Party | Candidate | Votes | % | ±% | |
|---|---|---|---|---|---|
| Conservative | Richard Crumly | 818 | |||
| Conservative | Ellen Crumly | 793 | |||
| Liberal Democrats | Patrick Denys | 773 | |||
| Liberal Democrats | Alexander Payton | 720 | |||
| UKIP | Craig Sandelands | 127 | |||
| Green | Volker Heinemann | 110 | |||
| Turnout | 3,341 | 39.9 | |||
| Conservative gain from Liberal Democrats | Swing | ||||
| Conservative gain from Liberal Democrats | Swing | ||||
| Party | Candidate | Votes | % | ±% | |
|---|---|---|---|---|---|
| Liberal Democrats | David Rendel | 1,019 | |||
| Liberal Democrats | Lee Dillon | 920 | |||
| Conservative | Sheila Ellison | 904 | |||
| Conservative | Kay Smurthwaite | 854 | |||
| BNP | Andy Clasper | 119 | |||
| BNP | Jacqui Hunt | 113 | |||
| Turnout | 3,929 | 49.7 | |||
| Liberal Democrats gain from Conservative | Swing | ||||
| Liberal Democrats hold | Swing | ||||
| Party | Candidate | Votes | % | ±% | |
|---|---|---|---|---|---|
| Liberal Democrats | Owen Jeffery | 898 | |||
| Liberal Democrats | Terry Port | 861 | |||
| Conservative | Peter Ellison | 817 | |||
| Conservative | Sandra Warham | 764 | |||
| Turnout | 3,340 | 38.7 | |||
| Liberal Democrats hold | Swing | ||||
| Liberal Democrats hold | Swing | ||||
| Party | Candidate | Votes | % | ±% | |
|---|---|---|---|---|---|
| Liberal Democrats | Keith Woodhams | 960 | |||
| Liberal Democrats | Jeff Brooks | 957 | |||
| Conservative | Rodney Arnold | 837 | |||
| Conservative | James Crumly | 797 | |||
| Turnout | 3,551 | 37.2 | |||
| Liberal Democrats hold | Swing | ||||
| Liberal Democrats hold | Swing | ||||
| Party | Candidate | Votes | % | ±% | |
|---|---|---|---|---|---|
| Liberal Democrats | Alan Macro | 445 | 50.9 | +9.5 | |
| Conservative | Ian MacFarlane | 300 | 34.3 | +0.5 | |
| Labour | Terry Jackson | 102 | 11.7 | -13.0 | |
| Green | Nicholas Foster | 27 | 3.1 | +3.1 | |
| Majority | 145 | 16.6 | +9.0 | ||
| Turnout | 874 | 42.0 | +10 | ||
| Liberal Democrats hold | Swing | ||||
| Party | Candidate | Votes | % | ±% | |
|---|---|---|---|---|---|
| Liberal Democrats | Roger Hunneman | 609 | |||
| Liberal Democrats | Gabrielle McGarvey | 578 | |||
| Conservative | Brian Goodall | 504 | |||
| Conservative | Pearl Hancock | 425 | |||
| Independent | Philip Parry | 167 | |||
| UKIP | David McMahon | 97 | |||
| Turnout | 2,380 | 35.1 | +5 | ||
| Liberal Democrats hold | Swing | ||||
| Liberal Democrats hold | Swing | ||||
| Party | Candidate | Votes | % | ±% | |
|---|---|---|---|---|---|
| Conservative | Laszlo Zverko | 460 | 64.4 | +23.7 | |
| Liberal Democrats | Sid Sidamparappillai | 163 | 22.8 | -17.3 | |
| Labour | Charles Croal | 91 | 12.7 | -6.5 | |
| Majority | 297 | 41.6 | +41.0 | ||
| Turnout | 714 | 38.7 | +7 | ||
| Conservative hold | Swing | ||||
| Party | Candidate | Votes | % | ±% | |
|---|---|---|---|---|---|
| Liberal Democrats | Robert Morgan | 936 | 54.3 | +2.0 | |
| Conservative | Dominic Boeck | 787 | 45.7 | -2.0 | |
| Majority | 149 | 8.6 | |||
| Turnout | 1,723 | 34.0 | -4.7 | ||
| Liberal Democrats hold | Swing | ||||

Newbury is a constituency represented in the House of Commons of the UK Parliament from 2019 by Laura Farris, a Conservative. It was created by the Redistribution of Seats Act 1885 and has been in continual existence since then.
The 1998 St Helens Metropolitan Borough Council election took place on 7 May 1998 to elect members of St Helens Metropolitan Borough Council in Merseyside, England. One third of the council was up for election and the Labour Party stayed in overall control of the council.
The 2000 Craven District Council election took place on 4 May 2000 to elect members of Craven District Council in North Yorkshire, England. One third of the council was up for election and the Conservative Party stayed in overall control of the council.

The 2004 Craven District Council election took place on 10 June 2004 to elect members of Craven District Council in North Yorkshire, England. One third of the council was up for election and the council stayed under no overall control.

The 2000 Harlow District Council election took place on 4 May 2000 to elect members of Harlow District Council in Essex, England. One third of the council was up for election and the Labour party stayed in overall control of the council.
The 1998 St Albans City and District Council election took place on 7 May 1998 to elect members of St Albans City and District Council in Hertfordshire, England. One third of the council was up for election and the Liberal Democrats stayed in overall control of the council.
The 1998 Wyre Forest District Council election took place on 7 May 1998 to elect members of Wyre Forest District Council in Worcestershire, England. One-third of the council was up for election and the Labour Party stayed in overall control of the council.

The 2007 Pendle Borough Council election took place on 3 May 2007 to elect members of Pendle Borough Council in Lancashire, England. One third of the council was up for election and the Liberal Democrats stayed in overall control of the council.

The 2004 Colchester Borough Council election took place on 10 June 2004 to elect members of Colchester Borough Council in Essex, England. This was the same day as the other 2004 United Kingdom local elections and as the 2004 European Parliament Elections. One third of the seats were up for election and the council stayed under no overall control.

The 2000 Colchester Borough Council election took place on 4 May 2000 to elect members of Colchester Borough Council in Essex, England. One third of the council was up for election and the council stayed under no overall control.

The 2008 Colchester Borough Council election took place on 1 May 2008 to elect members of Colchester Borough Council in Essex, England. One third of the council was up for election and the Conservative party lost overall control of the council to no overall control.

The 2006 Havant Borough Council election took place on 4 May 2006 to elect members of Havant Borough Council in Hampshire, England. One third of the council was up for election and the Conservative Party stayed in overall control of the council.

The 2007 Torridge District Council election took place on 3 May 2007 to elect members of Torridge District Council in Devon, England. The whole council was up for election and independents lost overall control of the council to no overall control.

The 2011 Torridge District Council election took place on 5 May 2011 to elect members of Torridge District Council in Devon, England. The whole council was up for election and the council stayed under no overall control.

The 2006 Huntingdonshire District Council election took place on 4 May 2006 to elect members of Huntingdonshire District Council in Cambridgeshire, England. One third of the council was up for election and the Conservative Party stayed in overall control of the council.

The 2008 Huntingdonshire District Council election took place on 1 May 2008 to elect members of Huntingdonshire District Council in Cambridgeshire, England. One third of the council was up for election and the Conservative Party stayed in overall control of the council.

The 2007 Rother District Council election took place on 3 May 2007 to elect members of Rother District Council in East Sussex, England. The whole council was up for election and the Conservative Party stayed in overall control of the council.
The 2000 West Berkshire Council election took place on 4 May 2000 to elect members of West Berkshire Council in Berkshire, England. The whole council was up for election and the Liberal Democrats stayed in overall control of the council.
The 2003 West Berkshire Council election took place on 1 May 2003 to elect members of West Berkshire Council in Berkshire, England. The whole council was up for election with boundary changes since the last election in 2000 reducing the number of seats by two. The Liberal Democrats lost overall control of the council to no overall control.

The 2011 West Berkshire Council election took place on 5 May 2011 to elect members of West Berkshire Council in Berkshire, England. The whole council was up for election and the Conservative Party stayed in overall control of the council.