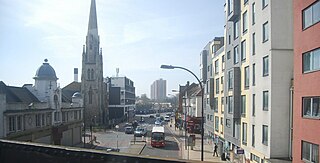
Elections to Poole Borough Council were held on 3 May 2007 in line with other local elections in the United Kingdom. All 42 seats across 16 wards [1] of this unitary authority were up for election.
There were 115 candidates nominated, comprised as follows:- 42 Conservatives, 36 Liberal Democrats, 16 Labour, 13 UK Independence Party, 5 Independents, 2 British National Party and 1 Green Party.
Party | Seats | Gains | Losses | Net gain/loss | Seats % | Votes % | Votes | +/− | |
---|---|---|---|---|---|---|---|---|---|
Conservative | 25 | 2 | 3 | -1 | 50.9 | 59.5 | 54,506 | ||
Liberal Democrats | 17 | 3 | 2 | +1 | 40.5 | 38.2 | 40,956 | ||
UKIP | 0 | 0 | 0 | 0 | 0 | 3.9 | 4,182 | ||
Labour | 0 | 0 | 0 | 0 | 0 | 3.6 | 3,907 | ||
Independent | 0 | 0 | 0 | 0 | 0 | 1.7 | 1,835 | ||
BNP | 0 | 0 | 0 | 0 | 0 | 0.8 | 878 | ||
Green | 0 | 0 | 0 | 0 | 0 | 0.4 | 836 |
Party | Candidate | Votes | % | ±% | |
---|---|---|---|---|---|
Liberal Democrats | Tony Trent | 1,652 | |||
Liberal Democrats | Lindsay Wilson | 1,611 | |||
Liberal Democrats | Charles Meachin | 1,534 | |||
Conservative | Carol Burnell | 537 | |||
Conservative | Michael Woolrych | 518 | |||
Conservative | Linda Gillard | 515 | |||
BNP | Stuart Smith | 464 | |||
UKIP | Joan Player | 349 | |||
Labour | Verity Sanderson | 302 | |||
Turnout | 2,900 | 34.86 | |||
Liberal Democrats hold | Swing | ||||
Party | Candidate | Votes | % | ±% | |
---|---|---|---|---|---|
Conservative | Mary Hillman | 947 | |||
Conservative | Guy Montrose | 817 | |||
Independent | Veronica Trevett | 577 | |||
Liberal Democrats | Cathey Gardner | 353 | |||
Liberal Democrats | Peter Matthews | 334 | |||
Turnout | 1,689 | 35.71 | |||
Conservative hold | Swing | ||||
Party | Candidate | Votes | % | ±% | |
---|---|---|---|---|---|
Liberal Democrats | Philip Eades | 1,119 | |||
Conservative | Joyce Lavender | 1,007 | |||
Liberal Democrats | Marion Le Poidevin | 996 | |||
Conservative | Jonathan Bagram | 854 | |||
Turnout | 2,108 | 38.90 | |||
Liberal Democrats hold | Swing | ||||
Conservative hold | Swing | ||||
Party | Candidate | Votes | % | ±% | |
---|---|---|---|---|---|
Liberal Democrats | Michael Brooke | 2,696 | |||
Liberal Democrats | Graham Mason | 2,314 | |||
Liberal Democrats | Daniel Martin | 2,301 | |||
Conservative | David Newell | 1,872 | |||
Conservative | Barry Smith | 1,796 | |||
Conservative | Marie Krolski-Pethen | 1,587 | |||
UKIP | Ian Critchley | 307 | |||
Independent | Roy Godfrey | 272 | |||
Independent | Brian Lloyd | 235 | |||
Turnout | 4,671 | 55.67 | |||
Liberal Democrats hold | Swing | ||||
Liberal Democrats gain from Conservative | Swing | ||||
Party | Candidate | Votes | % | ±% | |
---|---|---|---|---|---|
Conservative | Carol Deas | 2,610 | |||
Conservative | May Haines | 2,414 | |||
Conservative | Niel Sorton | 2,263 | |||
Liberal Democrats | Robin Rennison | 508 | |||
UKIP | John Haywood | 420 | |||
Turnout | 3,119 | 43.27 | |||
Conservative hold | Swing | ||||
Party | Candidate | Votes | % | ±% | |
---|---|---|---|---|---|
Liberal Democrats | Sandra Moore | 1,221 | |||
Liberal Democrats | Graham Curtis | 1,152 | |||
Conservative | Margaret Roebuck | 410 | |||
Conservative | Sheila Roberts | 399 | |||
UKIP | Valerie Foice | 139 | |||
Labour | Matthew Smith | 83 | |||
Labour | James Selby-Bennett | 76 | |||
Turnout | 1,844 | 34.20 | |||
Liberal Democrats hold | Swing | ||||
Party | Candidate | Votes | % | ±% | |
---|---|---|---|---|---|
Liberal Democrats | Chris Matthews | 1,100 | |||
Liberal Democrats | Jeffrey Allen | 994 | |||
Conservative | Bernard Broderick | 757 | |||
Conservative | Mike Walton | 706 | |||
UKIP | Jack Edwards | 163 | |||
Labour | Julie Sanderson | 125 | |||
Labour | George Inglis | 113 | |||
Turnout | 2,104 | 39.76 | |||
Liberal Democrats hold | Swing | ||||
Party | Candidate | Votes | % | ±% | |
---|---|---|---|---|---|
Conservative | Leslie Burden | 1,649 | |||
Conservative | John Rampton | 1,503 | |||
Conservative | Judy Butt | 1,475 | |||
Liberal Democrats | Rory Mackay | 788 | |||
Liberal Democrats | Keith Bates | 757 | |||
Liberal Democrats | Andrew May | 753 | |||
UKIP | John Butler | 364 | |||
Turnout | 2,556 | 35.18 | |||
Conservative hold | Swing | ||||
Party | Candidate | Votes | % | ±% | |
---|---|---|---|---|---|
Conservative | Roger Gregory | 805 | |||
Conservative | Mike White | 793 | |||
Liberal Democrats | Carol Bond | 494 | |||
Liberal Democrats | Martin Fraser | 377 | |||
Labour | Darren Brown | 256 | |||
Labour | Jason Sanderson | 209 | |||
Turnout | 1,542 | 35.65 | |||
Conservative hold | Swing | ||||
Party | Candidate | Votes | % | ±% | |
---|---|---|---|---|---|
Conservative | Graham Chandler | 829 | |||
Conservative | Michael Wilkins | 815 | |||
Liberal Democrats | Lou Knight | 563 | |||
Liberal Democrats | Ann Deacon | 510 | |||
Labour | Pat Hicks | 223 | |||
Labour | Bill Duncan | 198 | |||
Turnout | 1,649 | 32.61 | |||
Conservative gain from Liberal Democrats | Swing | ||||
Party | Candidate | Votes | % | ±% | |
---|---|---|---|---|---|
Liberal Democrats | Peter Maiden | 2,238 | |||
Liberal Democrats | David Brown | 2,227 | |||
Liberal Democrats | Daphne Long | 2,036 | |||
Conservative | Katie Hives | 1,676 | |||
Conservative | Jonathan Pethen | 1,492 | |||
Conservative | Karen Rampton | 1,475 | |||
Turnout | 3,901 | 46.81 | |||
Liberal Democrats hold | Swing | ||||
Liberal Democrats gain from Conservative | Swing | ||||
Party | Candidate | Votes | % | ±% | |
---|---|---|---|---|---|
Liberal Democrats | Michael Plummer | 1,452 | |||
Liberal Democrats | Brian Clements | 1,439 | |||
Liberal Democrats | Graham Wilson | 1,391 | |||
Conservative | John Allen | 854 | |||
Conservative | Leo Belcham | 809 | |||
Conservative | Suki Tate | 770 | |||
Labour | Hazel Malcolm-Walker | 322 | |||
Labour | Ian Malcolm-Walker | 287 | |||
Turnout | 2,781 | 30.75 | |||
Liberal Democrats hold | Swing | ||||
Party | Candidate | Votes | % | ±% | |
---|---|---|---|---|---|
Conservative | Peter Adams | 1,584 | |||
Conservative | David Gillard | 1,484 | |||
Conservative | Janet Walton | 1,194 | |||
Liberal Democrats | Christina Parker | 572 | |||
Liberal Democrats | Sean Perrin | 926 | |||
Liberal Democrats | Angela van Lancker | 868 | |||
Labour | Brian Ellis | 413 | |||
UKIP | Gillian Coulbeck | 379 | |||
Labour | Tony Gardner | 363 | |||
UKIP | Emma-Leigh Graham | 353 | |||
UKIP | Michael Fisher | 322 | |||
Labour | Tilak Ginige | 298 | |||
Turnout | 2,781 | 30.75 | |||
Conservative hold | Swing | ||||
Party | Candidate | Votes | % | ±% | |
---|---|---|---|---|---|
Conservative | Anne Stribley | 2,074 | |||
Conservative | Don Collier | 1,989 | |||
Conservative | Tony Woodcock | 1,747 | |||
Liberal Democrats | Judith Howells | 947 | |||
Green | Jack Constantine | 836 | |||
Independent | Ian Northover | 559 | |||
BNP | Glenn Chappelle-Marriot | 298 | |||
Turnout | 3,352 | 40.51 | |||
Conservative hold | Swing | ||||
Party | Candidate | Votes | % | ±% | |
---|---|---|---|---|---|
Conservative | Elaine Atkinson | 1,947 | |||
Conservative | Xena Dion | 1,942 | |||
Conservative | Ronald Parker | 1,911 | |||
Liberal Democrats | Quenten Walker | 900 | |||
UKIP | Marion Wilson | 472 | |||
Turnout | 3,068 | 36.14 | |||
Conservative hold | Swing | ||||
Party | Candidate | Votes | % | ±% | |
---|---|---|---|---|---|
Conservative | Carol Evans | 1,248 | |||
Conservative | Brian Leverett | 1,245 | |||
Conservative | Chris Bulteel | 1,190 | |||
Liberal Democrats | Sarah Wilson | 485 | |||
Liberal Democrats | David Parker | 480 | |||
Liberal Democrats | Anndrew Muspratt | 478 | |||
UKIP | Avril King | 377 | |||
Labour | Jennie Ellis | 346 | |||
Labour | John Hewinson | 293 | |||
UKIP | Andrew Smith | 286 | |||
UKIP | Peter Wheat | 251 | |||
Independent | Jason Jones | 192 | |||
Turnout | 2,481 | 35.40 | |||
Conservative hold | Swing | ||||
Lewisham is a London borough in south-east London, England. It forms part of Inner London. The principal settlement of the borough is Lewisham. The local authority is Lewisham London Borough Council, based in Catford. The Prime Meridian passes through Lewisham. Blackheath, Goldsmiths, University of London and Millwall F.C. are located within the borough.
Weymouth and Portland was a local government district with borough status in Dorset, England from 1974 to 2019. It consisted of the resort of Weymouth and the Isle of Portland, and includes the areas of Wyke Regis, Preston, Melcombe Regis, Upwey, Broadwey, Southill, Nottington, Westham, Radipole, Chiswell, Castletown, Fortuneswell, Weston, Southwell and Easton; the latter six being on the Isle of Portland.
Bournemouth West is a parliamentary constituency in Dorset represented in the House of Commons of the UK Parliament since 2010 by Conor Burns, a Conservative.
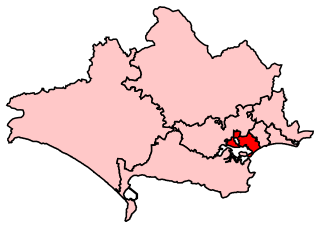
Poole is a constituency represented in the House of Commons of the UK Parliament since 1997 by Robert Syms, a Conservative.
Bournemouth Borough Council was the local authority for Bournemouth in Dorset, England between 1974 and 2019. Prior to 1974 Bournemouth had been a county borough within Hampshire. Under the Local Government Act 1972 Bournemouth became a non-metropolitan district within Dorset on 1 April 1974, with the same boundaries as the former county borough. On 1 April 1997 it became a unitary authority, taking over the functions previously provided for the area by Dorset County Council. In 2019 the council was abolished, merging with Christchurch and Poole to form Bournemouth, Christchurch and Poole.
Christchurch Borough Council in Dorset, England, existed from 1974 to 2019, when it was abolished and subsumed into Bournemouth, Christchurch and Poole Council.
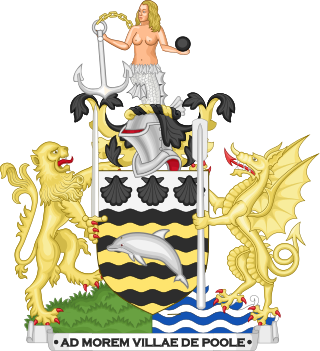
Poole Borough Council was the unitary authority responsible for local government in the Borough of Poole, Dorset, England. It was created on 1 April 1997 following a review by the Local Government Commission for England (1992), becoming administratively independent from Dorset County Council, and ceased to exist on 1 April 2019. Its council comprised 16 wards and 42 councillors and was controlled by a Conservative administration before it was merged into Bournemouth, Christchurch and Poole Council.
Poole was a unitary authority in Dorset, England from 1997 to 2019. From 1974 until 1 April 1997 it was a non-metropolitan district. In 2019 it was abolished and subsumed into Bournemouth, Christchurch and Poole Council.
The 2004 Rushmoor Council election took place on 10 June 2004 to elect members of Rushmoor Borough Council in Hampshire, England. One third of the council was up for election and the Conservative Party stayed in overall control of the council.
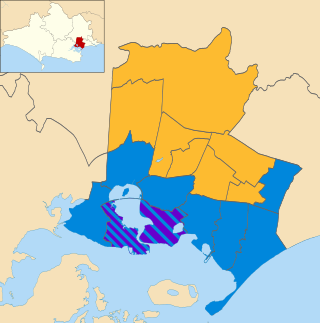
Elections to Poole Borough Council were held on 5 May 2011 in line with other local elections in the United Kingdom. All 42 seats across 16 wards of this unitary authority were up for election.
The 2007 Hertsmere Borough Council election took place on 3 May 2007 to elect members of Hertsmere Borough Council in Hertfordshire, England. One third of the council was up for election and the Conservative Party stayed in overall control of the council.
The 2007 Redcar and Cleveland Borough Council election took place on 3 May 2007 to elect members of Redcar and Cleveland Unitary Council in England. The whole council was up for election and the council stayed under no overall control.
The 2011 Eastbourne Borough Council election took place on 5 May 2011 to elect members of Eastbourne Borough Council in East Sussex, England. The whole council was up for election and the Liberal Democrats stayed in overall control of the council.
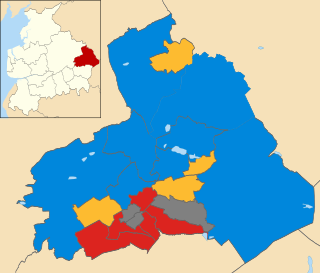
The 2011 Pendle Borough Council election took place on 5 May 2011 to elect members of Pendle Borough Council in Lancashire, England. One third of the council was up for election and the council stayed under no overall control.
Bournemouth, Christchurch and Poole (BCP) is a unitary authority area in the ceremonial county of Dorset, England. It was created on 1 April 2019 by the merger of the areas that were previously administered by the unitary authorities of Bournemouth and Poole, and the non-metropolitan district of Christchurch. The authority covers much of the area of the South Dorset conurbation.
Dorset Council is a unitary local authority for the district of Dorset, encompassing almost all of the county of the same name (Dorset) except for the district of Bournemouth, Christchurch and Poole. Created in April 2019, the council was formed when the county moved from a two-tier county council and district council system to a one-tier system, with the county divided into two districts administered by two independent unitary authorities.

The Party for Poole People is a movement and local political party in Poole, Dorset, England. Defining itself as neither left or right wing, the party has stood in elections for the former Poole Borough Council and the Bournemouth, Christchurch and Poole Council which replaced it. On the council it is part of the Poole Independents Group, which includes all three Poole People Councillors, one Alliance for Local Living (ALL) Councillor and one independent Councillor. It was previously part of the "Unity Alliance" administration on Bournemouth, Christchurch and Poole Council from 2019 until a vote of no confidence in 2020, after which the party has been in opposition. It was founded in 2010 by Mark Howell, and has contested three local elections, as well as the Poole constituency in the 2015 UK general election.
The 2019 Bournemouth, Christchurch and Poole Council election took place on 2 May 2019 to elect the inaugural members of Bournemouth, Christchurch and Poole Council in England, formed from the former unitary authorities of Bournemouth and Poole, and borough of Christchurch. At the same time an election for the new Christchurch Town Council was held.
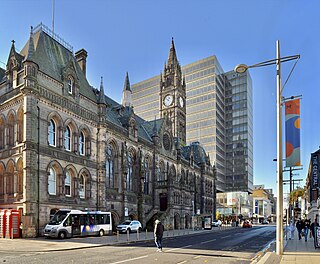
The Borough of Middlesbrough is a borough with unitary authority status in North Yorkshire, England, based around the town of Middlesbrough in the north of the county. It is part of the Tees Valley combined authority, along with Stockton-on-Tees, Redcar and Cleveland, Hartlepool and Darlington boroughs. Nunthorpe along with Stainton and Thornton have statutory parish councils.
The 2022 Islington London Borough Council election took place on 5 May 2022. All 51 members of Islington London Borough Council were to be elected. The elections took place alongside local elections in the other London boroughs and elections to local authorities across the United Kingdom.