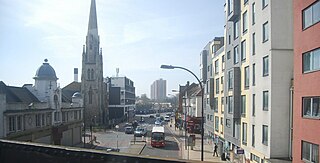
Elections to Poole Borough Council were held on 5 May 2011 in line with other local elections in the United Kingdom. All 42 seats across 16 wards [1] of this unitary authority were up for election.
There were 118 candidates nominated, comprised as follows:- 42 Conservatives, 33 Liberal Democrats, 11 UK Independence Party, 9 Independents, 11 Labour, 8 Poole People, [2] 2 Green Party and 2 British National Party. [3]
Party | Seats | Gains | Losses | Net gain/loss | Seats % | Votes % | Votes | +/− | |
---|---|---|---|---|---|---|---|---|---|
Conservative | 21 | 2 | 3 | -1 | 50.0 | 45.1 | 49,373 | -5.8% | |
Liberal Democrats | 18 | 1 | 0 | +1 | 42.9 | 30.4 | 33,286 | -7.8% | |
Poole People | 3 | 2 | 0 | +2 | 7.1 | 8.8 | 9,603 | +8.8% | |
Independent | 0 | 0 | 2 | -2 | 0 | 5.5 | 6,049 | +3.8% | |
Labour | 0 | 0 | 0 | 0 | 0 | 4.6 | 5,074 | +1.0% | |
UKIP | 0 | 0 | 0 | 0 | 0 | 4.4 | 4,812 | +0.5% | |
Green | 0 | 0 | 0 | 0 | 0 | 0.7 | 785 | -0.1% | |
BNP | 0 | 0 | 0 | 0 | 0 | 0.4 | 468 | -0.4% |
Party | Candidate | Votes | % | ±% | |
---|---|---|---|---|---|
Liberal Democrats | Tony Trent | 1,093 | |||
Liberal Democrats | Lindsay Wilson | 1,001 | |||
Liberal Democrats | Charles Meachin | 970 | |||
Conservative | Philip Broadhead | 815 | |||
Conservative | Meraz Choudhury | 715 | |||
Conservative | James Vassay | 638 | |||
Labour | Joan Jones | 550 | |||
Labour | Ian Malcolm-Walker | 477 | |||
Labour | Jason Sanderson | 448 | |||
UKIP | Joan Player | 394 | |||
Independent | Brian Camfield | 330 | |||
Green | Joshua Harvey | 285 | |||
Turnout | |||||
Liberal Democrats hold | Swing | ||||
Party | Candidate | Votes | % | ±% | |
---|---|---|---|---|---|
Conservative | Stephen Rollo-Smith | 1,008 | |||
Conservative | Karen Rampton | 1,001 | |||
Liberal Democrats | Peter Matthews | 464 | |||
Liberal Democrats | Graham Mason | 433 | |||
UKIP | Robert Baggs | 285 | |||
Turnout | |||||
Conservative hold | Swing | ||||
Party | Candidate | Votes | % | ±% | |
---|---|---|---|---|---|
Liberal Democrats | Philip Eades | 1,531 | |||
Liberal Democrats | Marion Le Poidevin | 1,160 | |||
Conservative | Joyce Lavender | 871 | |||
Conservative | Malcolm Shakesby | 524 | |||
Turnout | |||||
Liberal Democrats hold | Swing | ||||
Liberal Democrats gain from Conservative | Swing | ||||
Party | Candidate | Votes | % | ±% | |
---|---|---|---|---|---|
Liberal Democrats | Michael Brooke | 2,559 | |||
Liberal Democrats | Roy Godfrey | 2,027 | |||
Liberal Democrats | Vikki Slade | 2,016 | |||
Conservative | David Newell | 1,994 | |||
Conservative | Barry Smith | 1,718 | |||
Conservative | Paul Roebuck | 1,684 | |||
Green | Mark Chivers | 500 | |||
UKIP | Alan Gerring | 499 | |||
Turnout | |||||
Liberal Democrats hold | Swing | ||||
Party | Candidate | Votes | % | ±% | |
---|---|---|---|---|---|
Conservative | May Haines | 1,854 | |||
Conservative | Niel Sorton | 1,658 | |||
Conservative | Peter Pawlowski | 1,626 | |||
Independent | Carole Deas | 1,464 | |||
Independent | Susanna Carvell | 989 | |||
Independent | Ian Walker | 783 | |||
Liberal Democrats | Michael Baker | 447 | |||
UKIP | Avril King | 321 | |||
Turnout | |||||
Conservative hold | Swing | ||||
Conservative gain from Independent | Swing | ||||
Party | Candidate | Votes | % | ±% | |
---|---|---|---|---|---|
Liberal Democrats | Sandra Moore | 1,150 | |||
Liberal Democrats | Jennie Hodges | 1,075 | |||
Conservative | Zena Newman | 564 | |||
Conservative | Byron Quayle | 529 | |||
UKIP | Valerie Foice | 351 | |||
Turnout | |||||
Liberal Democrats hold | Swing | ||||
Party | Candidate | Votes | % | ±% | |
---|---|---|---|---|---|
Liberal Democrats | Chris Matthews | 1,172 | |||
Liberal Democrats | Phil Goodall | 1,164 | |||
Conservative | Will Burstow | 819 | |||
Conservative | Rob Way | 730 | |||
UKIP | Peter Wheat | 323 | |||
Turnout | |||||
Liberal Democrats hold | Swing | ||||
Party | Candidate | Votes | % | ±% | |
---|---|---|---|---|---|
Conservative | Leslie Burden | 1,515 | |||
Conservative | Judy Butt | 1,487 | |||
Conservative | John Rampton | 1,284 | |||
Independent | Siobhan Coleman | 720 | |||
UKIP | John Butler | 635 | |||
Liberal Democrats | Eleanor Perera | 591 | |||
Liberal Democrats | Rory MacKay | 587 | |||
Turnout | |||||
Conservative hold | Swing | ||||
Party | Candidate | Votes | % | ±% | |
---|---|---|---|---|---|
Poole People | Charmaine Parkinson | 728 | |||
Conservative | Mike White | 688 | |||
Conservative | Roger Gregory | 651 | |||
Liberal Democrats | Peter England | 289 | |||
Labour | Darren Brown | 283 | |||
Liberal Democrats | Jeff Allen | 278 | |||
Labour | Andrew Sweetmore | 168 | |||
Turnout | |||||
Conservative hold | Swing | ||||
Poole People gain from Conservative | Swing | ||||
Party | Candidate | Votes | % | ±% | |
---|---|---|---|---|---|
Conservative | Graham Chandler | 778 | |||
Conservative | Michael Wilkins | 755 | |||
Poole People | Lou Knight | 654 | |||
Labour | Pat Hicks | 349 | |||
Liberal Democrats | Max Dunnett | 240 | |||
Liberal Democrats | Jason Jones | 142 | |||
Turnout | |||||
Conservative hold | Swing | ||||
Party | Candidate | Votes | % | ±% | |
---|---|---|---|---|---|
Liberal Democrats | David Brown | 2,054 | |||
Liberal Democrats | Sandra Cox | 2,026 | |||
Liberal Democrats | Peter Maiden | 1,976 | |||
Conservative | Bernard Broderick | 1,936 | |||
Conservative | Jane Thomas | 1,639 | |||
Conservative | Andrew Chard | 1,593 | |||
Turnout | |||||
Liberal Democrats hold | Swing | ||||
Party | Candidate | Votes | % | ±% | |
---|---|---|---|---|---|
Liberal Democrats | Brian Clements | 1,137 | |||
Liberal Democrats | Jo Clements | 1,131 | |||
Liberal Democrats | Graham Wilson | 1,001 | |||
Conservative | Ashley Fraser | 886 | |||
Conservative | Chris Harrison | 857 | |||
Conservative | Sonia Pedrini | 820 | |||
Labour | Hazel Malcolm-Walker | 636 | |||
UKIP | Diana Butler | 527 | |||
BNP | Dawn Coleman | 264 | |||
Independent | David Kenyon | 246 | |||
BNP | William Kimmet | 204 | |||
Turnout | |||||
Liberal Democrats hold | Swing | ||||
Party | Candidate | Votes | % | ±% | |
---|---|---|---|---|---|
Conservative | Ian Potter | 1,264 | |||
Conservative | Peter Adams | 1,262 | |||
Conservative | Janet Walton | 1,129 | |||
Poole People | Andy Hadley | 978 | |||
Poole People | Hugh Todd | 770 | |||
Independent | David Gillard | 682 | |||
Labour | Brian Ellis | 556 | |||
Liberal Democrats | Larry Adams | 525 | |||
Independent | Linda Gillard | 464 | |||
Labour | Sue Mallory | 445 | |||
Liberal Democrats | Alan Brooker | 436 | |||
Liberal Democrats | David Chicken | 430 | |||
Labour | Andrei Dudau | 415 | |||
UKIP | Michael Fisher | 377 | |||
Independent | Karl Ingham | 371 | |||
Turnout | |||||
Conservative hold | Swing | ||||
Conservative gain from Independent | Swing | ||||
Party | Candidate | Votes | % | ±% | |
---|---|---|---|---|---|
Conservative | Sally Carpenter | 2,008 | |||
Conservative | Anne Stribley | 1,764 | |||
Conservative | Tony Woodcock | 1,613 | |||
Poole People | Sam Howell | 1,500 | |||
Liberal Democrats | Michael Nance | 795 | |||
Labour | Paul Reading | 747 | |||
UKIP | Lloyd Butt | 586 | |||
Turnout | |||||
Conservative hold | Swing | ||||
Party | Candidate | Votes | % | ±% | |
---|---|---|---|---|---|
Conservative | Elaine Atkinson | 1,929 | |||
Conservative | Xena Dion | 1,929 | |||
Conservative | Ronald Parker | 1,771 | |||
Poole People | Peter Miles | 1,431 | |||
Liberal Democrats | Roy Parker | 843 | |||
UKIP | Jack Edwards | 514 | |||
Turnout | |||||
Conservative hold | Swing | ||||
Party | Candidate | Votes | % | ±% | |
---|---|---|---|---|---|
Poole People | Mark Howell | 1,911 | |||
Poole People | Chris Wilson | 1,631 | |||
Conservative | Carol Evans | 1,015 | |||
Conservative | Chris Bulteel | 1,006 | |||
Conservative | Tony Reeves | 898 | |||
Liberal Democrats | Dee Knights | 543 | |||
Turnout | |||||
Conservative hold | Swing | ||||
Poole People hold | Swing | ||||
Poole People gain from Conservative | Swing | ||||
Lewisham is a London borough in south-east London, England. It forms part of Inner London. The principal settlement of the borough is Lewisham. The local authority is Lewisham London Borough Council, based in Catford. The Prime Meridian passes through Lewisham. Blackheath, Goldsmiths, University of London and Millwall F.C. are located within the borough.
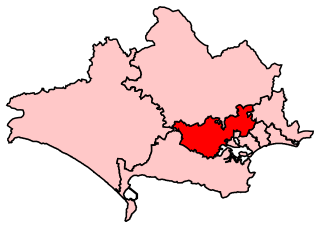
Mid Dorset and North Poole is a constituency represented in the House of Commons of the UK Parliament since 2015 by Michael Tomlinson, a Conservative.
Richmond Park is a constituency in Greater London represented in the House of Commons of the UK Parliament. Since 2019, its Member of Parliament (MP) has been Sarah Olney of the Liberal Democrats.
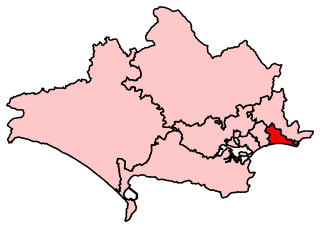
Bournemouth East is a parliamentary constituency in Dorset represented in the House of Commons of the UK Parliament since 2005 by Tobias Ellwood, a Conservative.
Bournemouth West is a parliamentary constituency in Dorset represented in the House of Commons of the UK Parliament since 2010 by Conor Burns, a Conservative.
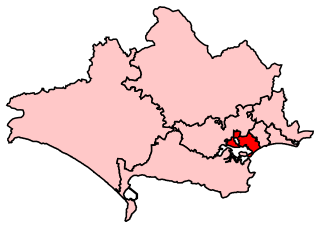
Poole is a constituency represented in the House of Commons of the UK Parliament since 1997 by Robert Syms, a Conservative.
Bournemouth Borough Council was the local authority for Bournemouth in Dorset, England between 1974 and 2019. Prior to 1974 Bournemouth had been a county borough within Hampshire. Under the Local Government Act 1972 Bournemouth became a non-metropolitan district within Dorset on 1 April 1974, with the same boundaries as the former county borough. On 1 April 1997 it became a unitary authority, taking over the functions previously provided for the area by Dorset County Council. In 2019 the council was abolished, merging with Christchurch and Poole to form Bournemouth, Christchurch and Poole.
Poplar and Limehouse is a constituency created in 2010 and represented in the House of Commons of the UK Parliament since 2019 by Apsana Begum of the Labour Party. From its creation until 2019, it was represented by Jim Fitzpatrick, also of Labour.
Poole Borough Council was the unitary authority responsible for local government in the Borough of Poole, Dorset, England. It was created on 1 April 1997 following a review by the Local Government Commission for England (1992), becoming administratively independent from Dorset County Council, and ceased to exist on 1 April 2019. Its council comprised 16 wards and 42 councillors and was controlled by a Conservative administration before it was merged into Bournemouth, Christchurch and Poole Council.
Poole was a unitary authority in Dorset, England from 1997 to 2019. From 1974 until 1 April 1997 it was a non-metropolitan district. In 2019 it was abolished and subsumed into Bournemouth, Christchurch and Poole Council.
Elections to Newham London Borough Council in London, England was held on 6 May 2010. This was on the same day as other local elections and the general election to the UK Parliament.
The 2004 Rushmoor Council election took place on 10 June 2004 to elect members of Rushmoor Borough Council in Hampshire, England. One third of the council was up for election and the Conservative Party stayed in overall control of the council.
The 2006 Rushmoor Council election took place on 4 May 2006 to elect members of Rushmoor Borough Council in Hampshire, England. One third of the council was up for election and the Conservative Party stayed in overall control of the council.
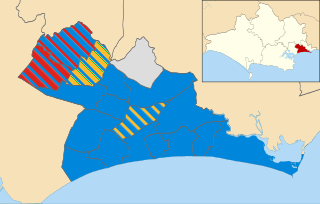
Elections to Bournemouth Borough Council were held on 5 May 2011, in line with other local elections in the United Kingdom. All 54 seats, across 18 wards of this unitary authority, were up for election.
Elections to Poole Borough Council were held on 3 May 2007 in line with other local elections in the United Kingdom. All 42 seats across 16 wards of this unitary authority were up for election.
The 2010 Barrow-in-Furness Borough Council election took place on 6 May 2010 to elect members of Barrow-in-Furness Borough Council in Cumbria, England. One third of the council was up for election and the council stayed under no overall control.
The 2014 Newham London Borough Council election took place on 22 May 2014 to elect members of Newham London Borough Council in England. This was on the same day as other local elections.
Bournemouth, Christchurch and Poole (BCP) is a unitary authority area in the ceremonial county of Dorset, England. It was created on 1 April 2019 by the merger of the areas that were previously administered by the unitary authorities of Bournemouth and Poole, and the non-metropolitan district of Christchurch. The authority covers much of the area of the South Dorset conurbation.
The 2019 Bournemouth, Christchurch and Poole Council election took place on 2 May 2019 to elect the inaugural members of Bournemouth, Christchurch and Poole Council in England, formed from the former unitary authorities of Bournemouth and Poole, and borough of Christchurch. At the same time an election for the new Christchurch Town Council was held.
Canford Heath is a ward in Poole, Dorset. Since 2019, the ward has elected 3 councillors to Bournemouth, Christchurch and Poole Council.