| |||||||||||||||||||||||||||||||||
16 of the 48 seats 25 seats needed for a majority | |||||||||||||||||||||||||||||||||
---|---|---|---|---|---|---|---|---|---|---|---|---|---|---|---|---|---|---|---|---|---|---|---|---|---|---|---|---|---|---|---|---|---|
| |||||||||||||||||||||||||||||||||
Map showing the 2011 local election results in Ipswich. | |||||||||||||||||||||||||||||||||
|
Elections for Ipswich Borough Council were held on Thursday 5 May 2011. One third of the seats were up for election and the Labour Party gained control of the council, which had previously been run under by a Conservative - Liberal Democrat coalition since 2004.
After the election, the composition of the council was: [1]
Party | Candidate | Votes | % | |
---|---|---|---|---|
Labour | Harvey Crane | 1,158 | 49.5% | |
Liberal Democrats | Jane Chambers | 577 | 24.7% | |
Conservative | Roy Flood | 449 | 19.2% | |
Green | Jane Scott | 155 | 6.6% | |
Majority | 581 | 24.8% | ||
Turnout | 2,339 | |||
Liberal Democrats hold | ||||
Party | Candidate | Votes | % | |
---|---|---|---|---|
Conservative | Kym Stroet | 1,518 | 55.4% | |
Labour | Kanthasamy Elavalakan | 833 | 30.4% | |
Liberal Democrats | Clive Witter | 388 | 14.2% | |
Majority | 685 | 25.0% | ||
Turnout | 2,739 | |||
Conservative hold | ||||
Party | Candidate | Votes | % | |
---|---|---|---|---|
Labour | Philip Smart | 1,150 | 55.7% | |
Conservative | James Spencer | 712 | 34.5% | |
Liberal Democrats | Juliet Groves | 204 | 9.9% | |
Majority | 438 | 21.2% | ||
Turnout | 2,066 | |||
Labour hold | ||||
Party | Candidate | Votes | % | |
---|---|---|---|---|
Conservative | David Goldsmith | 1,262 | 51.4% | |
Labour | John Harris | 837 | 34.1% | |
Liberal Democrats | Robin Whitmore | 180 | 7.3% | |
Green | Jennifer Overett | 174 | 7.1% | |
Majority | 425 | 17.3% | ||
Turnout | ||||
Conservative hold | ||||
Party | Candidate | Votes | % | |
---|---|---|---|---|
Labour | Martin Cook | 1,263 | 62.3% | |
Conservative | Carol Debman | 623 | 30.7% | |
Liberal Democrats | Jill Atkins | 141 | 7.0% | |
Majority | 640 | 31.6% | ||
Turnout | 2,027 | |||
Labour hold | ||||
Party | Candidate | Votes | % | |
---|---|---|---|---|
Labour | Peter Gardiner | 1,204 | 61.0% | |
Conservative | Maureen Springle | 544 | 27.6% | |
Liberal Democrats | Stuart McHardy | 226 | 11.4% | |
Majority | 660 | 33.4% | ||
Turnout | 1,974 | |||
Labour hold | ||||
Party | Candidate | Votes | % | |
---|---|---|---|---|
Conservative | Liz Harsant | 968 | 44.6% | |
Labour | Kenneth Douglas | 875 | 40.3% | |
Liberal Democrats | Rebecca Robinson | 213 | 9.8% | |
Independent | Dale Jackson | 114 | 5.3% | |
Majority | 93 | 4.3% | ||
Turnout | 2,170 | |||
Conservative hold | ||||
Party | Candidate | Votes | % | |
---|---|---|---|---|
Labour | William Knowles | 1,290 | 60.3% | |
Conservative | Oliver Hartley | 605 | 28.3% | |
Liberal Democrats | Mathew Baker | 244 | 11.4% | |
Majority | 685 | 32.0% | ||
Turnout | 2,139 | |||
Labour hold | ||||
Party | Candidate | Votes | % | |
---|---|---|---|---|
Labour | Tracy Grant | 1,490 | 50.5% | |
Conservative | Stephen Ion | 1,215 | 41.2% | |
Liberal Democrats | Gareth Jones | 246 | 8.3% | |
Majority | 275 | 9.3% | ||
Turnout | 2,951 | |||
Labour gain from Conservative | ||||
Party | Candidate | Votes | % | |
---|---|---|---|---|
Labour | Roger Fern | 1,202 | 57.0% | |
Conservative | Robert Hall | 781 | 37.0% | |
Liberal Democrats | Kenneth Toye | 126 | 6.0% | |
Majority | 421 | 20.0% | ||
Turnout | 2,109 | |||
Labour hold | ||||
Party | Candidate | Votes | % | |
---|---|---|---|---|
Labour | Neil Macdonald | 1,534 | 56.1% | |
Conservative | Edward Phillips | 948 | 34.7% | |
Liberal Democrats | Richard Hardacre | 253 | 9.3% | |
Majority | 586 | 21.4% | ||
Turnout | 2,735 | |||
Labour hold | ||||
Party | Candidate | Votes | % | |
---|---|---|---|---|
Conservative | Karen Stokes | 1,167 | 37.0% | |
Liberal Democrats | Kathy French | 1,107 | 35.1% | |
Labour | Kimberley Cook | 671 | 21.3% | |
Green | Amy Drayson | 211 | 6.7% | |
Majority | 60 | 1.9% | ||
Turnout | ||||
Conservative gain from Liberal Democrats | ||||
Party | Candidate | Votes | % | |
---|---|---|---|---|
Labour | Barry Studd | 985 | 47.1% | |
Conservative | Richard Pope | 876 | 41.9% | |
Green | Barry Broom | 129 | 6.2% | |
Liberal Democrats | Kevin Lock | 103 | 4.9% | |
Majority | 109 | 5.2% | ||
Turnout | 2,093 | |||
Labour gain from Conservative | ||||
Party | Candidate | Votes | % | |
---|---|---|---|---|
Labour | Julian Gibbs | 972 | 49.4% | |
Conservative | Lee Reynolds | 435 | 22.1% | |
Liberal Democrats | Timothy Lockington | 391 | 19.9% | |
Green | John Mann | 171 | 8.7% | |
Majority | 537 | 27.3% | ||
Turnout | 1,969 | |||
Labour gain from Liberal Democrats | ||||
Party | Candidate | Votes | % | |
---|---|---|---|---|
Labour | Martin Goonan | 950 | 52.1% | |
Conservative | Pamela Stewart | 632 | 34.7% | |
Liberal Democrats | Robert Chambers | 241 | 13.2% | |
Majority | 318 | 17.4% | ||
Turnout | 1,823 | |||
Labour hold | ||||
Party | Candidate | Votes | % | |
---|---|---|---|---|
Labour | Stephen Connelly | 1,108 | 50.2% | |
Conservative | Michelle Bevan-Margetts | 940 | 42.6% | |
Liberal Democrats | Nicholas Jacob | 158 | 7.2% | |
Majority | 168 | 7.6% | ||
Turnout | 2,206 | |||
Labour hold | ||||
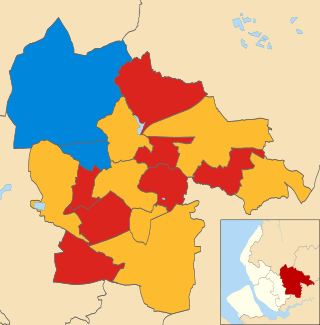
The 2006 St Helens Metropolitan Borough Council election took place on 4 May 2006 to elect members of St Helens Metropolitan Borough Council in Merseyside, England. One third of the council was up for election and the council stayed under no overall control.
The 2007 St Helens Metropolitan Borough Council election took place on 3 May 2007 to elect members of St Helens Metropolitan Borough Council in Merseyside, England. One third of the council was up for election and the council stayed under no overall control.
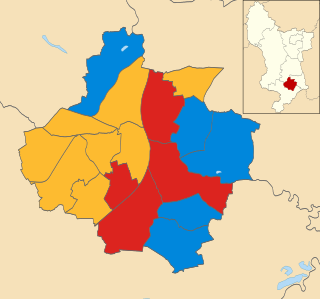
The 2008 Derby City Council election took place on 1 May 2008 to elect members of Derby City Council in England. One third of the council was up for election and the council stayed under no overall control. Overall turnout was 34.6%.
The 1999 Pendle Borough Council election took place on 6 May 1999 to elect members of Pendle Borough Council in Lancashire, England. One third of the council was up for election and the Liberal Democrats lost overall control of the council to no overall control.
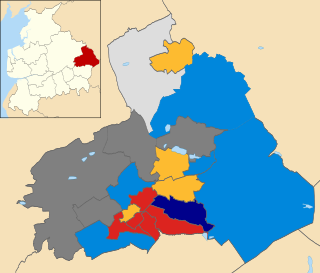
The 2008 Pendle Borough Council election took place on 1 May 2008 to elect members of Pendle Borough Council in Lancashire, England. One third of the council was up for election and the Liberal Democrats lost overall control of the council to no overall control.
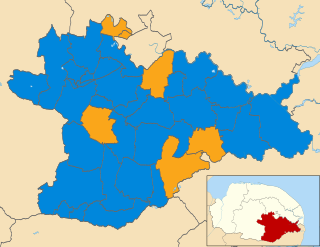
The elections to South Norfolk District Council were held on Thursday 5 May 2011 along with various other local elections around England, elections to the Scottish Parliament, National Assembly of Wales and Northern Ireland Assembly, and a referendum on whether to adopt the Alternative Vote electoral system for elections to the House of Commons. All 46 council seats were up for election. The previous council was controlled by the Conservatives, with the Liberal Democrats being the only opposition.
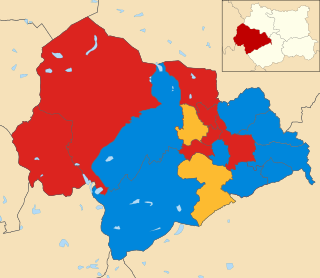
Elections to Calderdale Metropolitan Borough Council took place on Thursday 5 May 2011.
The 2011 council elections in Guildford saw the Conservatives retain control over Guildford Borough Council with an increased majority of 20 seats. Full results for each ward can be found at Guildford Council election, full results, 2011.
The 2006 Basingstoke and Deane Council election took place on 4 May 2006 to elect members of Basingstoke and Deane Borough Council in Hampshire, England. One third of the council was up for election and the council stayed under no overall control.
The 2011 Carlisle City Council election took place on 5 May 2011 to elect members of Carlisle District Council in Cumbria, England. One third of the council was up for election and the council stayed under no overall control.
The 2012 St Albans City and District Council election took place on 3 May 2012 to elect members of St Albans District Council in Hertfordshire, England. One third of the council was up for election and the council stayed under no overall control.
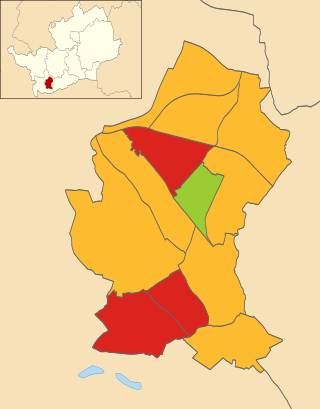
Elections to Watford Borough Council were held on 3 May 2012. Three years in every four, a third of the council retires and elections are held.
The 2008 Colchester Borough Council election took place on 1 May 2008 to elect members of Colchester Borough Council in Essex, England. One third of the council was up for election and the Conservative party lost overall control of the council to no overall control.
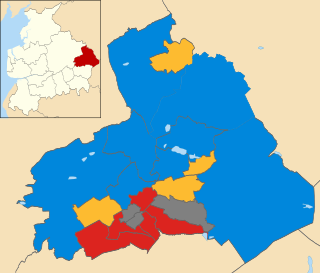
The 2011 Pendle Borough Council election took place on 5 May 2011 to elect members of Pendle Borough Council in Lancashire, England. One third of the council was up for election and the council stayed under no overall control.
The 2014 Pendle Borough Council election took place on 22 May 2014 to elect members of Pendle Borough Council in Lancashire, England. One third of the council was up for election and the council stayed under no overall control.
The 2011 Harlow District Council election took place on 5 May 2011 to elect members of Harlow District Council in Essex, England. One third of the council was up for election and the Conservative Party stayed in overall control of the council.
The 2006 Brent London Borough Council election took place on 4 May 2006 to elect members of Brent London Borough Council in London, England. The whole council was up for election and the Labour Party lost overall control of the council to no overall control.
The 2011 St Helens Metropolitan Borough Council election took place on 5 May 2011 to elect members of St Helens Metropolitan Borough Council in Merseyside, England. One third of the council was up for election and the Labour Party stayed in overall control of the council.