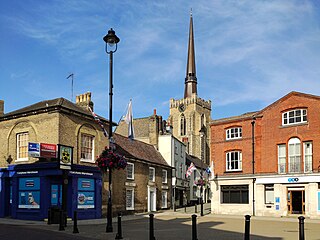
The 2019 Mid Suffolk District Council election took place on 2 May 2019 to elect members of Mid Suffolk District Council in England. [1]
| |||||||||||||||||||||||||||||||||||||||||||||||||||||||||||
All 34 seats for Mid Suffolk District Council 18 seats needed for a majority | |||||||||||||||||||||||||||||||||||||||||||||||||||||||||||
---|---|---|---|---|---|---|---|---|---|---|---|---|---|---|---|---|---|---|---|---|---|---|---|---|---|---|---|---|---|---|---|---|---|---|---|---|---|---|---|---|---|---|---|---|---|---|---|---|---|---|---|---|---|---|---|---|---|---|---|
| |||||||||||||||||||||||||||||||||||||||||||||||||||||||||||
Winner in each seat at the 2019 Mid Suffolk District Council election |
2019 Mid Suffolk District Council election | ||||||||||
---|---|---|---|---|---|---|---|---|---|---|
Party | Candidates | Seats | Gains | Losses | Net gain/loss | Seats % | Votes % | Votes | +/− | |
Conservative | 32 | 16 | 1 | 1 | 13 | 47.7 | 40.6 | 14,259 | –10.6 | |
Green | 21 | 12 | 1 | 0 | 7 | 35.3 | 34.0 | 11,944 | +18.8 | |
Liberal Democrats | 19 | 5 | 0 | 0 | 1 | 14.7 | 17.7 | 6,213 | +4.3 | |
Independent | 3 | 1 | 0 | 1 | 1 | 2.9 | 3.4 | 1,196 | –0.6 | |
Labour | 8 | 0 | 0 | 0 | 0.0 | 3.9 | 1,370 | –2.5 | ||
UKIP | 1 | 0 | 0 | 0 | 0.0 | 0.3 | 113 | –8.2 |
Party | Candidate | Votes | % | ||
---|---|---|---|---|---|
Green | Andrew Mellen | 633 | 64.9 | ||
Conservative | Jill Wilshaw | 343 | 35.1 | ||
Majority | 290 | 30.0 | |||
Turnout | 985 | 42.6 | |||
Green win (new seat) |
Party | Candidate | Votes | % | ||
---|---|---|---|---|---|
Green | Daniel Pratt | 424 | 57.1 | ||
Conservative | Kay Oakes | 319 | 42.9 | ||
Majority | 105 | 14.0 | |||
Turnout | 756 | 31.5 | |||
Green win (new seat) |
Party | Candidate | Votes | % | ||
---|---|---|---|---|---|
Liberal Democrats | John Field | 354 | 51.7 | ||
Conservative | Robert Grimsey | 196 | 28.6 | ||
Green | Peter Jousiffe | 135 | 19.7 | ||
Majority | 158 | 23.1 | |||
Turnout | 702 | 28.2 | |||
Liberal Democrats win (new seat) |
Party | Candidate | Votes | % | ||
---|---|---|---|---|---|
Conservative | James Caston | 348 | 57.6 | ||
Liberal Democrats | Martin Redbond | 256 | 42.4 | ||
Majority | 92 | 15.2 | |||
Turnout | 621 | 31.2 | |||
Conservative win (new seat) |
Party | Candidate | Votes | % | ||
---|---|---|---|---|---|
Conservative | Barry Humphreys | 552 | 48.7 | ||
Green | Oliver Amorowson | 548 | 48.3 | ||
Conservative | Gary Green | 428 | 37.7 | ||
Liberal Democrats | David Poulson | 360 | 31.7 | ||
Turnout | 1,147 | 25.5 | |||
Conservative win (new seat) | |||||
Green win (new seat) |
Party | Candidate | Votes | % | ±% | |
---|---|---|---|---|---|
Conservative | John Whitehead | 749 | 53.4 | ||
Conservative | Timothy Passmore | 717 | 51.1 | ||
Green | Helen Bridgeman | 562 | 40.1 | ||
Liberal Democrats | Mark Valladares | 427 | 30.5 | ||
Turnout | 1,434 | 31.0 | |||
Conservative hold | Swing | ||||
Party | Candidate | Votes | % | ||
---|---|---|---|---|---|
Independent | Gerard Brewster | 893 | 61.8 | ||
Liberal Democrats | Keith Scarff | 557 | 38.5 | ||
Conservative | Nicholas Gowrley | 443 | 30.7 | ||
Green | Miles Row | 443 | 30.7 | ||
Majority | |||||
Turnout | 1,458 | 30.5 | |||
Independent win (new seat) | |||||
Liberal Democrats win (new seat) |
Party | Candidate | Votes | % | ±% | |
---|---|---|---|---|---|
Conservative | Dorothy Guthrie | 605 | 70.1 | +19.7 | |
Labour | Terence Wilson | 258 | 29.9 | +8.2 | |
Majority | |||||
Turnout | 910 | 37.0 | |||
Conservative hold | Swing | ||||
Party | Candidate | Votes | % | ||
---|---|---|---|---|---|
Green | Sarah Mansel | 1,006 | 59.6 | ||
Green | Helen Geake | 925 | 54.8 | ||
Conservative | Jane Storey | 719 | 42.6 | ||
Liberal Democrats | Kerry Burn | 204 | 12.1 | ||
Majority | |||||
Turnout | 1,702 | 35.0 | |||
Green win (new seat) | |||||
Green win (new seat) |
Party | Candidate | Votes | % | ±% | |
---|---|---|---|---|---|
Conservative | Peter Gould | 419 | 52.9 | New | |
Liberal Democrats | Timothy Glenton | 370 | 47.1 | New | |
Majority | |||||
Turnout | |||||
Conservative gain from Independent | Swing | ||||
Party | Candidate | Votes | % | ±% | |
---|---|---|---|---|---|
Conservative | Lavinia Hadingham | 518 | 54.8 | -5.9 | |
Green | Peter Davies | 206 | 21.8 | New | |
Independent | Garry Deeks | 141 | 14.9 | New | |
Liberal Democrats | Paul Seeman | 80 | 8.5 | -10.0 | |
Majority | 312 | 33.0 | |||
Turnout | 955 | 40.2 | |||
Conservative hold | Swing | ||||
Party | Candidate | Votes | % | ±% | |
---|---|---|---|---|---|
Green | Rowland Warboys | 506 | 48.8 | +11.2 | |
Conservative | Christopher Pitt | 421 | 40.6 | -21.8 | |
Labour | Joanne Clifford | 110 | 10.6 | New | |
Majority | 85 | 8.2 | |||
Turnout | 1,056 | 41.6 | |||
Green gain from Conservative | Swing | ||||
Party | Candidate | Votes | % | ||
---|---|---|---|---|---|
Green | Rachel Eburne | 1,363 | 78.2 | ||
Green | Keith Welham | 1,277 | 73.2 | ||
Conservative | Stephen Britt | 337 | 19.3 | ||
Conservative | James Passmore | 293 | 16.8 | ||
Majority | |||||
Turnout | 1,755 | 40.0 | |||
Green win (new seat) | |||||
Green win (new seat) |
Party | Candidate | Votes | % | ||
---|---|---|---|---|---|
Conservative | Matthew Hicks | 533 | 58.9 | ||
Green | David Penny | 182 | 20.1 | ||
Liberal Democrats | Stephen Card | 108 | 11.9 | ||
Labour | Anthony Scott-Robinson | 82 | 9.1 | ||
Majority | |||||
Turnout | 935 | 40.7 | |||
Conservative win (new seat) |
Party | Candidate | Votes | % | ±% | |
---|---|---|---|---|---|
Green | Andrew Stringer | 838 | 72.0 | +8.8 | |
Conservative | Elaine Bryce | 326 | 28.0 | -8.8 | |
Majority | |||||
Turnout | 1,170 | 49.5 | |||
Green hold | Swing | ||||
Party | Candidate | Votes | % | ±% | |
---|---|---|---|---|---|
Liberal Democrats | Michael Norris | 847 | 63.5 | ||
Liberal Democrats | Stephen Phillips | 805 | 60.3 | ||
Conservative | Matthew Oakes | 442 | 33.1 | ||
Conservative | Paul Allen | 370 | 27.7 | ||
Majority | |||||
Turnout | 1,364 | 28.2 | |||
Liberal Democrats hold | Swing | ||||
Party | Candidate | Votes | % | ±% | |
---|---|---|---|---|---|
Green | John Matthissen | 463 | 55.6 | -0.6 | |
Conservative | James Spencer | 245 | 29.4 | New | |
Liberal Democrats | Nichola Willshere | 125 | 15.0 | -2.6 | |
Majority | |||||
Turnout | 844 | 38.4 | |||
Green hold | Swing | ||||
Party | Candidate | Votes | % | ±% | |
---|---|---|---|---|---|
Conservative | David Burn | 465 | 58.1 | -7.0 | |
Green | Gillian Heriz-Smith | 335 | 41.9 | +23.9 | |
Majority | |||||
Turnout | 812 | 36.9 | |||
Conservative hold | Swing | ||||
Party | Candidate | Votes | % | ±% | |
---|---|---|---|---|---|
Liberal Democrats | Penelope Otton | 628 | 63.4 | +4.8 | |
Conservative | Gillian Morgan | 254 | 25.7 | -15.7 | |
Labour | Philip Cockell | 108 | 10.9 | New | |
Majority | |||||
Turnout | 1,002 | 40.9 | |||
Liberal Democrats hold | Swing | ||||
Party | Candidate | Votes | % | ||
---|---|---|---|---|---|
Conservative | Jessica Fleming | 502 | 62.4 | ||
Labour | Susan Coe | 302 | 37.6 | ||
Majority | |||||
Turnout | 843 | 35.3 | |||
Conservative win (new seat) |
Party | Candidate | Votes | % | ||
---|---|---|---|---|---|
Conservative | Paul Ekpenyong | 282 | 50.1 | ||
Liberal Democrats | David Child | 281 | 49.9 | ||
Majority | |||||
Turnout | 600 | 25.8 | |||
Conservative win (new seat) |
Party | Candidate | Votes | % | ||
---|---|---|---|---|---|
Conservative | Susan Morley | 413 | 44.8 | ||
Green | Nicholas Hardingham | 304 | 33.0 | ||
UKIP | Jeremy Hall | 113 | 12.3 | ||
Liberal Democrats | David Payne | 91 | 9.9 | ||
Majority | 109 | 11.8 | |||
Turnout | 926 | 39.8 | |||
Conservative win (new seat) |
Party | Candidate | Votes | % | ||
---|---|---|---|---|---|
Conservative | David Muller | 475 | 51.8 | ||
Green | Terence Carter | 415 | 45.3 | ||
Conservative | Clifton Bushe | 400 | 43.6 | ||
Labour | William Howman | 238 | 26.0 | ||
Majority | |||||
Turnout | 934 | 22.0 | |||
Conservative win (new seat) | |||||
Green win (new seat) |
Party | Candidate | Votes | % | ±% | |
---|---|---|---|---|---|
Conservative | Julie Flatman | 616 | 68.2 | -1.8 | |
Liberal Democrats | Catherine Leith | 287 | 31.8 | New | |
Majority | |||||
Turnout | 943 | 38.8 | |||
Conservative hold | Swing | ||||
Party | Candidate | Votes | % | ||
---|---|---|---|---|---|
Green | Wendy Turner | 732 | 45.6 | ||
Conservative | Harold Richardson | 633 | 39.4 | ||
Conservative | Oliver Passmore | 498 | 31.0 | ||
Green | Susan Tytler | 438 | 27.3 | ||
Liberal Democrats | Ellen Kirkby | 206 | 12.8 | ||
Independent | Olivia Boland | 162 | 10.1 | ||
Liberal Democrats | Francis Wright | 158 | 9.8 | ||
Labour | Ursula Ajimal | 136 | 8.5 | ||
Majority | |||||
Turnout | 1,624 | 35.5 | |||
Green win (new seat) | |||||
Conservative win (new seat) |
Party | Candidate | Votes | % | ||
---|---|---|---|---|---|
Conservative | Richard Meyer | 428 | 50.8 | ||
Green | Stuart Masters | 209 | 24.8 | ||
Labour | John Dougall | 136 | 16.2 | ||
Liberal Democrats | Martin Spurling | 69 | 8.2 | ||
Majority | |||||
Turnout | 854 | 33.3 | |||
Conservative win (new seat) |
Party | Candidate | Votes | % | ±% | |
---|---|---|---|---|---|
Green | Austin Davies | 845 | 64.4 | +25.2 | |
Conservative | Philippa Wilding | 399 | 30.4 | -3.5 | |
Liberal Democrats | Timothy Glenton | 37 | 2.8 | -8.2 | |
Labour | Terence Wilson | 32 | 2.4 | -4.8 | |
Majority | 446 | 34.0 | |||
Turnout | 1,320 | 28.1 | |||
Green hold | Swing | 14.4 | |||
Mid Suffolk is a local government district in Suffolk, England. The district is primarily a rural area, containing just three towns, being Stowmarket, Needham Market and Eye. Its council was based in Needham Market until 2017 when it moved to shared offices with neighbouring Babergh District Council in Ipswich, outside either district. In 2021 it had a population of 103,417.
Babergh District is a local government district in Suffolk, England. In 2021 it had a population of 92,300. The district is primarily a rural area, containing just two towns, Sudbury and Hadleigh, which was the administrative centre until 2017 when the council moved to shared offices with neighbouring Mid Suffolk District Council in Ipswich, outside either district. The district is named after the medieval Babergh Hundred, which covered part of the area.
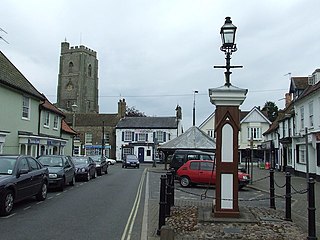
Forest Heath was a local government district in Suffolk, England. Its council was based in Mildenhall. Other towns in the district included Newmarket. The population of the district at the 2011 Census was 59,748.
Central Suffolk and North Ipswich is a constituency represented in the House of Commons of the UK Parliament since 2010 by Dan Poulter, a Conservative.
Mid Suffolk District Council elections are held every four years to elect members of Mid Suffolk District Council in Suffolk, England. Since the last boundary changes in 2019, there have been 34 councillors elected from 26 wards.
Suffolk County Council is the administrative authority for the county of Suffolk, England. It is run by 75 elected county councillors representing 63 divisions. It is a member of the East of England Local Government Association.
Suffolk Coastal District Council in Suffolk, England was elected every four years. After the last boundary changes in 2015, 42 councillors were elected from 26 wards. The council was abolished in 2019, with the area becoming part of East Suffolk.
In the 2011 United Kingdom local elections, the Conservative Party held onto the Mid Suffolk District Council for a third term and even increased their majority. The Liberal Democrats lost four seats but remained in second place while the Green Party and the Labour Party each gained a seat, which is Labour's only seat on the Council.
The candidate information for the Palgrave Ward in Mid-Suffolk, Suffolk, England.
The candidate information for the Claydon and Barham Ward in Mid-Suffolk, Suffolk, England. This ward selected two councillors.
Needham Market Ward is a local government ward in Mid-Suffolk, Suffolk, England has elected two councillors. The next election is scheduled for May 2023.
Woolpit was an electoral ward of Mid-Suffolk district, in Suffolk, England, named after the village of Woolpit. The ward was abolished in 2019 when new wards were formed throughout the district; Woolpit village became part of Elmswell & Woolpit Ward.
The 2015 Mid Suffolk District Council election took place on the 7 May 2015 to elect members of Mid Suffolk District Council in England. It was held on same day as many UK local elections and the general election.
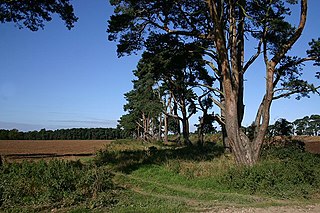
West Suffolk District is a local government district in Suffolk, England. It was established in 2019 as a merger of the previous Forest Heath District with the Borough of St Edmundsbury. The council is based in Bury St Edmunds, the district's largest town. The district also contains the towns of Brandon, Clare, Haverhill, Mildenhall and Newmarket, along with numerous villages and surrounding rural areas. In 2021 it had a population of 180,820.
East Suffolk is a local government district in Suffolk, England. The largest town is Lowestoft, which contains Ness Point, the easternmost point of the United Kingdom. The second largest town is Felixstowe, which has the country's largest container port. On the district's south-western edge it includes parts of the Ipswich built-up area. The rest of the district is largely rural, containing many towns and villages, including several seaside resorts. Its council is based in the village of Melton. The district was formed in 2019 as a merger of the two previous districts of Suffolk Coastal and Waveney. In 2021 it had a population of 246,058. It is the most populous district in the country not to be a unitary authority.
The 2019 West Suffolk District Council election was held on 2 May 2019 and was the inaugural election of the new West Suffolk District Council. It was held concurrently with other local elections across the United Kingdom.
The 1995 Mid Suffolk District Council election took place on 4 May 1995 to elect members of Mid Suffolk District Council in England. This was on the same day as other local elections.
The 1999 Mid Suffolk District Council election took place on 6 May 1999 to elect members of Mid Suffolk District Council in England. This was on the same day as other local elections.
The 2003 Mid Suffolk District Council election took place on 1 May 2003 to elect members of Mid Suffolk District Council in England. This was on the same day as other local elections.
The 2007 Mid Suffolk District Council election took place on 3 May 2007 to elect members of Mid Suffolk District Council in England. This was on the same day as other local elections.